| Param | Original file | Final file |
|---|---|---|
| Filename | modeM0/AS1G05_238T04_9000000416cztM0_level2.fits | modeM0/AS1G05_238T04_9000000416cztM0_level2_quad_clean.evt |
| Size (bytes) | 938,603,520 | 1,104,324,480 |
| Size | 895.1 MB | 1.0 GB |
| Events in quadrant A | 5,509,686 | 6,777,177 |
| Events in quadrant B | 5,363,884 | 6,776,122 |
| Events in quadrant C | 5,440,470 | 6,523,550 |
| Events in quadrant D | 4,518,544 | 5,781,408 |
| Mode M0 | |||
|---|---|---|---|
| Quadrant | BADHDUFLAG | Total packets | Discarded packets |
| A | 0 | 255331 | 0 |
| B | 0 | 243515 | 0 |
| C | 0 | 249111 | 0 |
| D | 0 | 312579 | 0 |
| Mode SS | |||
|---|---|---|---|
| Quadrant | BADHDUFLAG | Total packets | Discarded packets |
| A | 0 | 2212 | 0 |
| B | 0 | 2212 | 0 |
| C | 0 | 2212 | 0 |
| D | 0 | 2212 | 0 |
| Mode M9 | |||
|---|---|---|---|
| Quadrant | BADHDUFLAG | Total packets | Discarded packets |
| A | 0 | 579 | 0 |
| B | 0 | 579 | 0 |
| C | 0 | 579 | 0 |
| D | 0 | 579 | 0 |
| Quadrant | Total seconds | Saturated seconds | Saturation percentage |
|---|---|---|---|
| A | 110960 | 2496 | 2.249459% |
| B | 110929 | 1258 | 1.134059% |
| C | 110943 | 1476 | 1.330413% |
| D | 110839 | 6502 | 5.866166% |
Noise dominated data is calculated using 1-second bins in cleaned event files. If a bin has >2000 counts, and if more than 50% of those come from <1% of pixels, then it is considered to be noise-dominated and hence unusable.
| Quadrant | # 1 sec bins | Bins with >0 counts | Bins with >2000 counts | High rate bins dominated by noise | Noise dominated (total time) | Noise dominated (detector-on time) | Marked lightcurve |
|---|---|---|---|---|---|---|---|
| A | 168853 | 110931 | 0 | 0 | 0.00% | 0.00% |  |
| B | 168853 | 110916 | 0 | 0 | 0.00% | 0.00% |  |
| C | 168853 | 110922 | 0 | 0 | 0.00% | 0.00% |  |
| D | 168853 | 110724 | 0 | 0 | 0.00% | 0.00% |  |
Top three noisy pixels from each quadrant. If the there are fewer than three noisy pixels in the level2.evt file, extra rows are filled as -1
| Pixel properties | Quadrant properties | ||||||
|---|---|---|---|---|---|---|---|
| Quadrant | DetID | PixID | Counts | Sigma | Mean | Median | Sigma |
| A | 0 | 29 | 5499 | 11.22 | 1437 | 1342 | 370.6 |
| A | 7 | 110 | 4913 | 9.64 | 1437 | 1342 | 370.6 |
| A | 9 | 19 | 4233 | 7.8 | 1437 | 1342 | 370.6 |
| B | 2 | 9 | 4800 | 12.32 | 1424 | 1360 | 279.3 |
| B | 12 | 226 | 4156 | 10.01 | 1424 | 1360 | 279.3 |
| B | 5 | 128 | 4122 | 9.89 | 1424 | 1360 | 279.3 |
| C | 1 | 81 | 4454 | 8.19 | 1441 | 1339 | 380.4 |
| C | 1 | 80 | 4352 | 7.92 | 1441 | 1339 | 380.4 |
| C | 1 | 65 | 3922 | 6.79 | 1441 | 1339 | 380.4 |
| D | 6 | 44 | 3513 | 6.78 | 1302 | 1180 | 344.2 |
| D | 6 | 231 | 3435 | 6.55 | 1302 | 1180 | 344.2 |
| D | 7 | 5 | 3399 | 6.45 | 1302 | 1180 | 344.2 |
Histogram calculated using DETX and DETY for each event in the final _common_clean file
| Quadrant A | 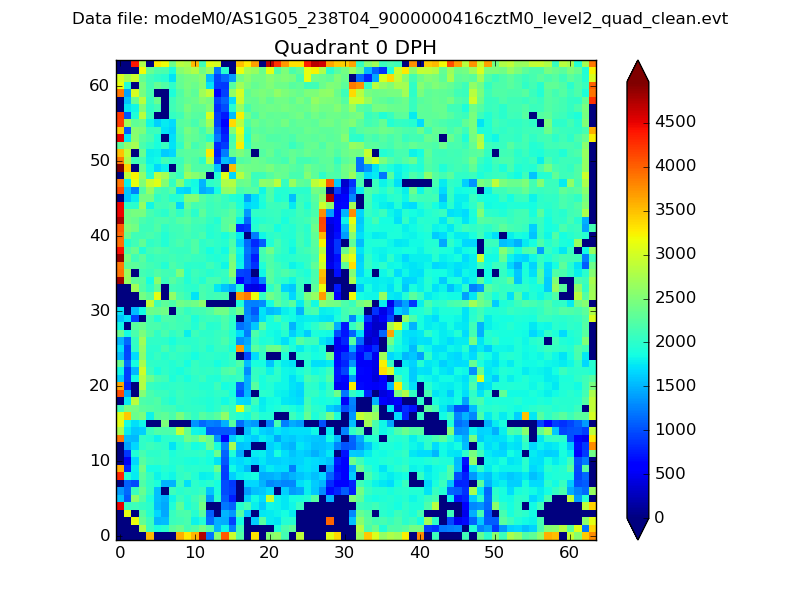 |
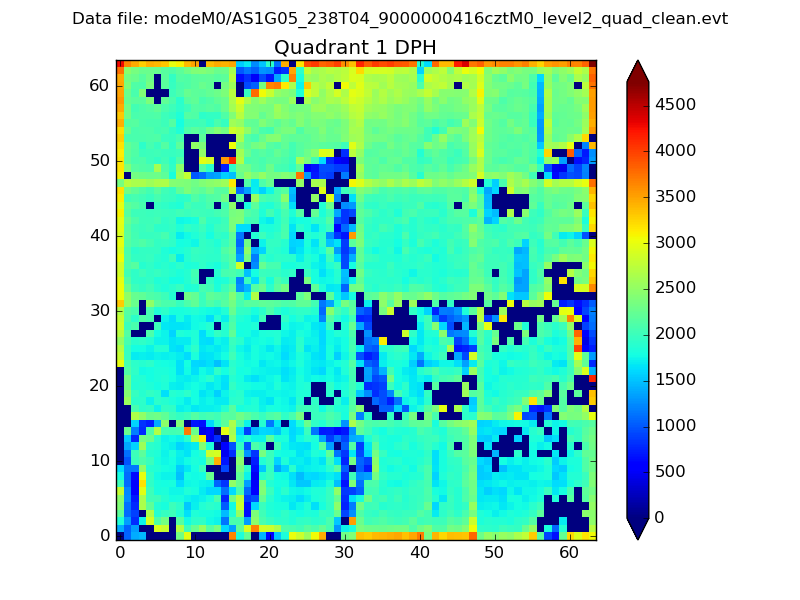 |
Quadrant B |
|---|---|---|---|
| Quadrant D |  |
 |
Quadrant C |
| Plot type | Count rate plots | Images |
|---|---|---|
| Comparison with Poisson distribution Blue bars denote a histogram of data divided into 1 sec bins. Red curve is a Poisson curve with rate = median count rate of data. |
 |
 |
| Quadrant-wise count rates Data is divided into 100 sec bins |
 |
|
| Module-wise count rates for Quadrant A Data is divided into 100 sec bins |
 |
 |
| Module-wise count rates for Quadrant B Data is divided into 100 sec bins |
 |
 |
| Module-wise count rates for Quadrant C Data is divided into 100 sec bins |
 |
 |
| Module-wise count rates for Quadrant D Data is divided into 100 sec bins |
 |
 |
| Parameter | Plot |
|---|---|
| CZT HV Monitor |  |
| D_VDD |  |
| Temperature 1 |  |
| Veto HV Monitor |  |
| Veto LLD |  |
| Alpha Counter |  |
| _CPM_Rate |  |
| CZT Counter |  |
| +2.5 Volts monitor |  |
| +5 Volts monitor |  |
| _ROLL_ROT |  |
| _Roll_DEC |  |
| _Roll_RA |  |
| Veto Counter |  |