| Param | Original file | Final file |
|---|---|---|
| Filename | modeM0/AS1G05_238T04_9000000416_02947cztM0_level2.evt | modeM0/AS1G05_238T04_9000000416_02947cztM0_level2_quad_clean.evt |
| Size (bytes) | 433,595,520 | 31,858,560 |
| Size | 413.5 MB | 30.4 MB |
| Events in quadrant A | 2,802,699 | 183,878 |
| Events in quadrant B | 1,985,996 | 183,563 |
| Events in quadrant C | 2,025,196 | 180,137 |
| Events in quadrant D | 6,050,760 | 138,777 |
| Mode M0 | |||
|---|---|---|---|
| Quadrant | BADHDUFLAG | Total packets | Discarded packets |
| A | 0 | 10916 | 2 |
| B | 0 | 8654 | 1 |
| C | 0 | 8515 | 1 |
| D | 0 | 20695 | 1 |
| Mode SS | |||
|---|---|---|---|
| Quadrant | BADHDUFLAG | Total packets | Discarded packets |
| A | 0 | 82 | 0 |
| B | 0 | 82 | 0 |
| C | 0 | 82 | 0 |
| D | 0 | 82 | 0 |
| Mode M9 | |||
|---|---|---|---|
| Quadrant | BADHDUFLAG | Total packets | Discarded packets |
| A | 0 | 21 | 0 |
| B | 0 | 21 | 0 |
| C | 0 | 21 | 0 |
| D | 0 | 21 | 0 |
| Quadrant | Total seconds | Saturated seconds | Saturation percentage |
|---|---|---|---|
| A | 3921 | 176 | 4.488651% |
| B | 3921 | 29 | 0.739607% |
| C | 3921 | 18 | 0.459067% |
| D | 3921 | 1414 | 36.062229% |
Noise dominated data is calculated using 1-second bins in cleaned event files. If a bin has >2000 counts, and if more than 50% of those come from <1% of pixels, then it is considered to be noise-dominated and hence unusable.
| Quadrant | # 1 sec bins | Bins with >0 counts | Bins with >2000 counts | High rate bins dominated by noise | Noise dominated (total time) | Noise dominated (detector-on time) | Marked lightcurve |
|---|---|---|---|---|---|---|---|
| A | 6076 | 3922 | 130 | 130 | 2.14% | 3.31% | 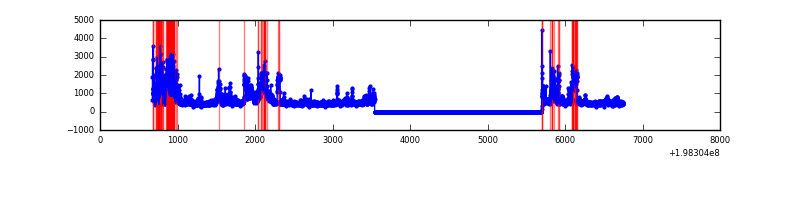 |
| B | 6076 | 3922 | 22 | 22 | 0.36% | 0.56% | 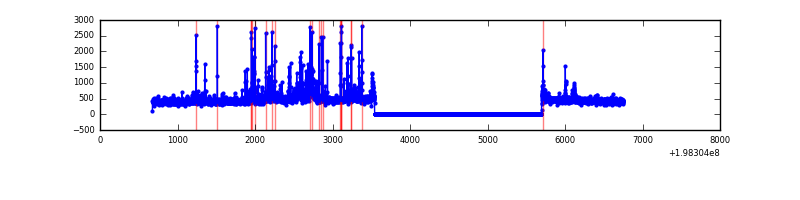 |
| C | 6076 | 3922 | 18 | 18 | 0.30% | 0.46% | 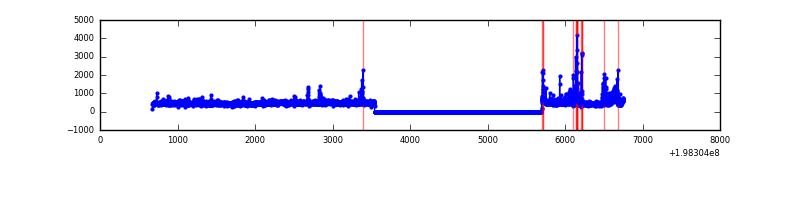 |
| D | 6076 | 3922 | 1143 | 1143 | 18.81% | 29.14% | 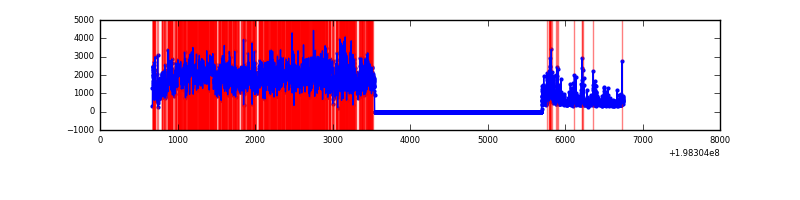 |
Top three noisy pixels from each quadrant. If the there are fewer than three noisy pixels in the level2.evt file, extra rows are filled as -1
| Pixel properties | Quadrant properties | ||||||
|---|---|---|---|---|---|---|---|
| Quadrant | DetID | PixID | Counts | Sigma | Mean | Median | Sigma |
| A | 14 | 238 | 508472 | 5839.55 | 419 | 408 | 87.0 |
| A | 12 | 133 | 437540 | 5024.27 | 419 | 408 | 87.0 |
| A | 14 | 63 | 109476 | 1253.6 | 419 | 408 | 87.0 |
| B | 2 | 249 | 99338 | 1165.8 | 426 | 416 | 84.9 |
| B | 3 | 27 | 86006 | 1008.68 | 426 | 416 | 84.9 |
| B | 8 | 3 | 36167 | 421.33 | 426 | 416 | 84.9 |
| C | 0 | 219 | 202215 | 2084.62 | 406 | 406 | 96.8 |
| C | 6 | 80 | 68857 | 707.08 | 406 | 406 | 96.8 |
| C | 1 | 192 | 56747 | 581.98 | 406 | 406 | 96.8 |
| D | 15 | 50 | 1633192 | 18081.72 | 355 | 348 | 90.3 |
| D | 15 | 194 | 1059047 | 11723.78 | 355 | 348 | 90.3 |
| D | 2 | 102 | 716045 | 7925.46 | 355 | 348 | 90.3 |
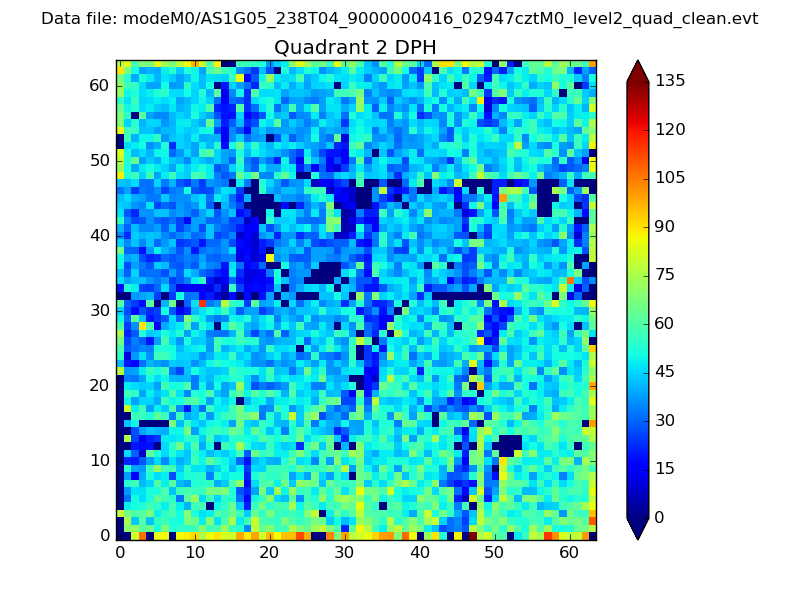
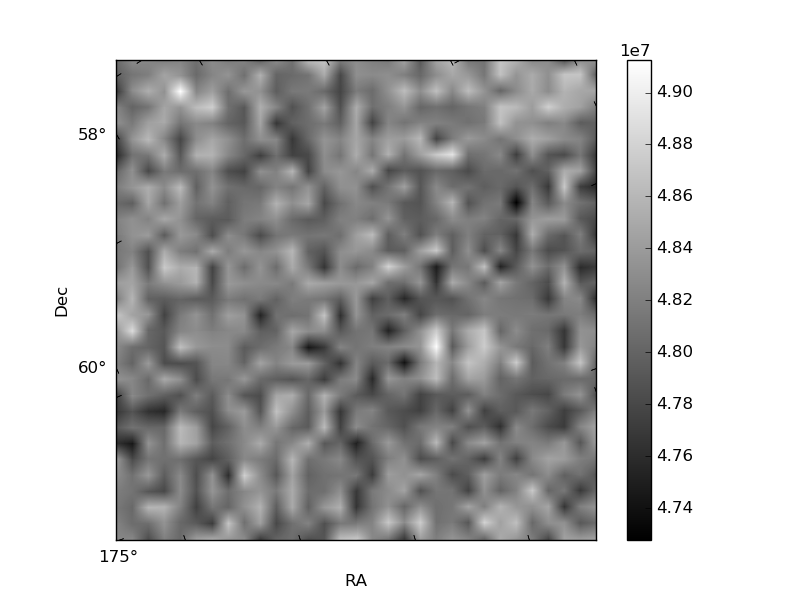
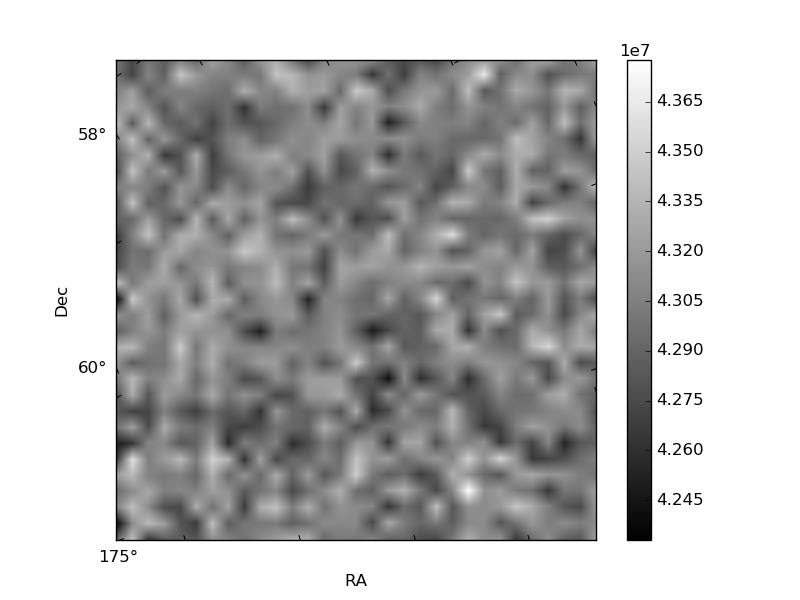
Histogram calculated using DETX and DETY for each event in the final _common_clean file
| Quadrant A | 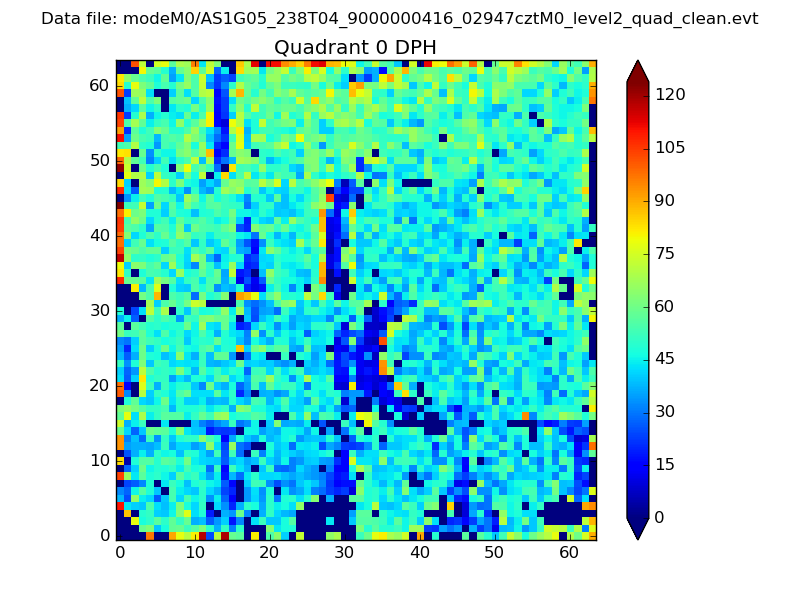 |
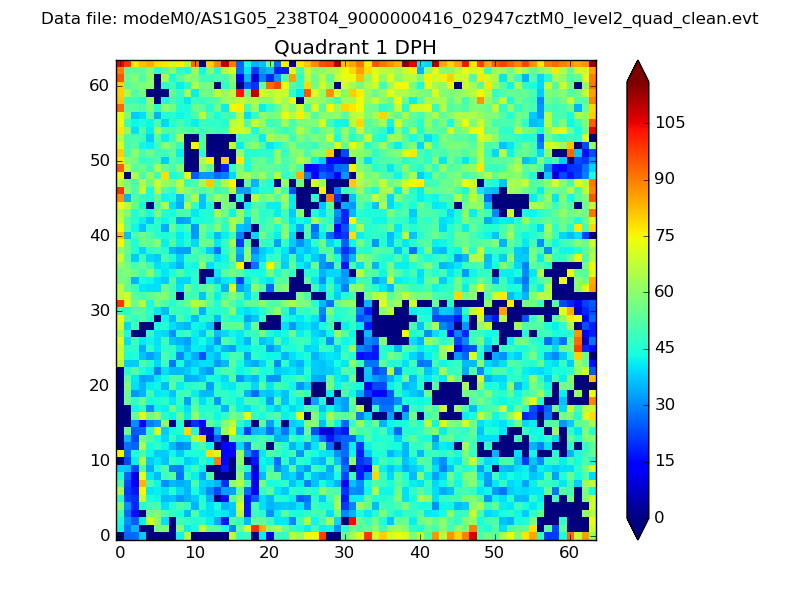 |
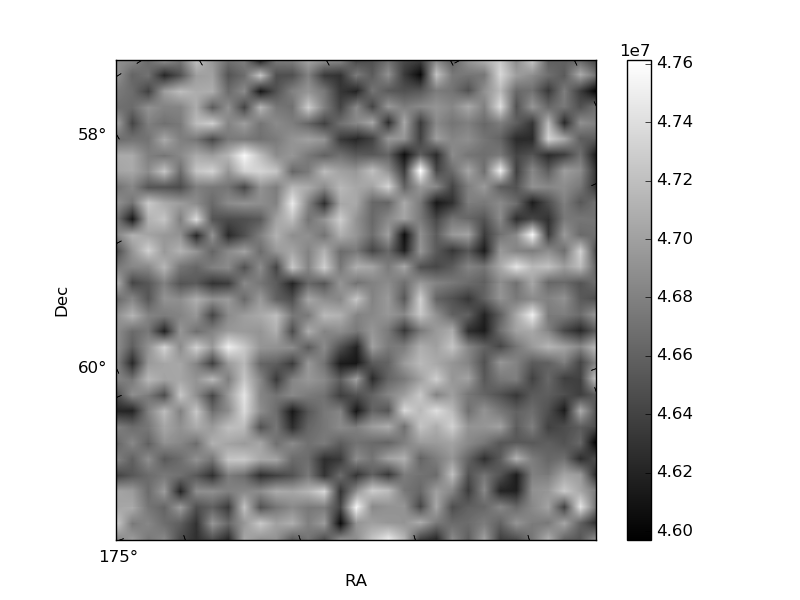
Quadrant B |
|---|---|---|---|
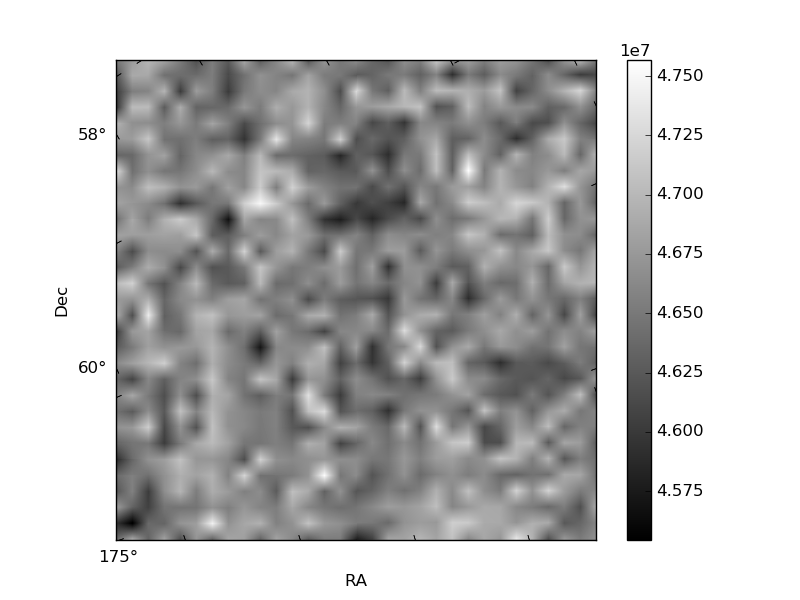
| Quadrant D | 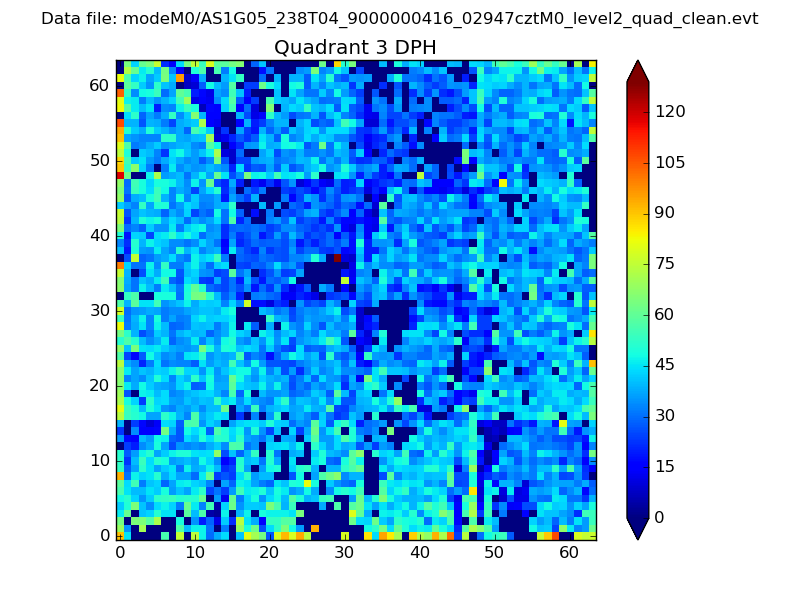 |
 |
Quadrant C |
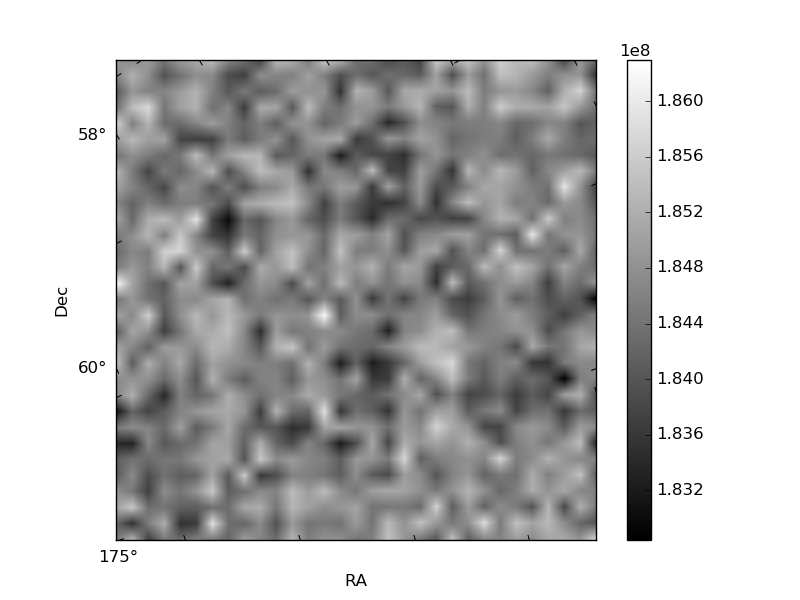
| Plot type | Count rate plots | Images |
|---|---|---|
| Comparison with Poisson distribution Blue bars denote a histogram of data divided into 1 sec bins. Red curve is a Poisson curve with rate = median count rate of data. |
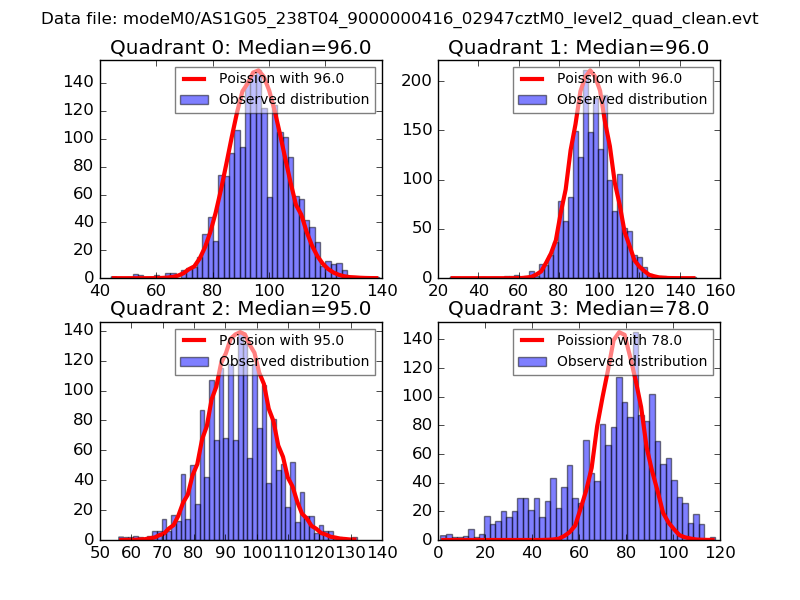 |
 |
| Quadrant-wise count rates Data is divided into 100 sec bins |
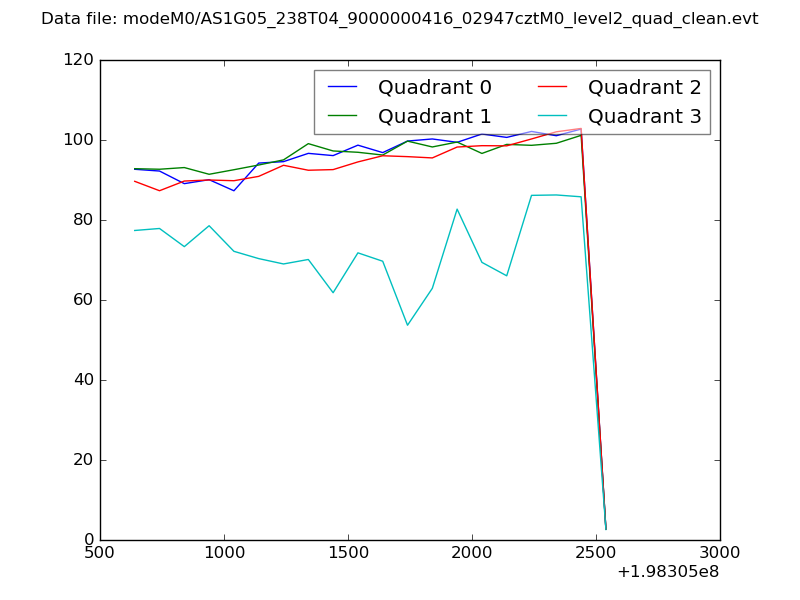 |
|
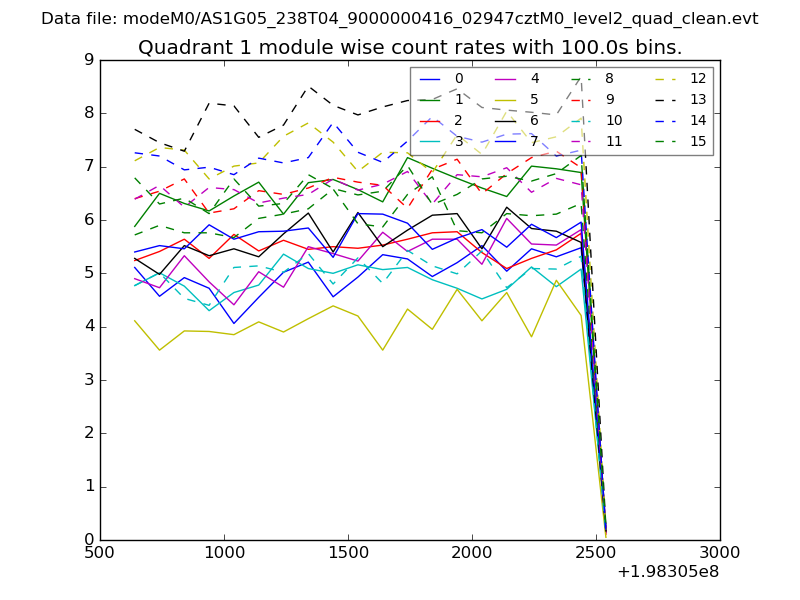
| Module-wise count rates for Quadrant A Data is divided into 100 sec bins |
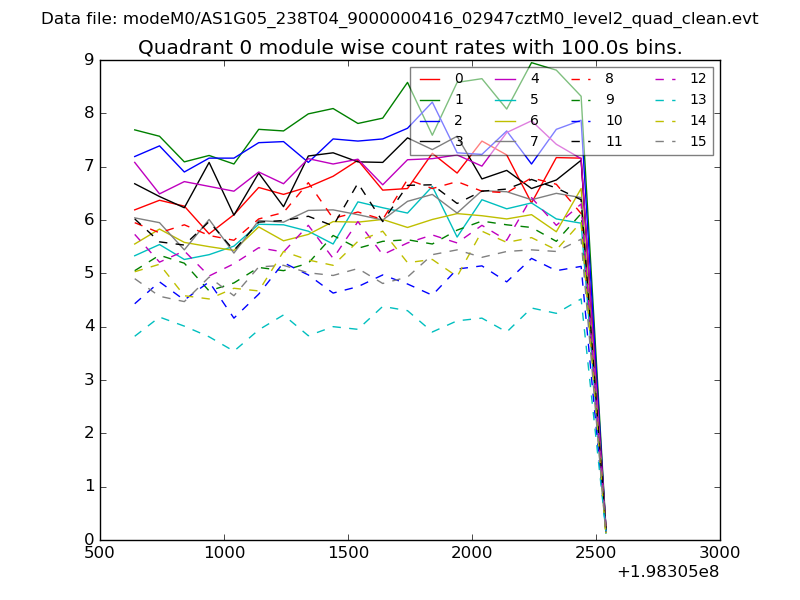 |
 |
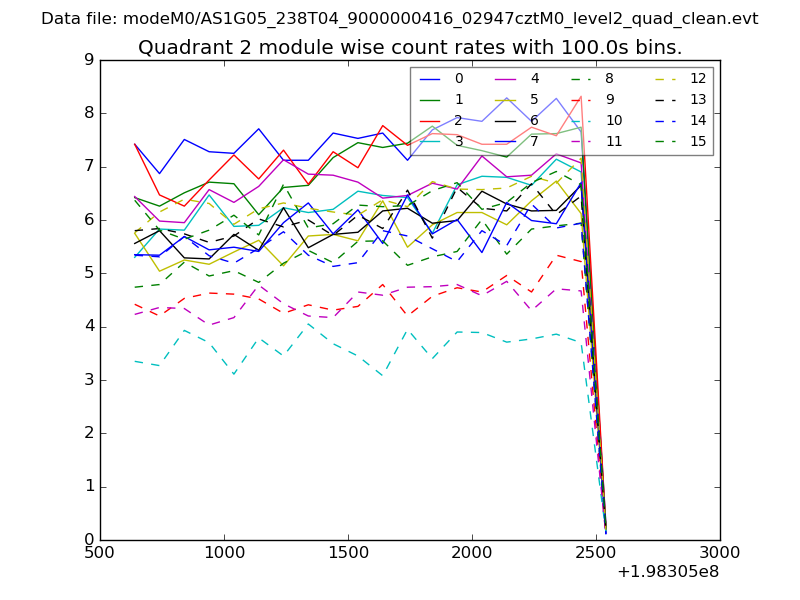
| Module-wise count rates for Quadrant B Data is divided into 100 sec bins |
 |
 |
| Module-wise count rates for Quadrant C Data is divided into 100 sec bins |
 |
 |
| Module-wise count rates for Quadrant D Data is divided into 100 sec bins |
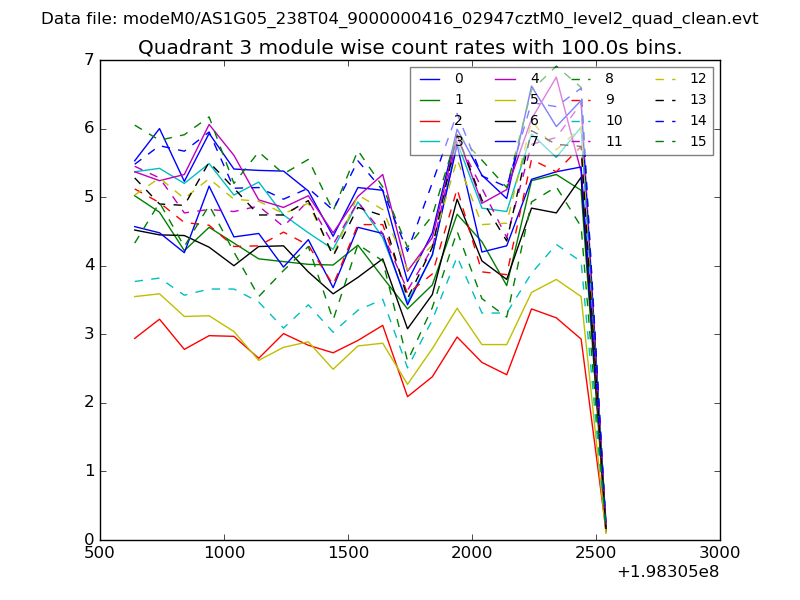 |
 |
| Parameter | Plot |
|---|---|
| CZT HV Monitor | 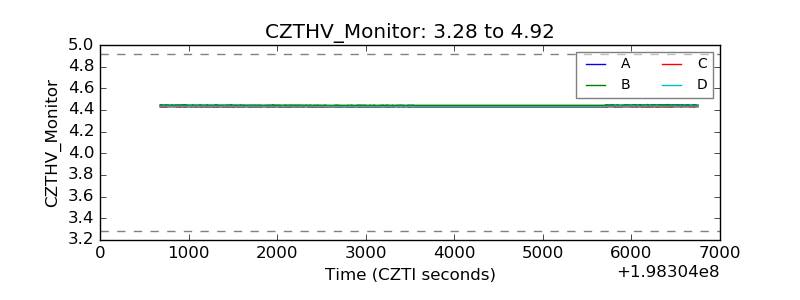 |
| D_VDD | 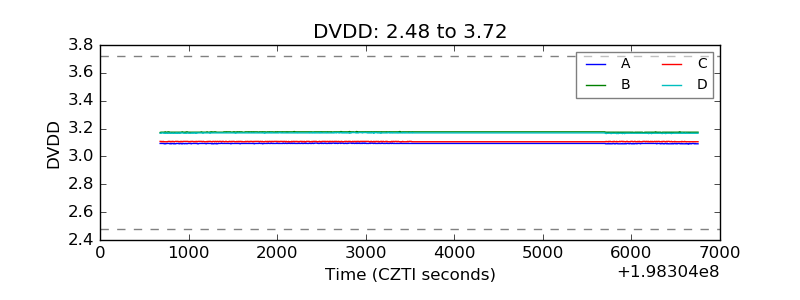 |
| Temperature 1 | 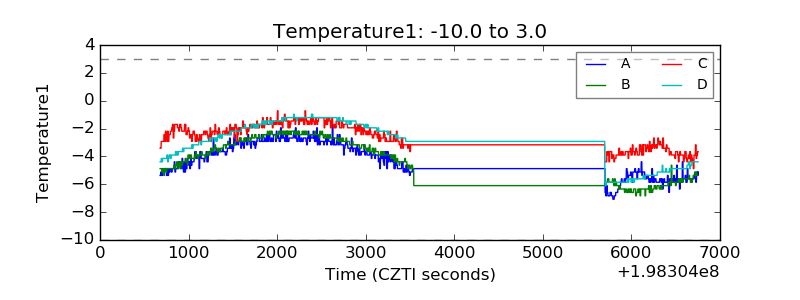 |
| Veto HV Monitor | 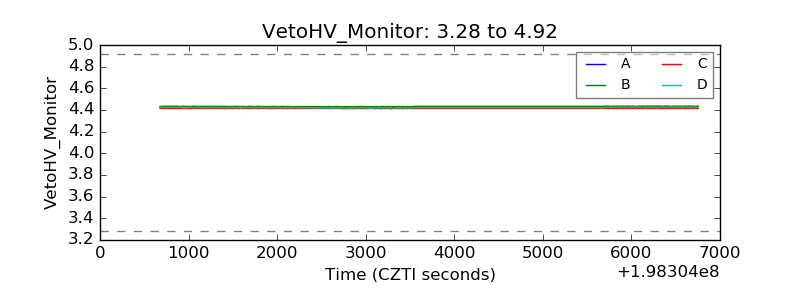 |
| Veto LLD | 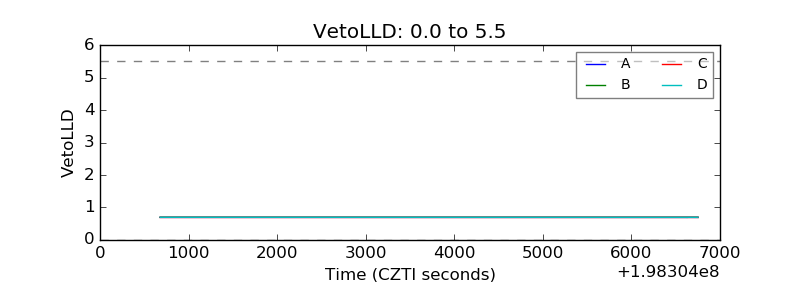 |
| Alpha Counter | 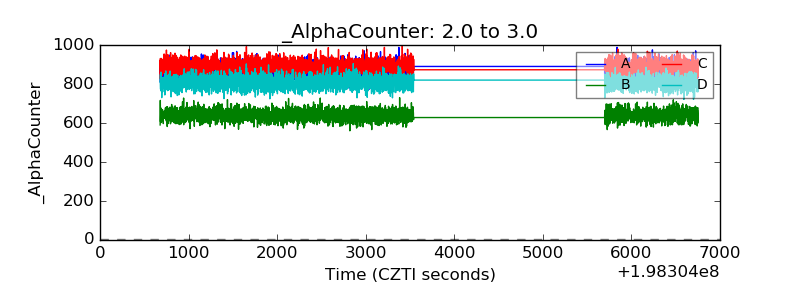 |
| _CPM_Rate | 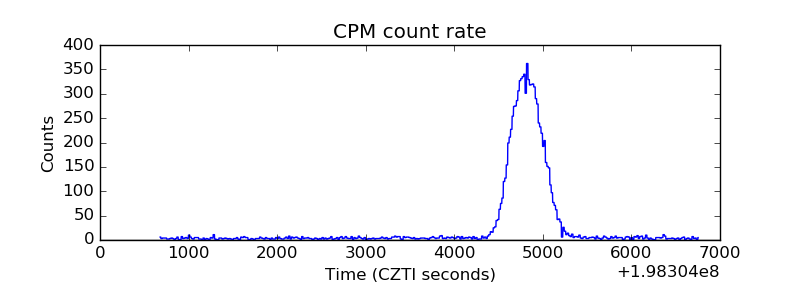 |
| CZT Counter | 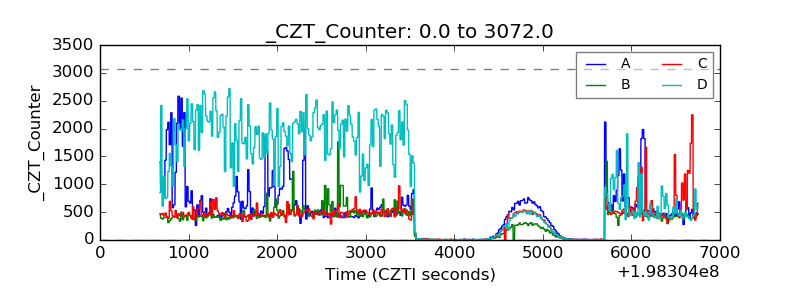 |
| +2.5 Volts monitor |  |
| +5 Volts monitor |  |
| Veto Counter | 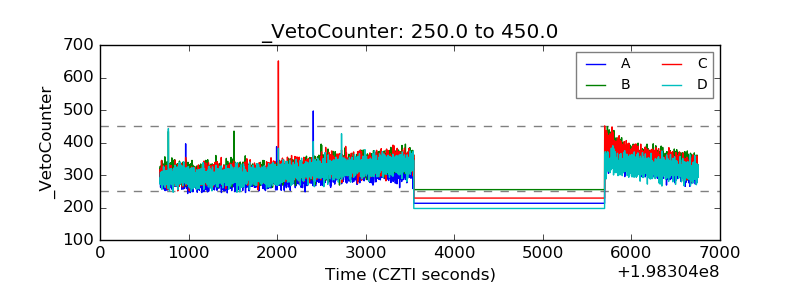 |