| Param | Original file | Final file |
|---|---|---|
| Filename | modeM0/AS1G05_238T04_9000000416_02948cztM0_level2.evt | modeM0/AS1G05_238T04_9000000416_02948cztM0_level2_common_clean.evt |
| Size (bytes) | 431,838,720 | 39,389,760 |
| Size | 411.8 MB | 37.6 MB |
| Events in quadrant A | 3,333,992 | 212,667 |
| Events in quadrant B | 2,440,961 | 214,673 |
| Events in quadrant C | 2,825,454 | 208,827 |
| Events in quadrant D | 4,132,807 | 200,944 |
| Mode M0 | |||
|---|---|---|---|
| Quadrant | BADHDUFLAG | Total packets | Discarded packets |
| A | 0 | 13380 | 3 |
| B | 0 | 10796 | 2 |
| C | 0 | 11900 | 2 |
| D | 0 | 15816 | 2 |
| Mode SS | |||
|---|---|---|---|
| Quadrant | BADHDUFLAG | Total packets | Discarded packets |
| A | 0 | 106 | 0 |
| B | 0 | 106 | 0 |
| C | 0 | 106 | 0 |
| D | 0 | 106 | 0 |
| Mode M9 | |||
|---|---|---|---|
| Quadrant | BADHDUFLAG | Total packets | Discarded packets |
| A | 0 | 30 | 0 |
| B | 0 | 30 | 0 |
| C | 0 | 30 | 0 |
| D | 0 | 31 | 0 |
| Quadrant | Total seconds | Saturated seconds | Saturation percentage |
|---|---|---|---|
| A | 5118 | 169 | 3.302071% |
| B | 5087 | 22 | 0.432475% |
| C | 5101 | 56 | 1.097824% |
| D | 4997 | 351 | 7.024215% |
Noise dominated data is calculated using 1-second bins in cleaned event files. If a bin has >2000 counts, and if more than 50% of those come from <1% of pixels, then it is considered to be noise-dominated and hence unusable.
| Quadrant | # 1 sec bins | Bins with >0 counts | Bins with >2000 counts | High rate bins dominated by noise | Noise dominated (total time) | Noise dominated (detector-on time) | Marked lightcurve |
|---|---|---|---|---|---|---|---|
| A | 7272 | 5119 | 125 | 125 | 1.72% | 2.44% | 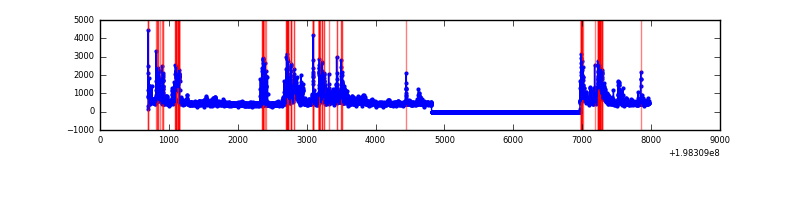 |
| B | 7272 | 5089 | 12 | 12 | 0.17% | 0.24% | 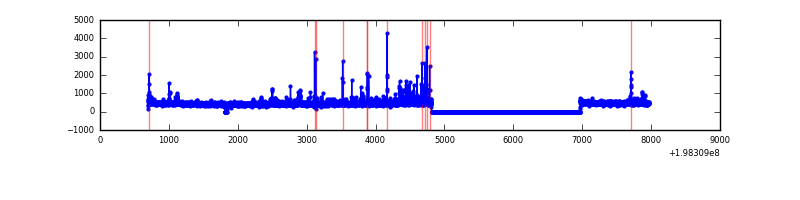 |
| C | 7272 | 5103 | 52 | 52 | 0.72% | 1.02% | 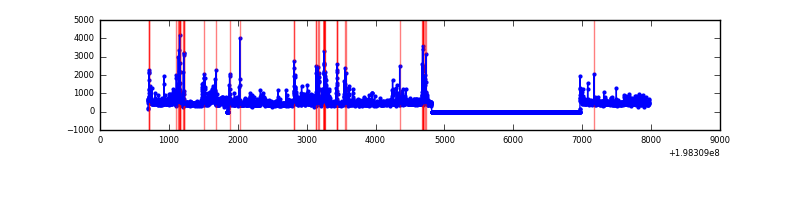 |
| D | 7272 | 5000 | 299 | 299 | 4.11% | 5.98% | 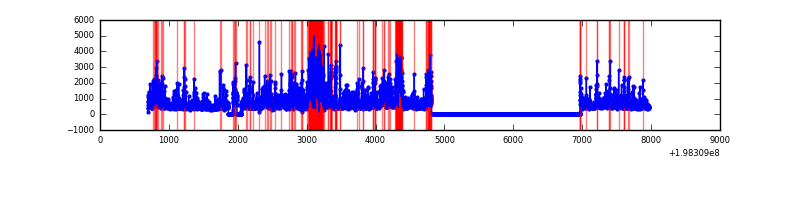 |
Top three noisy pixels from each quadrant. If the there are fewer than three noisy pixels in the level2.evt file, extra rows are filled as -1
| Pixel properties | Quadrant properties | ||||||
|---|---|---|---|---|---|---|---|
| Quadrant | DetID | PixID | Counts | Sigma | Mean | Median | Sigma |
| A | 14 | 238 | 869958 | 7778.35 | 556 | 543 | 111.8 |
| A | 14 | 63 | 113580 | 1011.3 | 556 | 543 | 111.8 |
| A | 0 | 31 | 62117 | 550.88 | 556 | 543 | 111.8 |
| B | 3 | 27 | 113423 | 1016.19 | 567 | 554 | 111.1 |
| B | 0 | 219 | 32243 | 285.31 | 567 | 554 | 111.1 |
| B | 2 | 249 | 31248 | 276.35 | 567 | 554 | 111.1 |
| C | 14 | 223 | 218131 | 1715.32 | 537 | 538 | 126.9 |
| C | 6 | 80 | 120683 | 947.12 | 537 | 538 | 126.9 |
| C | 8 | 162 | 119685 | 939.25 | 537 | 538 | 126.9 |
| D | 7 | 80 | 944225 | 7492.04 | 512 | 499 | 126.0 |
| D | 1 | 31 | 196112 | 1552.93 | 512 | 499 | 126.0 |
| D | 14 | 81 | 169754 | 1343.68 | 512 | 499 | 126.0 |
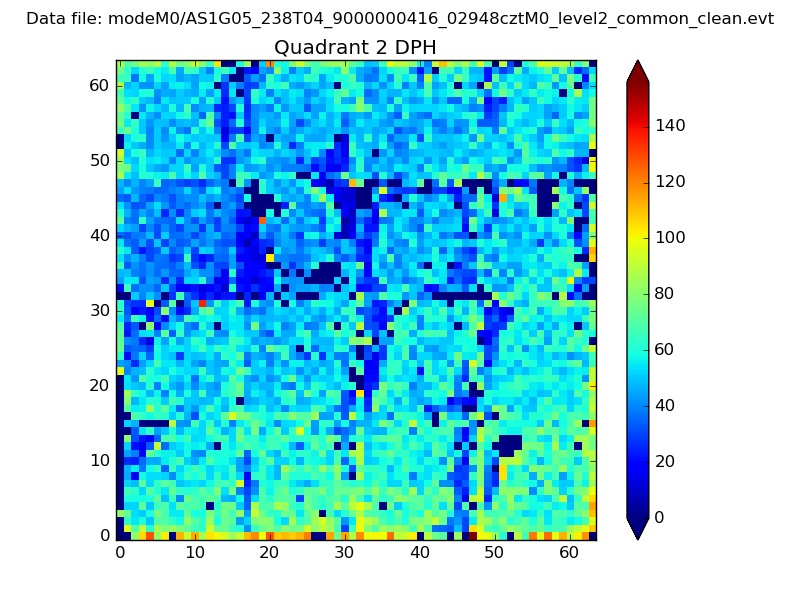
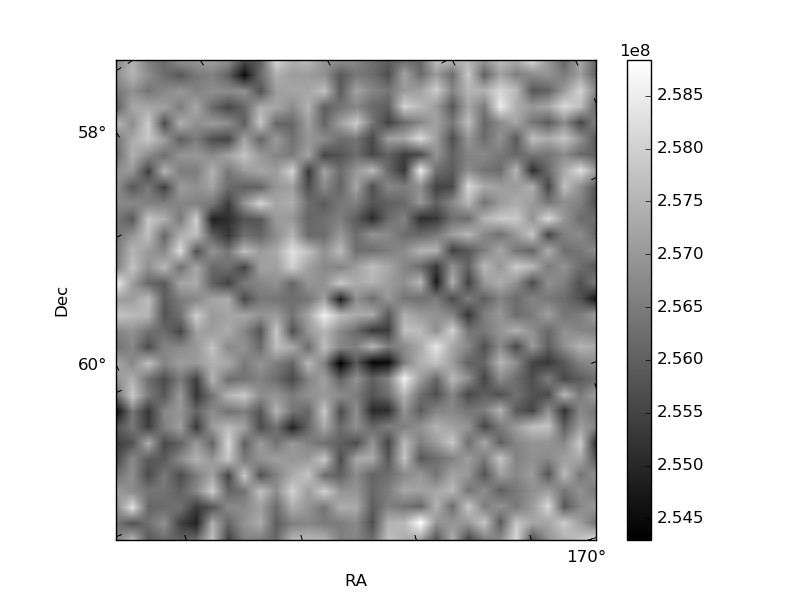
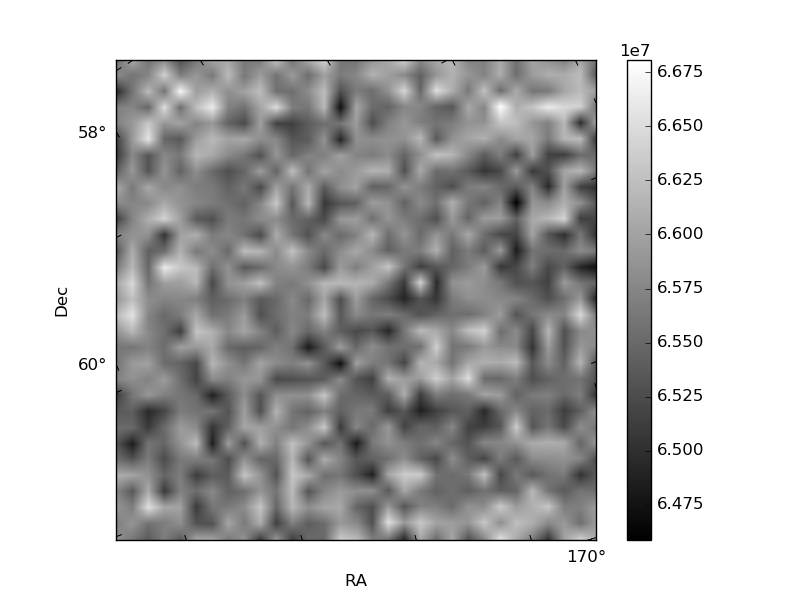
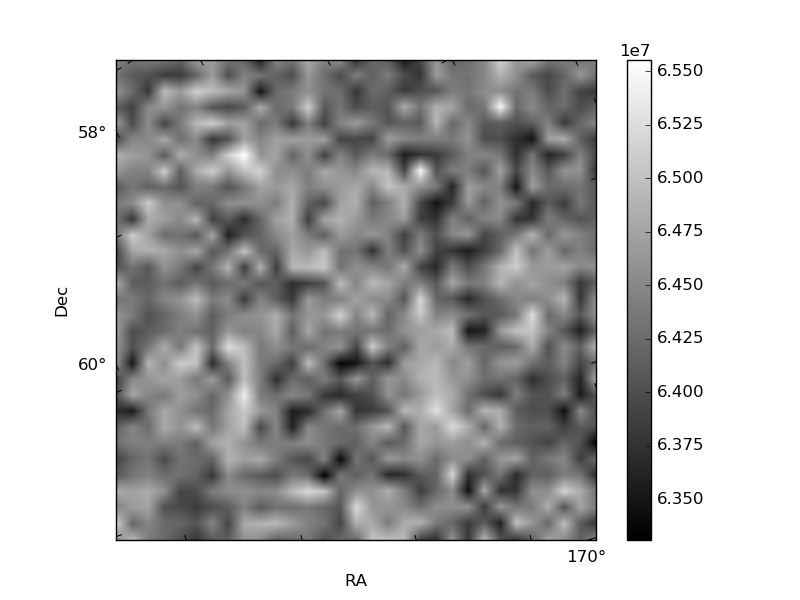
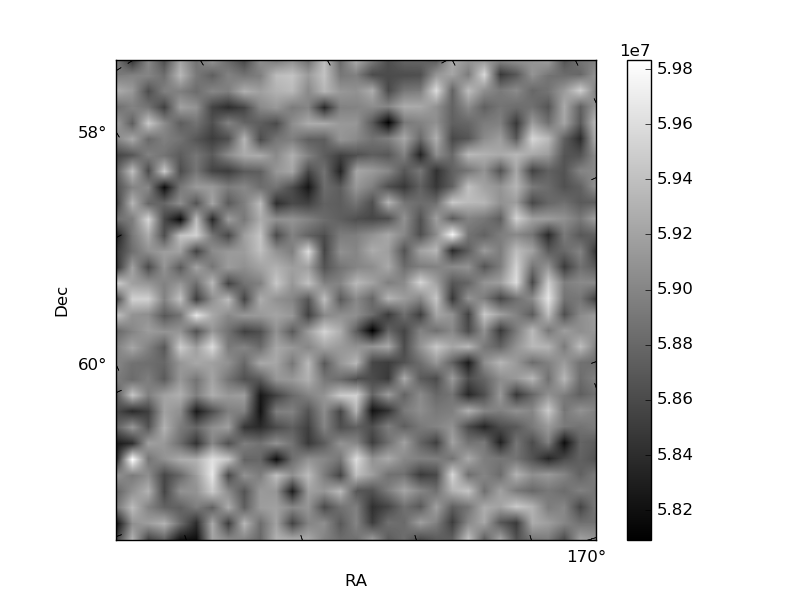
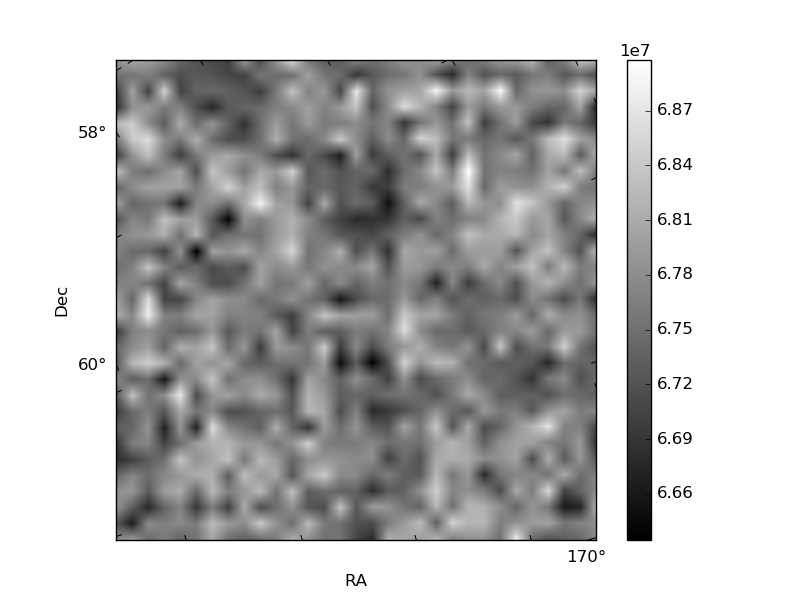
Histogram calculated using DETX and DETY for each event in the final _common_clean file
| Quadrant A | 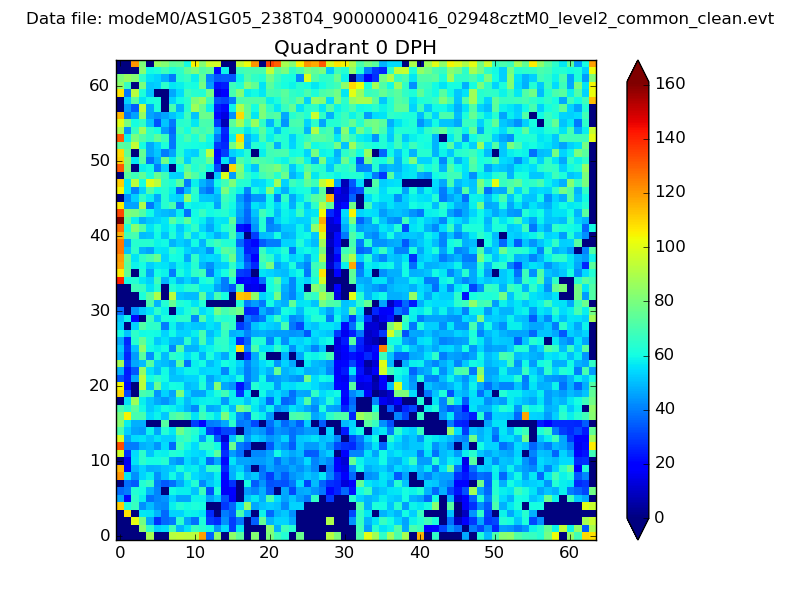 |
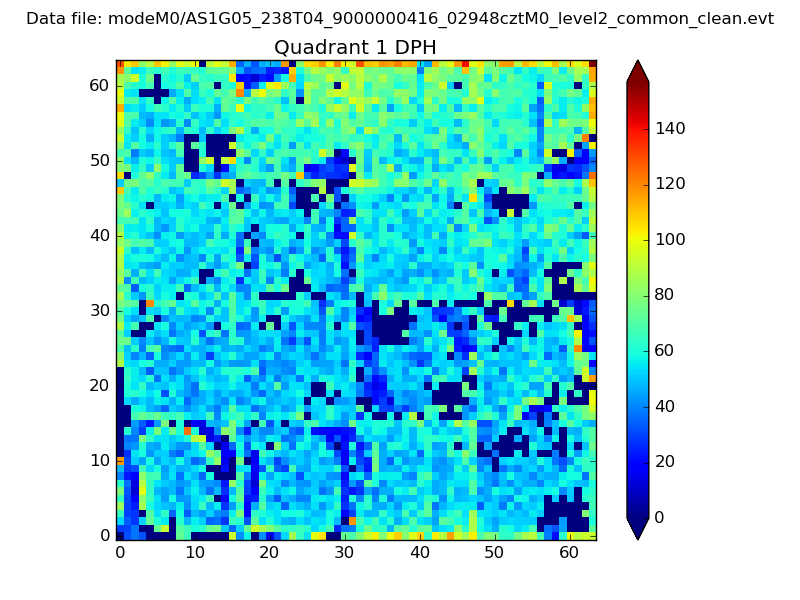 |
Quadrant B |
|---|---|---|---|
| Quadrant D | 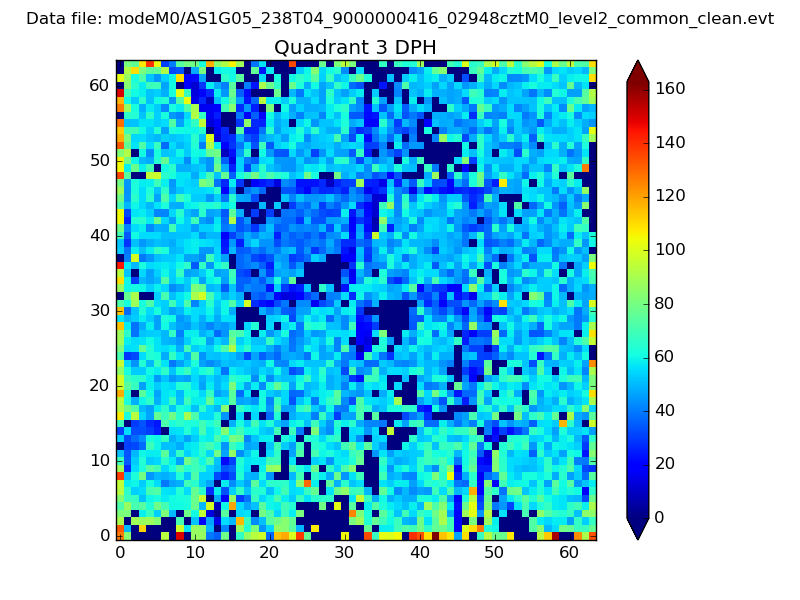 |
 |
Quadrant C |
| Plot type | Count rate plots | Images |
|---|---|---|
| Comparison with Poisson distribution Blue bars denote a histogram of data divided into 1 sec bins. Red curve is a Poisson curve with rate = median count rate of data. |
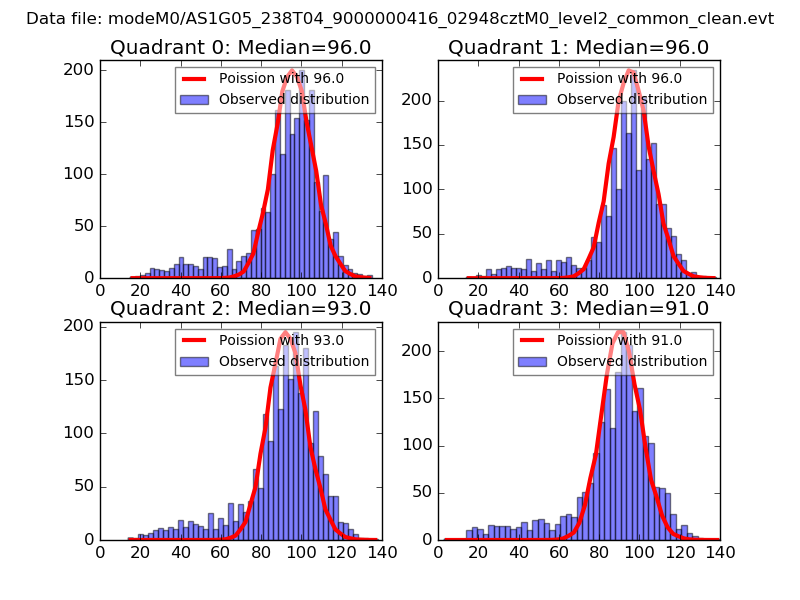 |
 |
| Quadrant-wise count rates Data is divided into 100 sec bins |
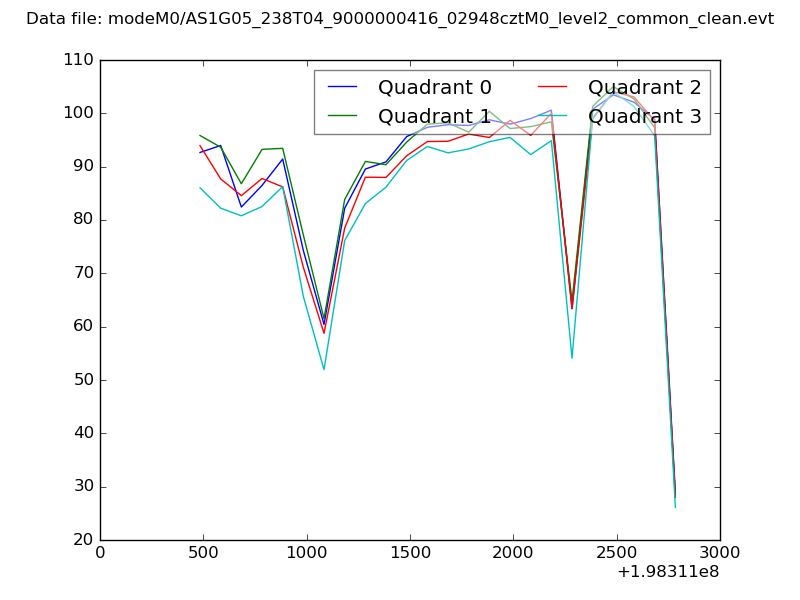 |
|
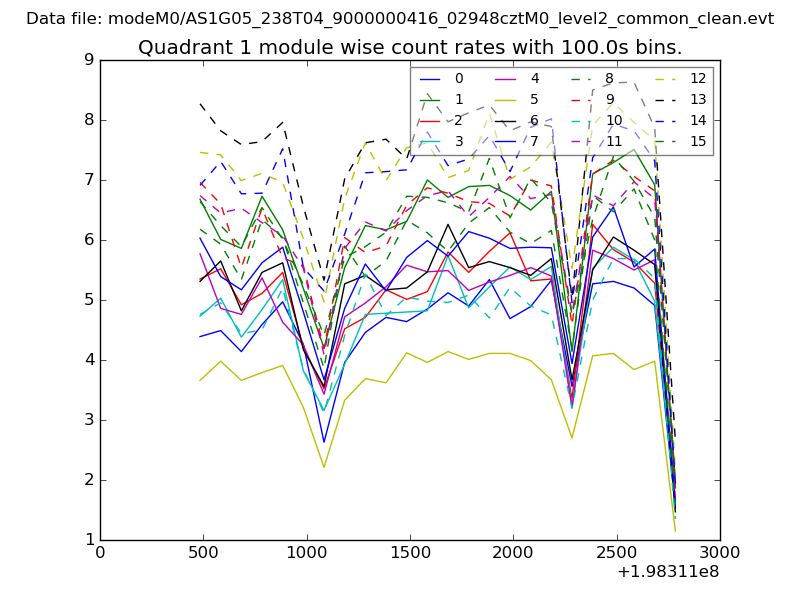
| Module-wise count rates for Quadrant A Data is divided into 100 sec bins |
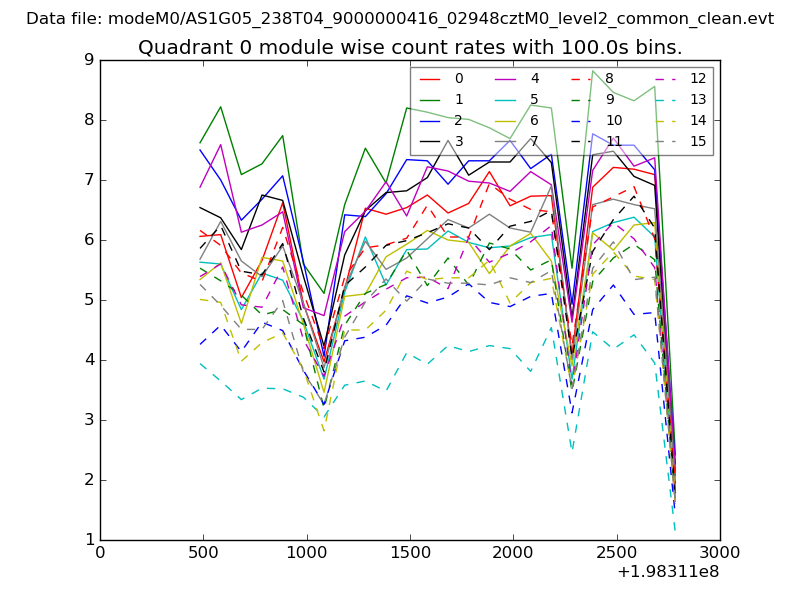 |
 |
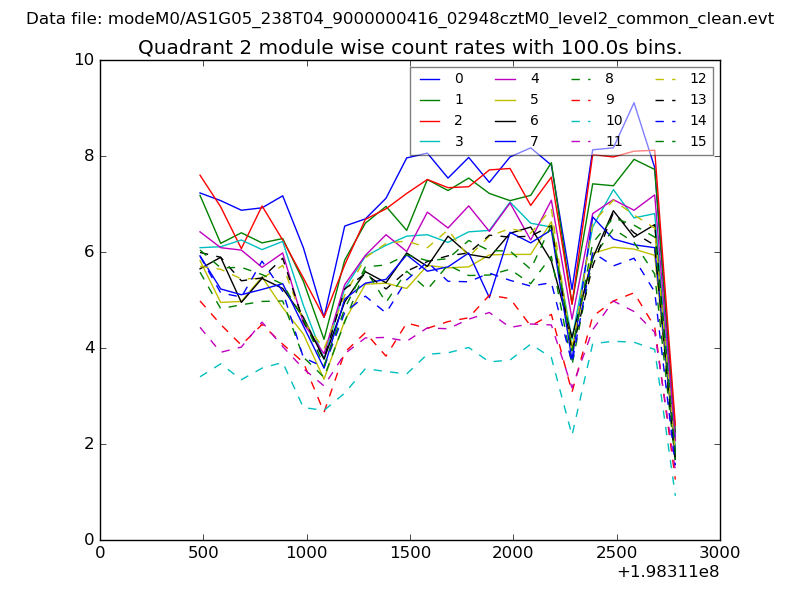
| Module-wise count rates for Quadrant B Data is divided into 100 sec bins |
 |
 |
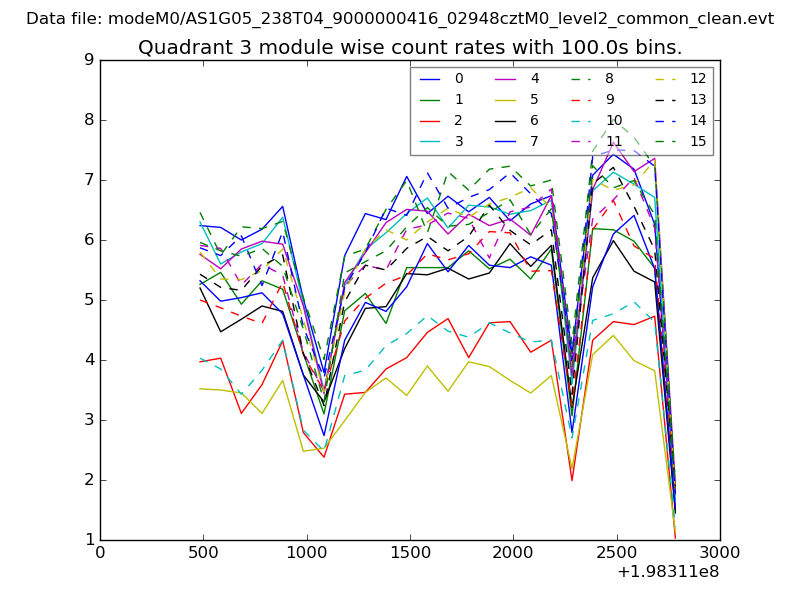
| Module-wise count rates for Quadrant C Data is divided into 100 sec bins |
 |
 |
| Module-wise count rates for Quadrant D Data is divided into 100 sec bins |
 |
 |
| Parameter | Plot |
|---|---|
| CZT HV Monitor | 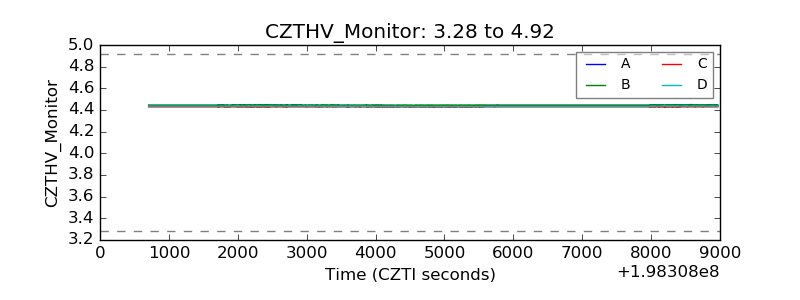 |
| D_VDD | 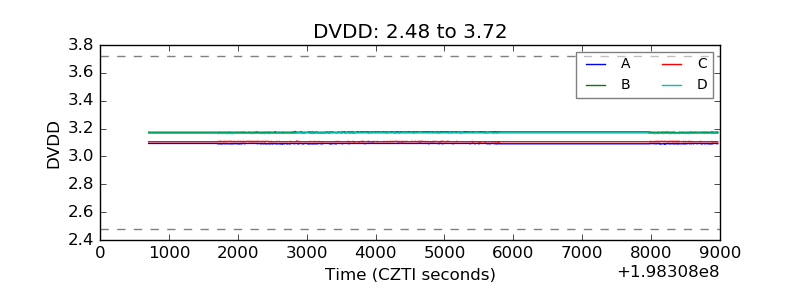 |
| Temperature 1 | 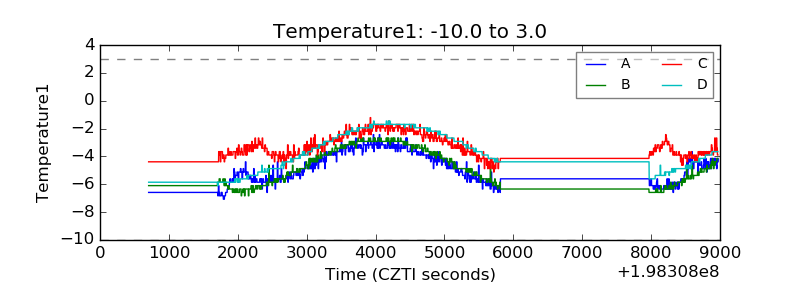 |
| Veto HV Monitor | 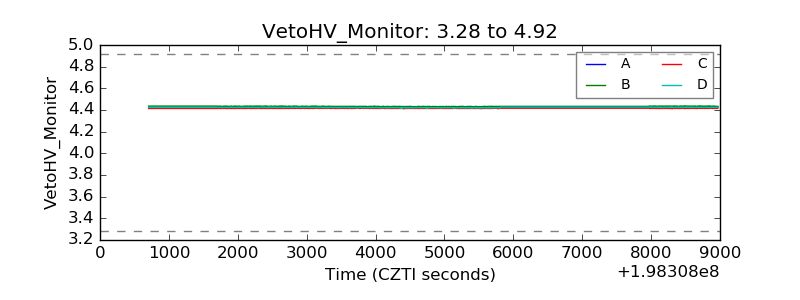 |
| Veto LLD | 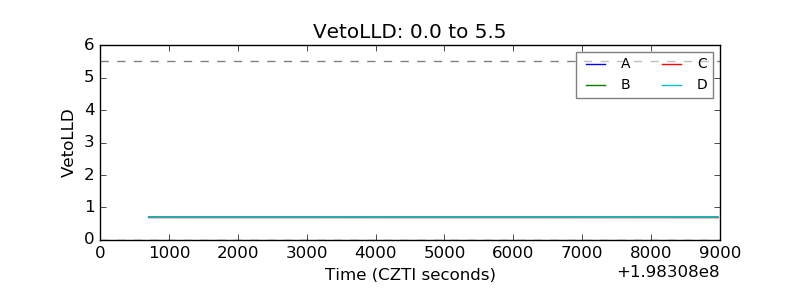 |
| Alpha Counter | 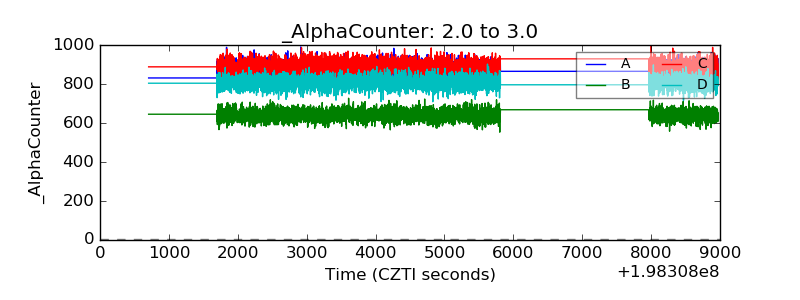 |
| _CPM_Rate | 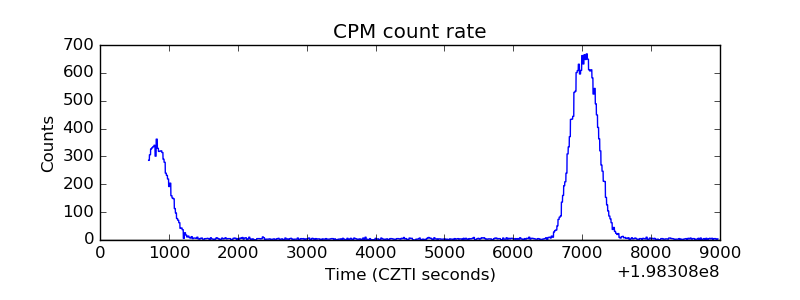 |
| CZT Counter | 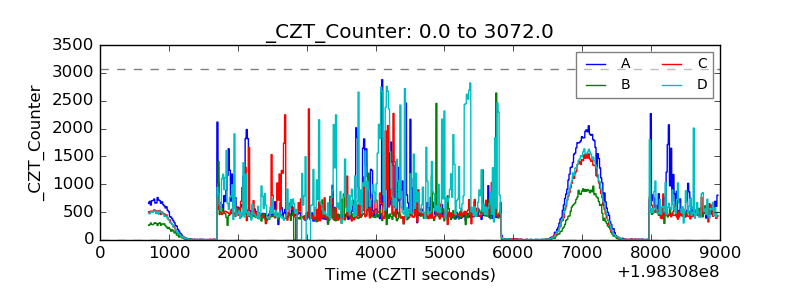 |
| +2.5 Volts monitor | 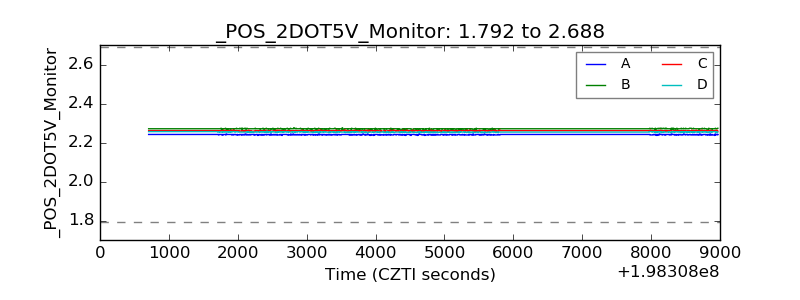 |
| +5 Volts monitor |  |
| Veto Counter | 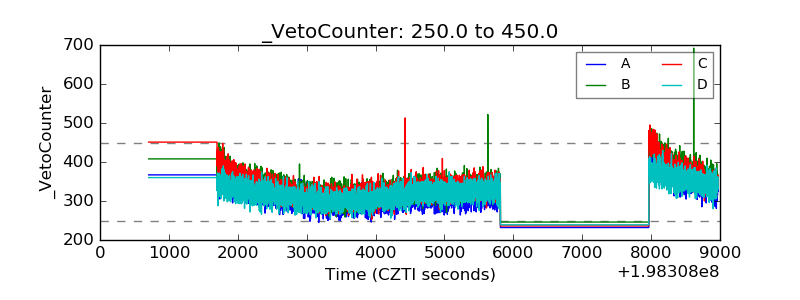 |