| Param | Original file | Final file |
|---|---|---|
| Filename | modeM0/AS1G05_238T04_9000000416_02950cztM0_level2.evt | modeM0/AS1G05_238T04_9000000416_02950cztM0_level2_common_clean.evt |
| Size (bytes) | 461,923,200 | 45,792,000 |
| Size | 440.5 MB | 43.7 MB |
| Events in quadrant A | 2,719,970 | 261,849 |
| Events in quadrant B | 2,913,220 | 259,441 |
| Events in quadrant C | 2,632,947 | 255,841 |
| Events in quadrant D | 5,364,539 | 239,946 |
| Mode M0 | |||
|---|---|---|---|
| Quadrant | BADHDUFLAG | Total packets | Discarded packets |
| A | 0 | 11567 | 3 |
| B | 0 | 12122 | 2 |
| C | 0 | 11455 | 2 |
| D | 0 | 19559 | 2 |
| Mode SS | |||
|---|---|---|---|
| Quadrant | BADHDUFLAG | Total packets | Discarded packets |
| A | 0 | 110 | 0 |
| B | 0 | 110 | 0 |
| C | 0 | 110 | 0 |
| D | 0 | 110 | 0 |
| Mode M9 | |||
|---|---|---|---|
| Quadrant | BADHDUFLAG | Total packets | Discarded packets |
| A | 0 | 43 | 0 |
| B | 0 | 43 | 0 |
| C | 0 | 43 | 0 |
| D | 0 | 43 | 0 |
| Quadrant | Total seconds | Saturated seconds | Saturation percentage |
|---|---|---|---|
| A | 5280 | 50 | 0.946970% |
| B | 5280 | 135 | 2.556818% |
| C | 5280 | 28 | 0.530303% |
| D | 5280 | 833 | 15.776515% |
Noise dominated data is calculated using 1-second bins in cleaned event files. If a bin has >2000 counts, and if more than 50% of those come from <1% of pixels, then it is considered to be noise-dominated and hence unusable.
| Quadrant | # 1 sec bins | Bins with >0 counts | Bins with >2000 counts | High rate bins dominated by noise | Noise dominated (total time) | Noise dominated (detector-on time) | Marked lightcurve |
|---|---|---|---|---|---|---|---|
| A | 9590 | 5282 | 38 | 38 | 0.40% | 0.72% | 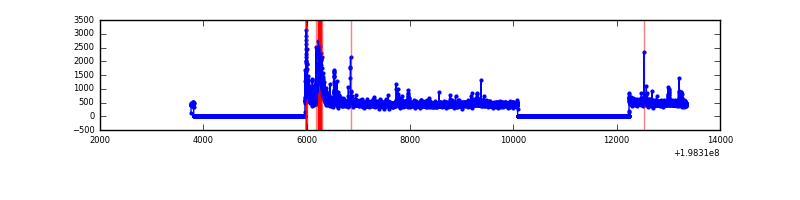 |
| B | 9590 | 5282 | 123 | 123 | 1.28% | 2.33% | 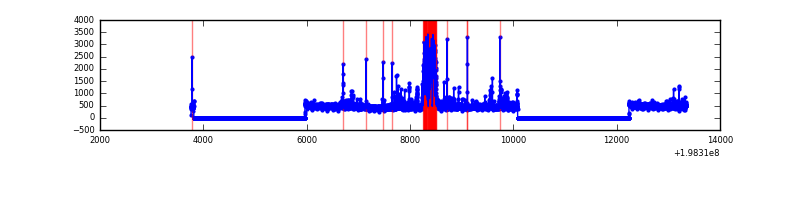 |
| C | 9590 | 5282 | 17 | 17 | 0.18% | 0.32% | 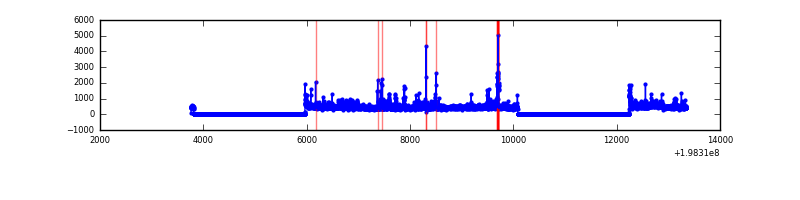 |
| D | 9590 | 5282 | 654 | 654 | 6.82% | 12.38% | 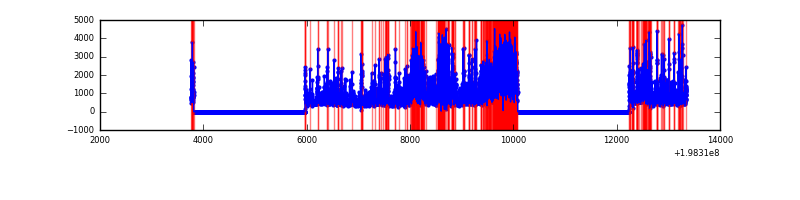 |
Top three noisy pixels from each quadrant. If the there are fewer than three noisy pixels in the level2.evt file, extra rows are filled as -1
| Pixel properties | Quadrant properties | ||||||
|---|---|---|---|---|---|---|---|
| Quadrant | DetID | PixID | Counts | Sigma | Mean | Median | Sigma |
| A | 14 | 238 | 269558 | 2262.7 | 593 | 581 | 118.9 |
| A | 8 | 15 | 72706 | 606.73 | 593 | 581 | 118.9 |
| A | 0 | 31 | 32034 | 264.59 | 593 | 581 | 118.9 |
| B | 2 | 249 | 416933 | 3616.5 | 598 | 585 | 115.1 |
| B | 3 | 27 | 62078 | 534.14 | 598 | 585 | 115.1 |
| B | 0 | 219 | 33527 | 286.14 | 598 | 585 | 115.1 |
| C | 1 | 192 | 141062 | 1057.5 | 569 | 571 | 132.9 |
| C | 6 | 80 | 88375 | 660.91 | 569 | 571 | 132.9 |
| C | 0 | 219 | 54533 | 406.18 | 569 | 571 | 132.9 |
| D | 7 | 80 | 1642919 | 12943.32 | 528 | 516 | 126.9 |
| D | 1 | 31 | 406273 | 3197.66 | 528 | 516 | 126.9 |
| D | 14 | 113 | 330694 | 2602.04 | 528 | 516 | 126.9 |
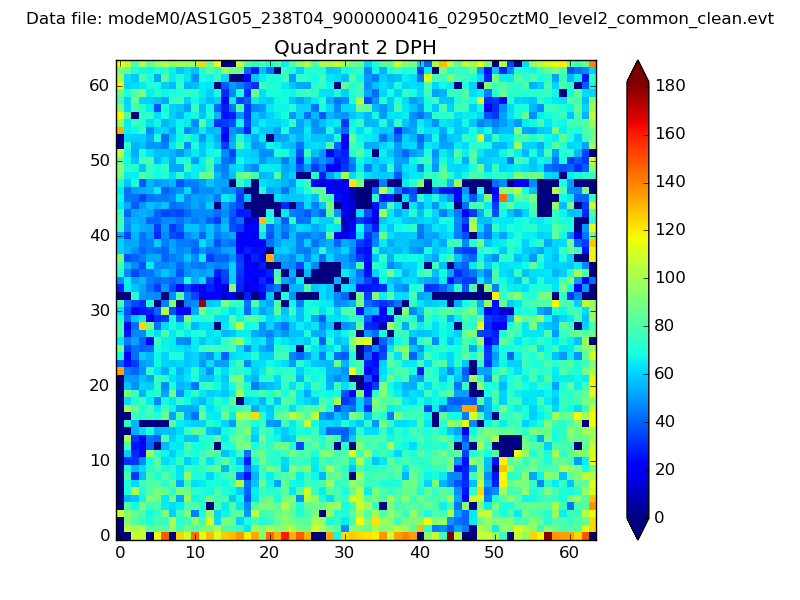
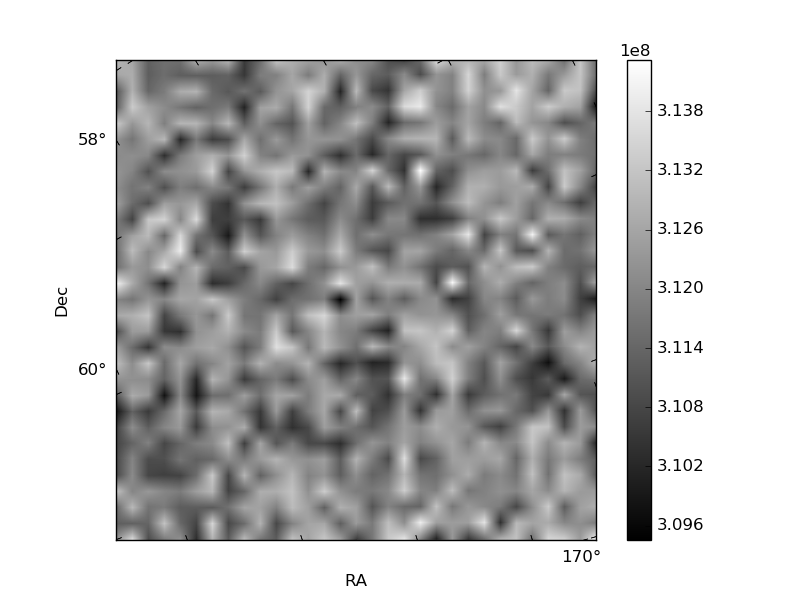
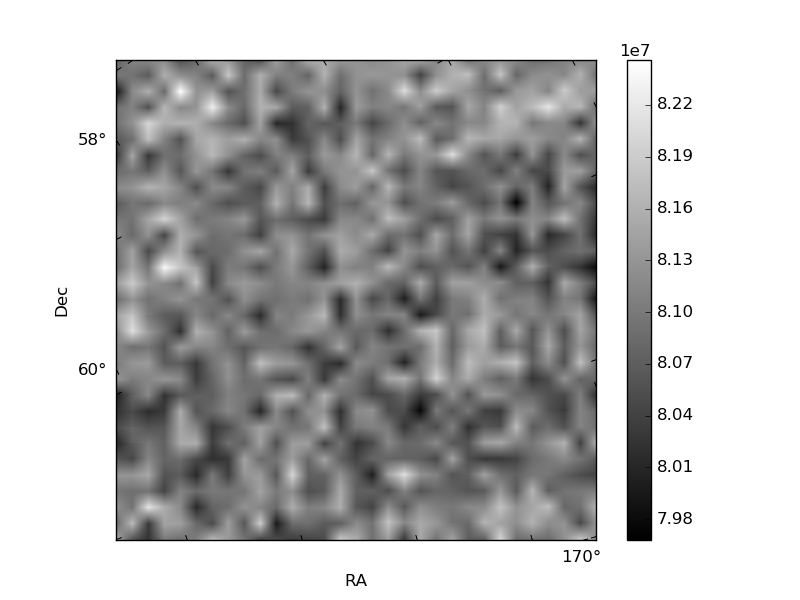
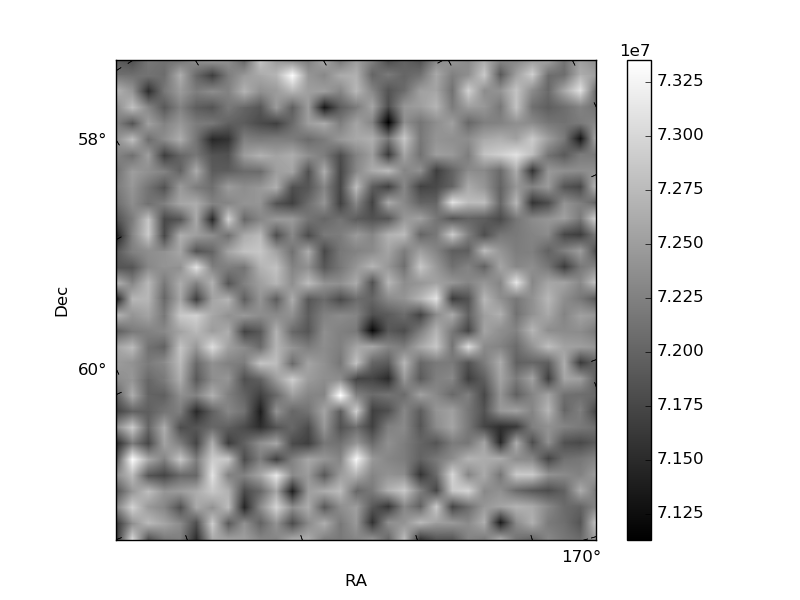
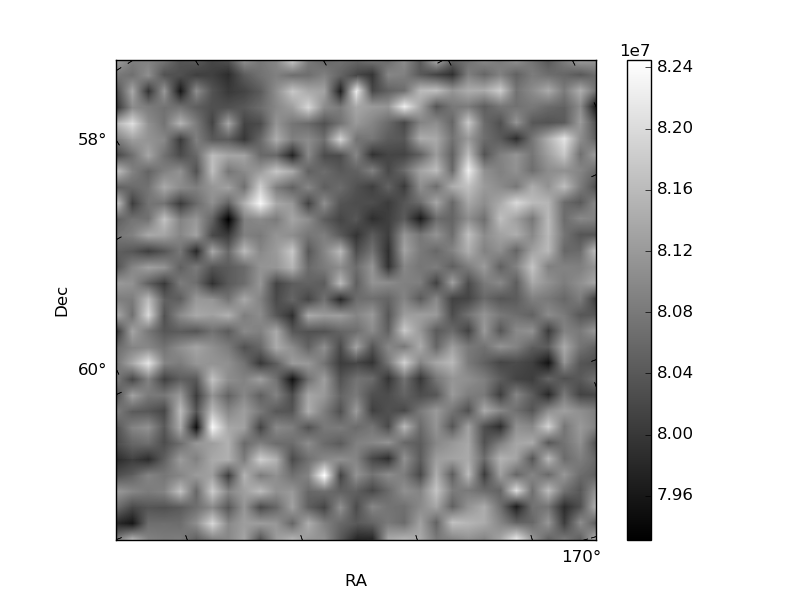
Histogram calculated using DETX and DETY for each event in the final _common_clean file
| Quadrant A | 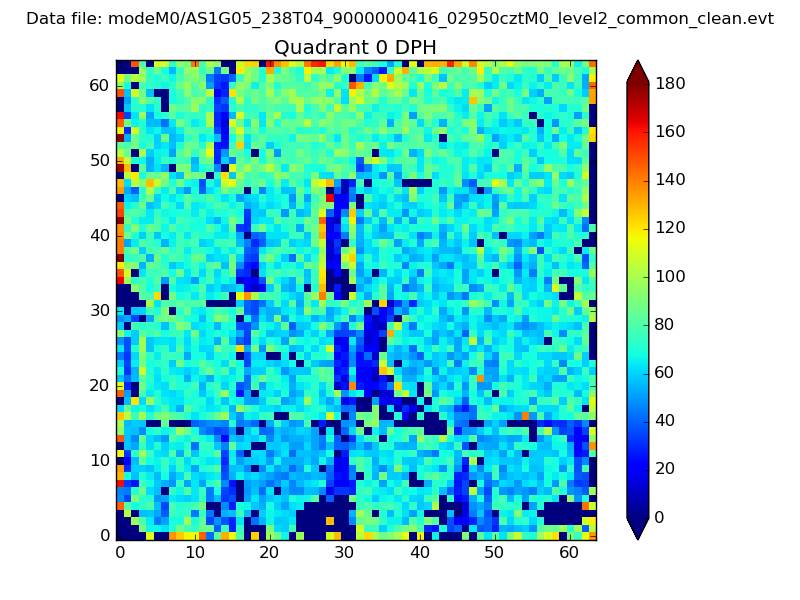 |
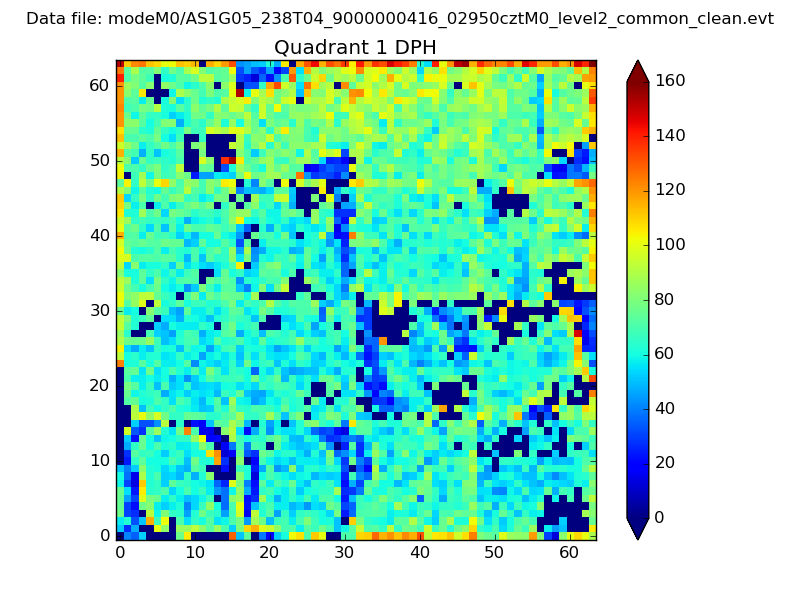 |
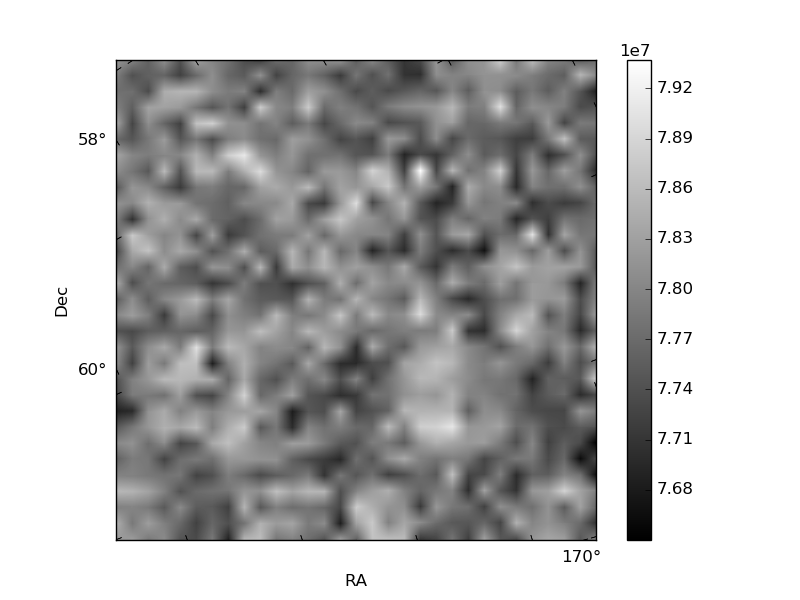
Quadrant B |
|---|---|---|---|
| Quadrant D | 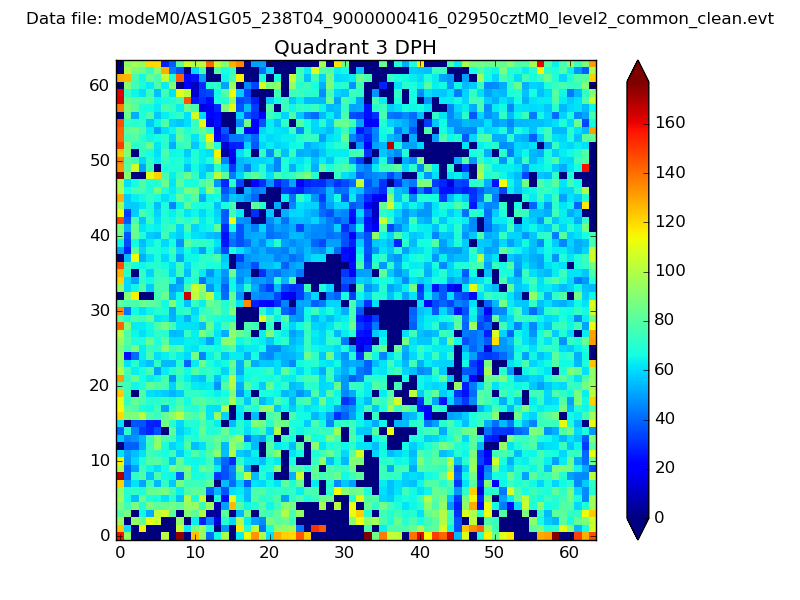 |
 |
Quadrant C |
| Plot type | Count rate plots | Images |
|---|---|---|
| Comparison with Poisson distribution Blue bars denote a histogram of data divided into 1 sec bins. Red curve is a Poisson curve with rate = median count rate of data. |
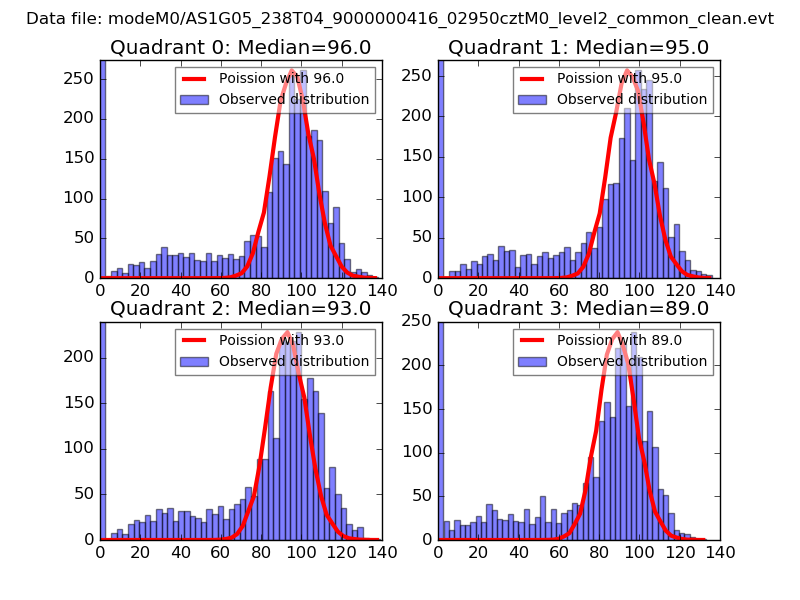 |
 |
| Quadrant-wise count rates Data is divided into 100 sec bins |
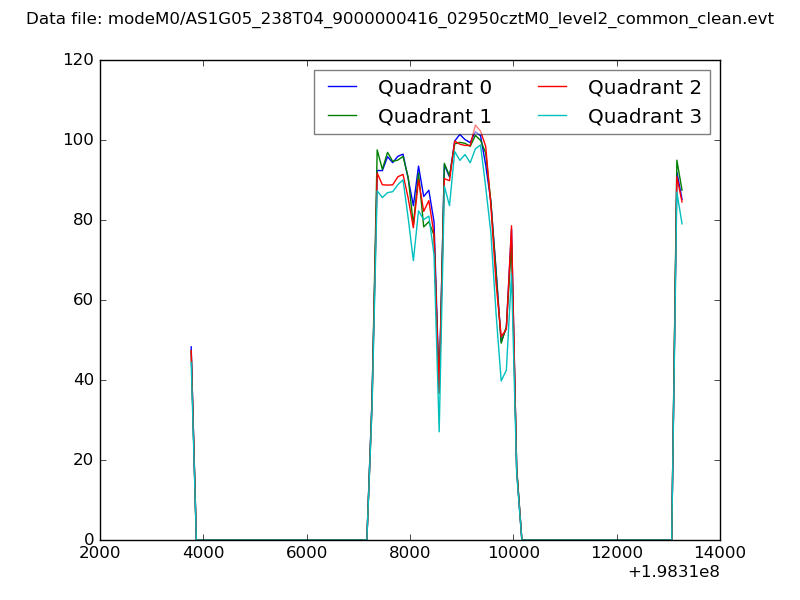 |
|
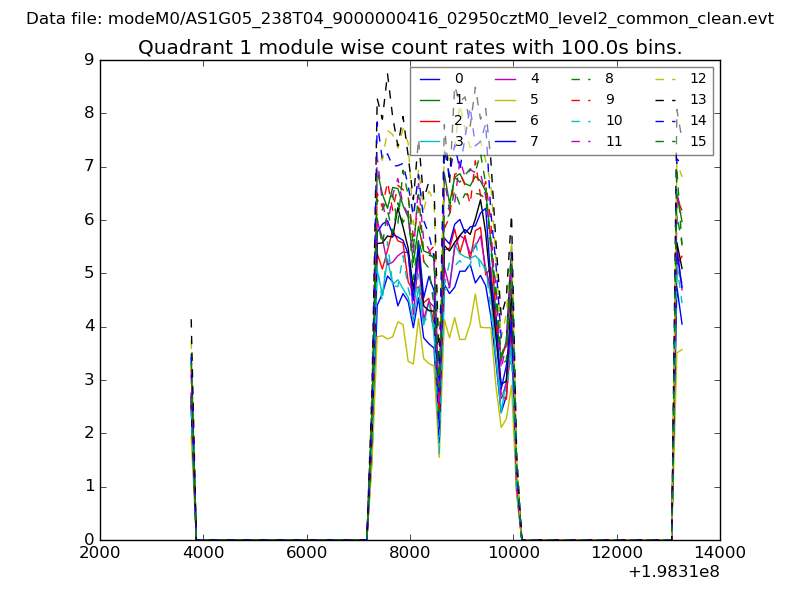
| Module-wise count rates for Quadrant A Data is divided into 100 sec bins |
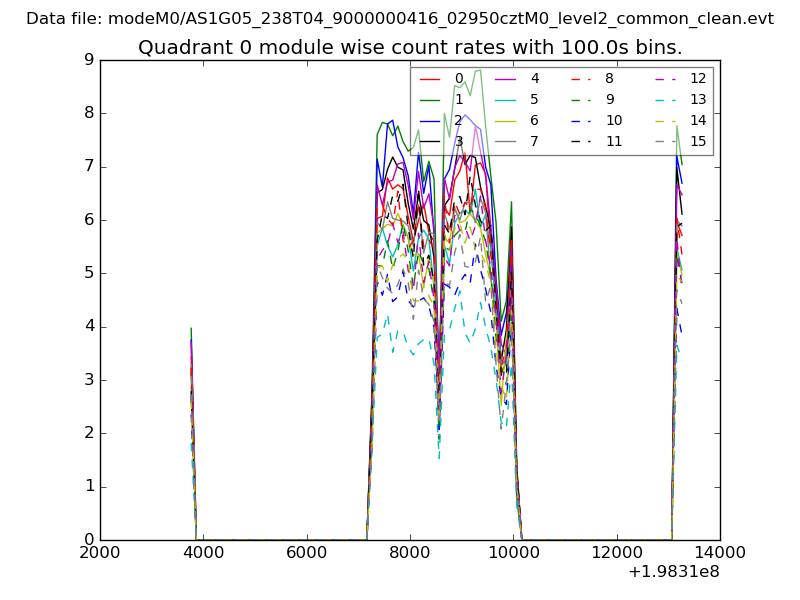 |
 |
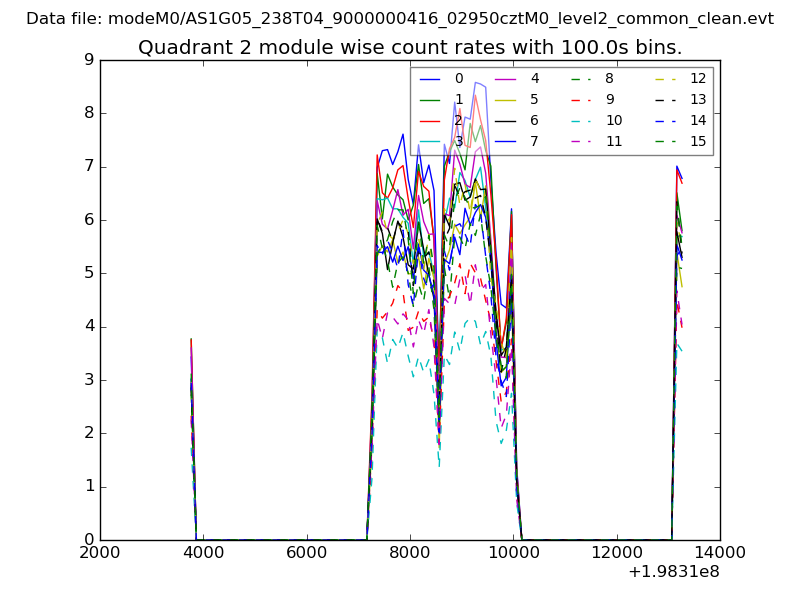
| Module-wise count rates for Quadrant B Data is divided into 100 sec bins |
 |
 |
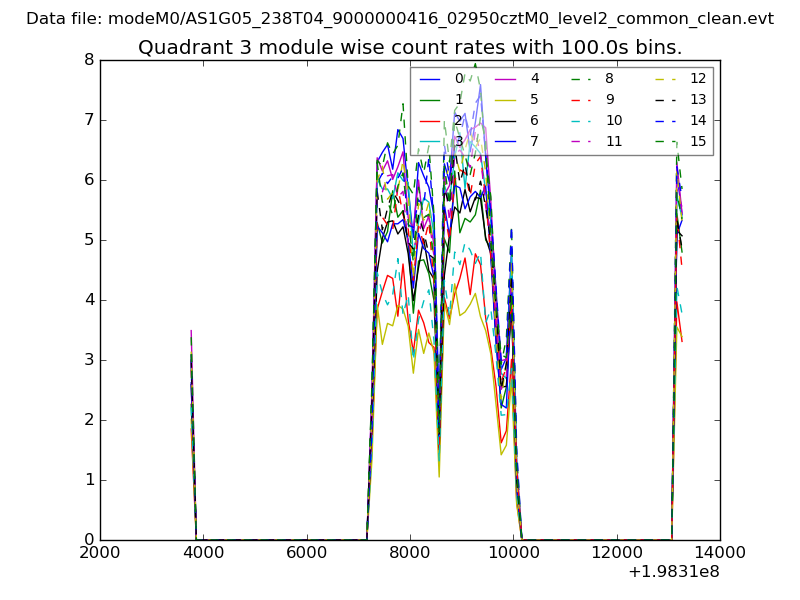
| Module-wise count rates for Quadrant C Data is divided into 100 sec bins |
 |
 |
| Module-wise count rates for Quadrant D Data is divided into 100 sec bins |
 |
 |
| Parameter | Plot |
|---|---|
| CZT HV Monitor | 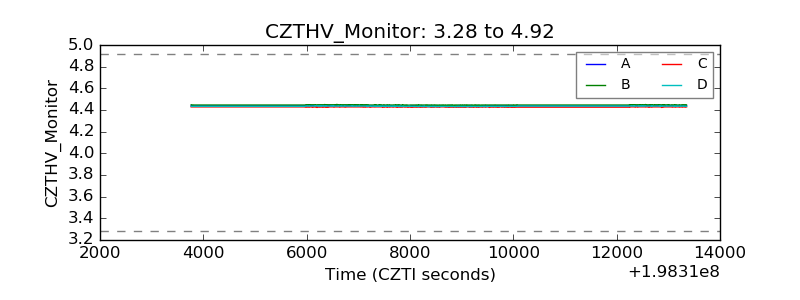 |
| D_VDD | 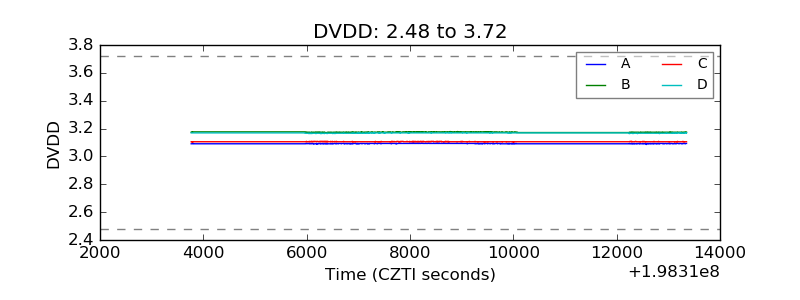 |
| Temperature 1 | 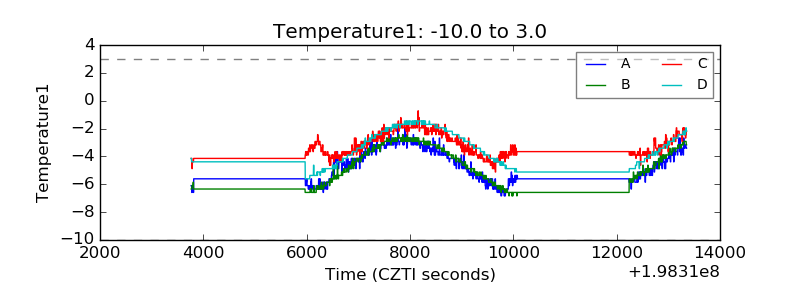 |
| Veto HV Monitor | 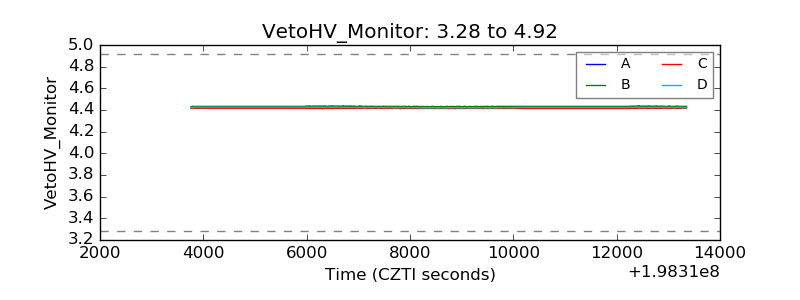 |
| Veto LLD | 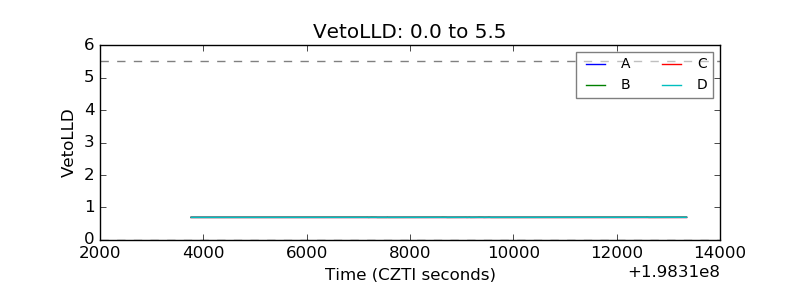 |
| Alpha Counter | 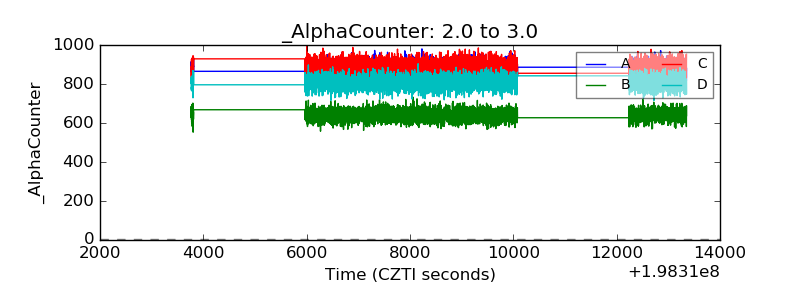 |
| _CPM_Rate | 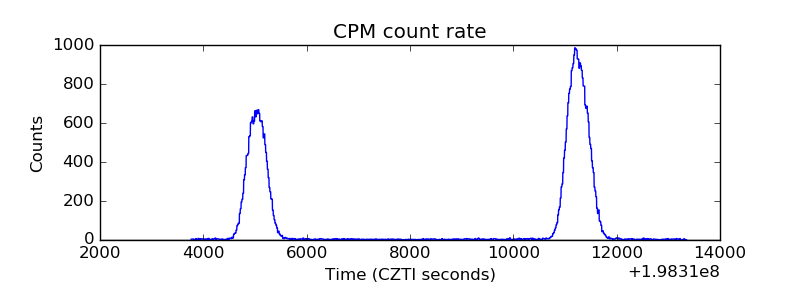 |
| CZT Counter | 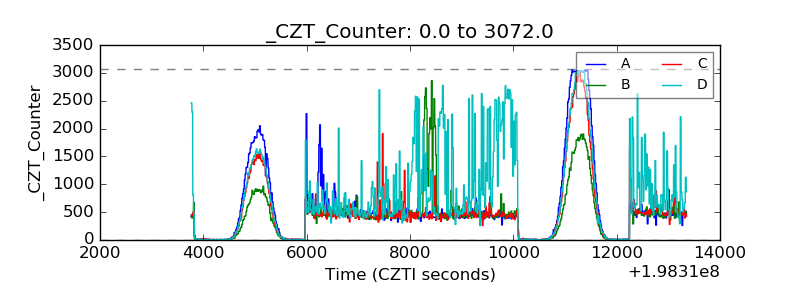 |
| +2.5 Volts monitor | 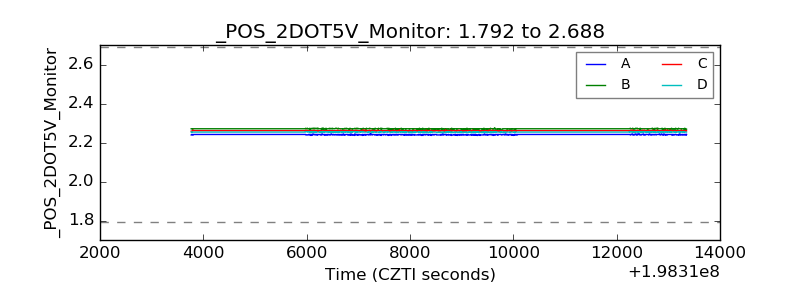 |
| +5 Volts monitor |  |
| Veto Counter | 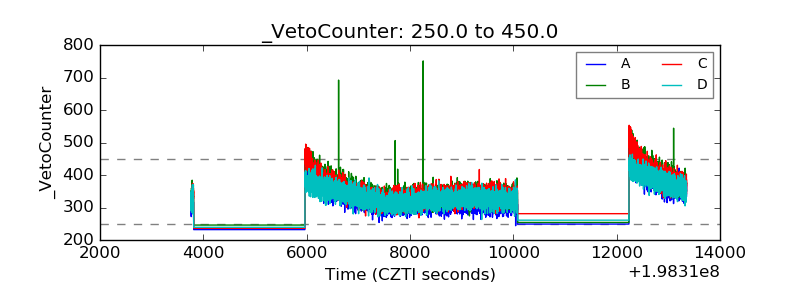 |