| Param | Original file | Final file |
|---|---|---|
| Filename | modeM0/AS1G05_238T04_9000000416_02951cztM0_level2.evt | modeM0/AS1G05_238T04_9000000416_02951cztM0_level2_common_clean.evt |
| Size (bytes) | 472,985,280 | 61,430,400 |
| Size | 451.1 MB | 58.6 MB |
| Events in quadrant A | 2,719,201 | 381,475 |
| Events in quadrant B | 2,790,542 | 381,312 |
| Events in quadrant C | 2,734,154 | 372,801 |
| Events in quadrant D | 5,720,250 | 353,521 |
| Mode M0 | |||
|---|---|---|---|
| Quadrant | BADHDUFLAG | Total packets | Discarded packets |
| A | 0 | 11562 | 3 |
| B | 0 | 11600 | 2 |
| C | 0 | 11703 | 2 |
| D | 0 | 20663 | 2 |
| Mode SS | |||
|---|---|---|---|
| Quadrant | BADHDUFLAG | Total packets | Discarded packets |
| A | 0 | 106 | 0 |
| B | 0 | 106 | 0 |
| C | 0 | 106 | 0 |
| D | 0 | 106 | 0 |
| Mode M9 | |||
|---|---|---|---|
| Quadrant | BADHDUFLAG | Total packets | Discarded packets |
| A | 0 | 31 | 0 |
| B | 0 | 31 | 0 |
| C | 0 | 31 | 0 |
| D | 0 | 32 | 0 |
| Quadrant | Total seconds | Saturated seconds | Saturation percentage |
|---|---|---|---|
| A | 5317 | 77 | 1.448185% |
| B | 5317 | 44 | 0.827534% |
| C | 5317 | 14 | 0.263306% |
| D | 5317 | 798 | 15.008463% |
Noise dominated data is calculated using 1-second bins in cleaned event files. If a bin has >2000 counts, and if more than 50% of those come from <1% of pixels, then it is considered to be noise-dominated and hence unusable.
| Quadrant | # 1 sec bins | Bins with >0 counts | Bins with >2000 counts | High rate bins dominated by noise | Noise dominated (total time) | Noise dominated (detector-on time) | Marked lightcurve |
|---|---|---|---|---|---|---|---|
| A | 7442 | 5318 | 58 | 58 | 0.78% | 1.09% | 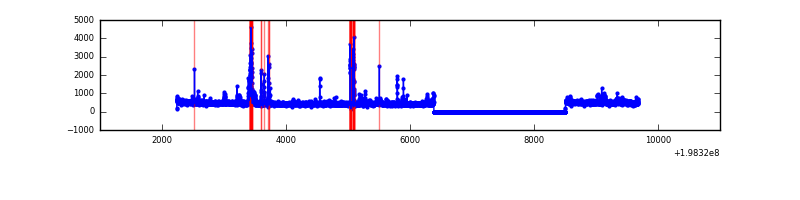 |
| B | 7442 | 5318 | 27 | 27 | 0.36% | 0.51% | 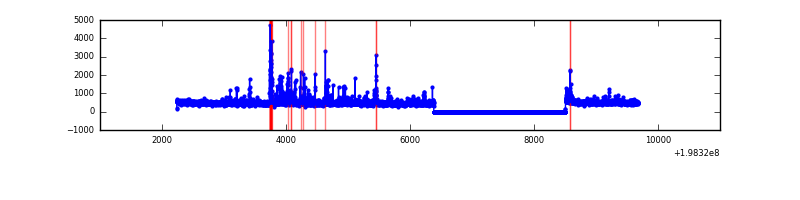 |
| C | 7442 | 5318 | 10 | 10 | 0.13% | 0.19% | 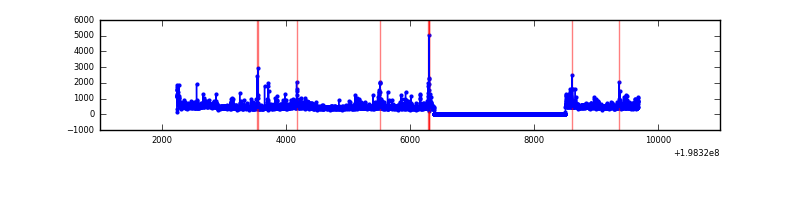 |
| D | 7442 | 5318 | 654 | 654 | 8.79% | 12.30% | 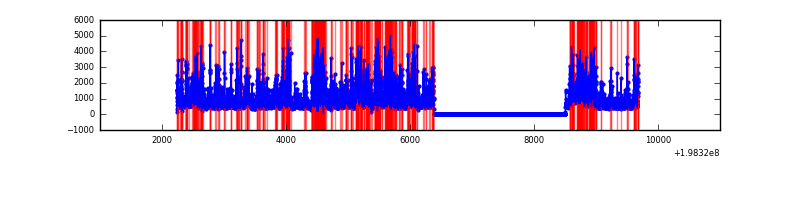 |
Top three noisy pixels from each quadrant. If the there are fewer than three noisy pixels in the level2.evt file, extra rows are filled as -1
| Pixel properties | Quadrant properties | ||||||
|---|---|---|---|---|---|---|---|
| Quadrant | DetID | PixID | Counts | Sigma | Mean | Median | Sigma |
| A | 14 | 238 | 150488 | 1228.9 | 607 | 595 | 122.0 |
| A | 14 | 249 | 98405 | 801.9 | 607 | 595 | 122.0 |
| A | 0 | 50 | 48513 | 392.86 | 607 | 595 | 122.0 |
| B | 2 | 249 | 174376 | 1474.74 | 616 | 604 | 117.8 |
| B | 3 | 27 | 76659 | 645.45 | 616 | 604 | 117.8 |
| B | 0 | 205 | 46202 | 386.97 | 616 | 604 | 117.8 |
| C | 1 | 192 | 153084 | 1118.47 | 586 | 586 | 136.3 |
| C | 6 | 80 | 104884 | 764.95 | 586 | 586 | 136.3 |
| C | 0 | 219 | 84088 | 612.43 | 586 | 586 | 136.3 |
| D | 7 | 80 | 2163407 | 16182.64 | 554 | 540 | 133.7 |
| D | 14 | 113 | 367550 | 2745.98 | 554 | 540 | 133.7 |
| D | 1 | 31 | 324244 | 2421.96 | 554 | 540 | 133.7 |
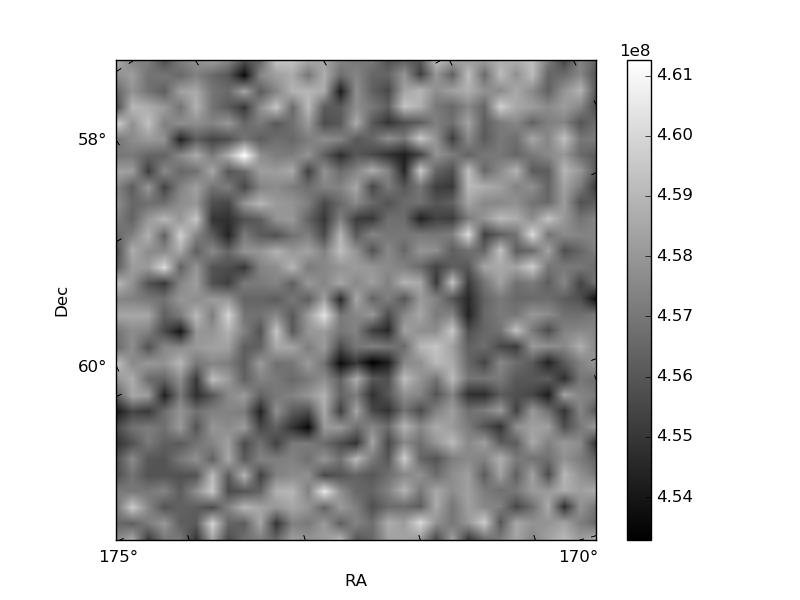
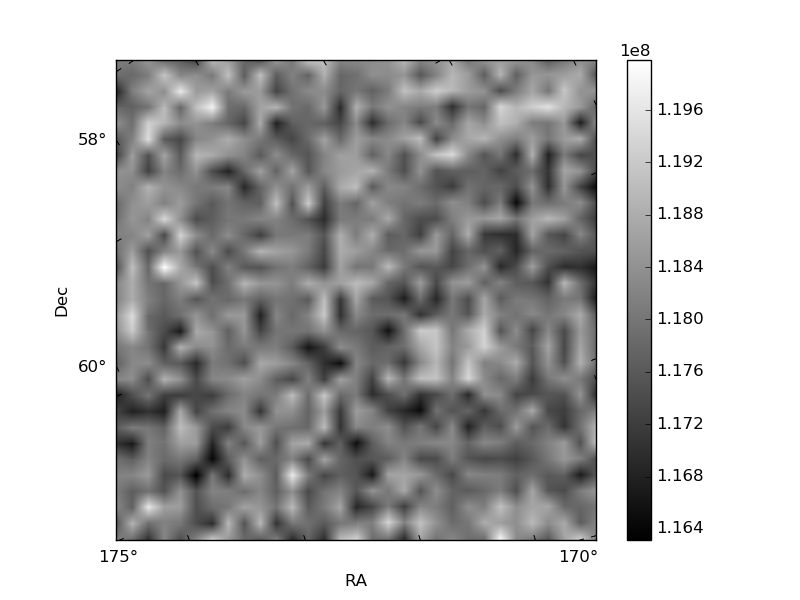
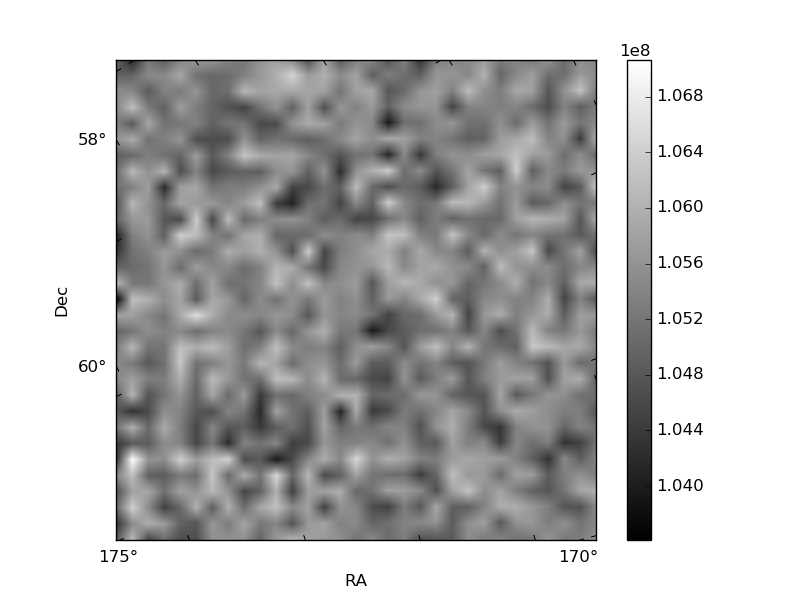
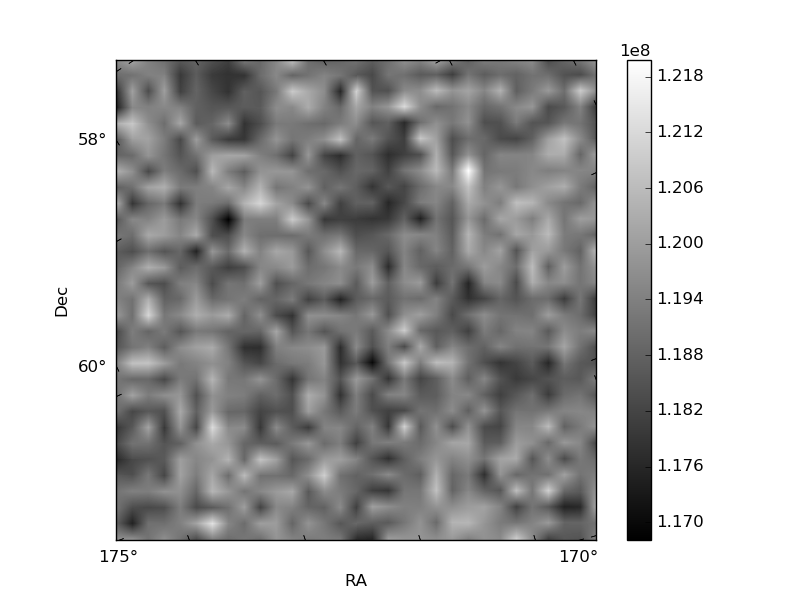
Histogram calculated using DETX and DETY for each event in the final _common_clean file
| Quadrant A | 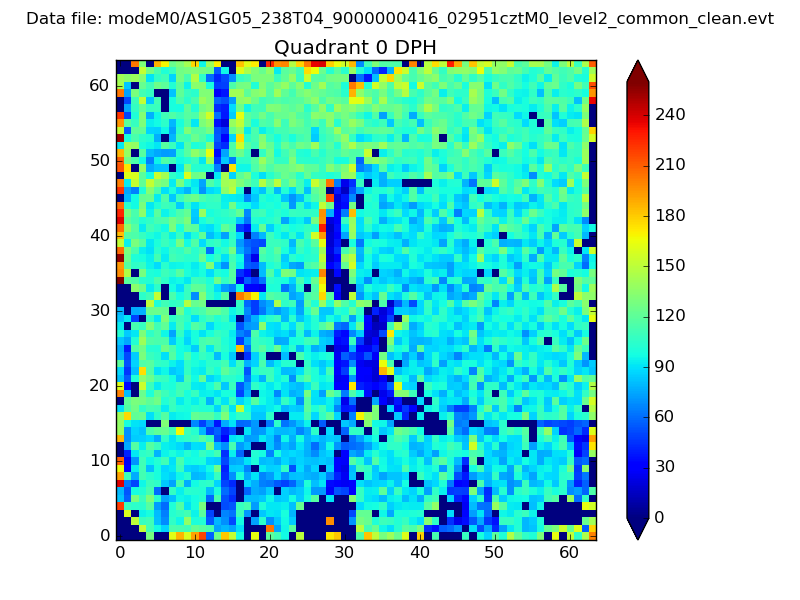 |
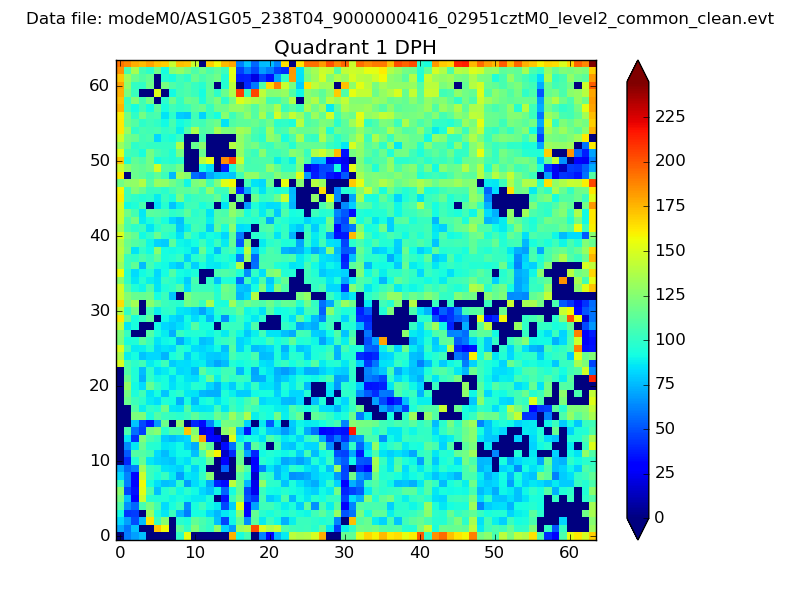 |
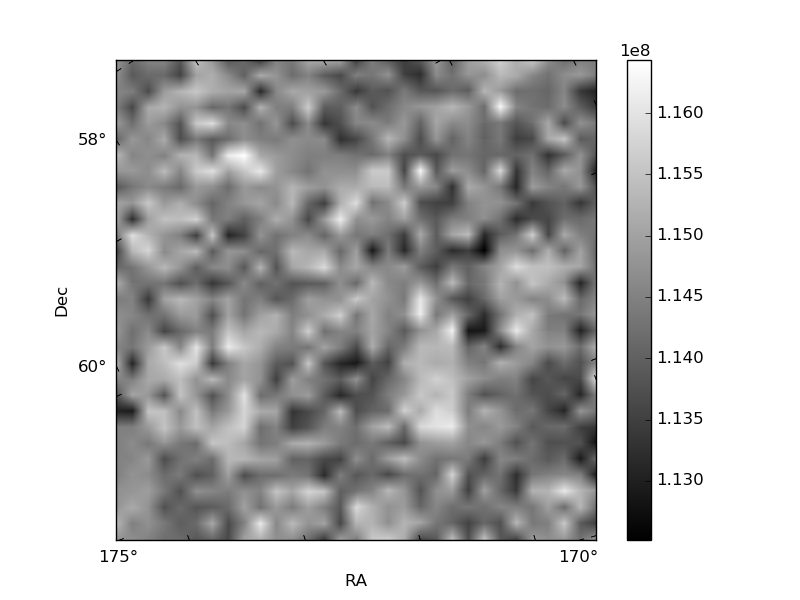
Quadrant B |
|---|---|---|---|
| Quadrant D | 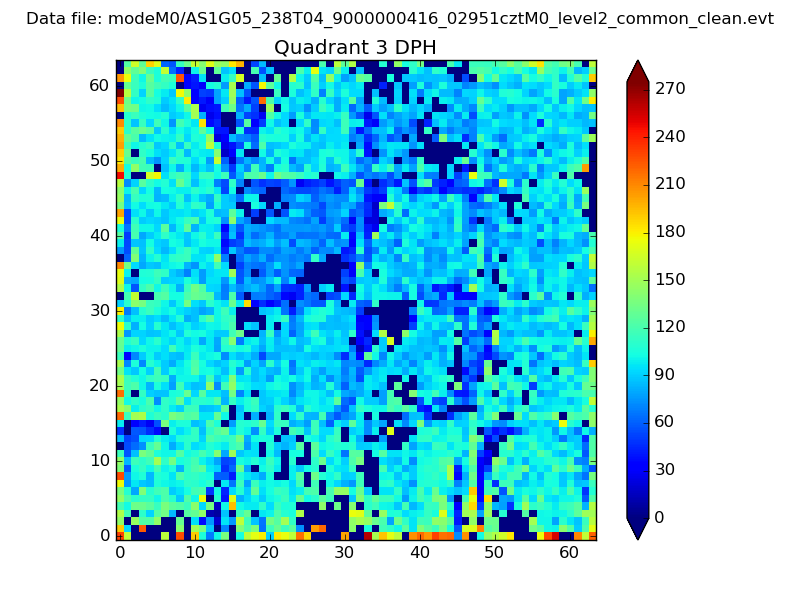 |
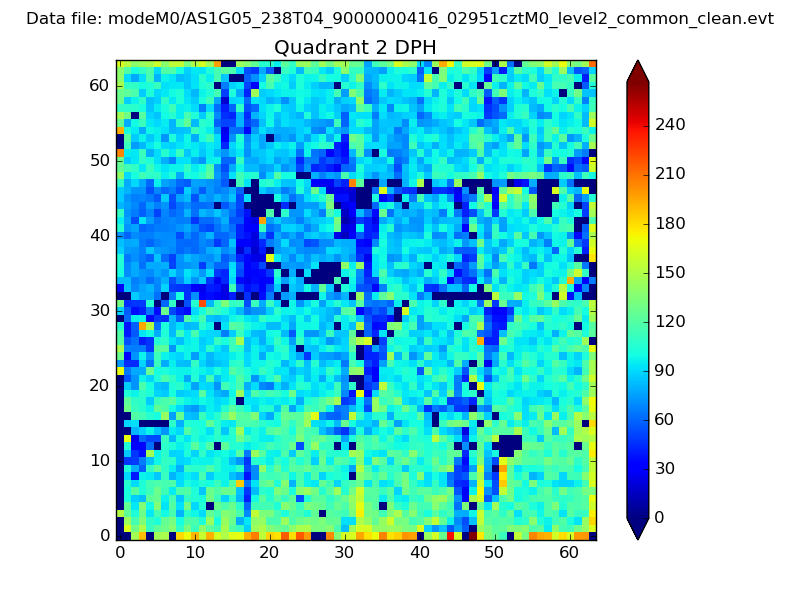 |
Quadrant C |
| Plot type | Count rate plots | Images |
|---|---|---|
| Comparison with Poisson distribution Blue bars denote a histogram of data divided into 1 sec bins. Red curve is a Poisson curve with rate = median count rate of data. |
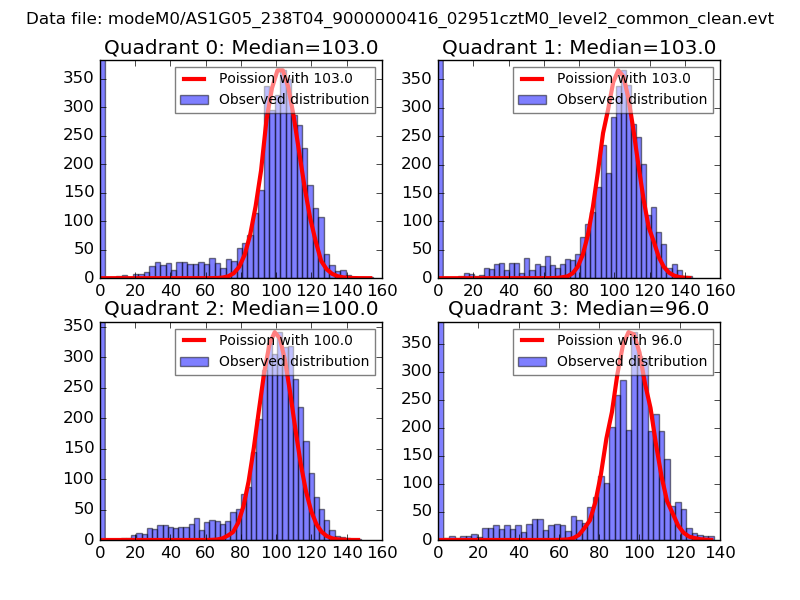 |
 |
| Quadrant-wise count rates Data is divided into 100 sec bins |
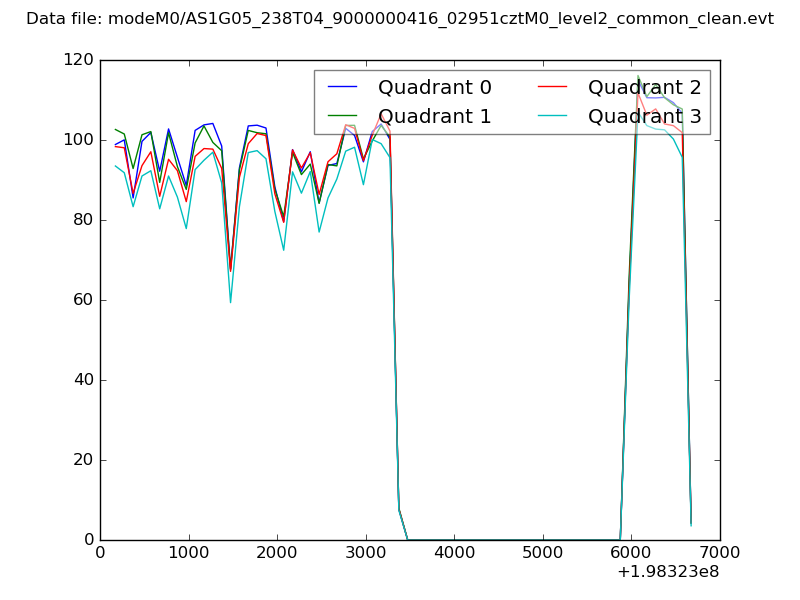 |
|
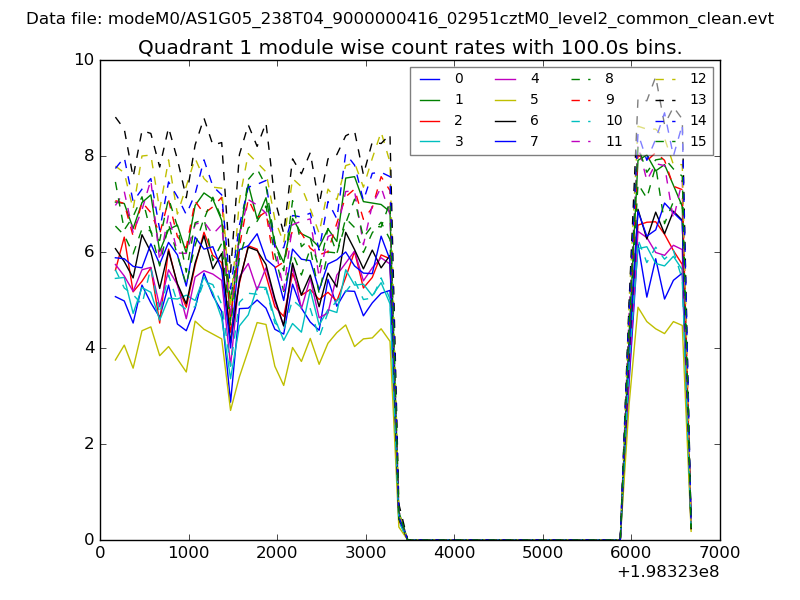
| Module-wise count rates for Quadrant A Data is divided into 100 sec bins |
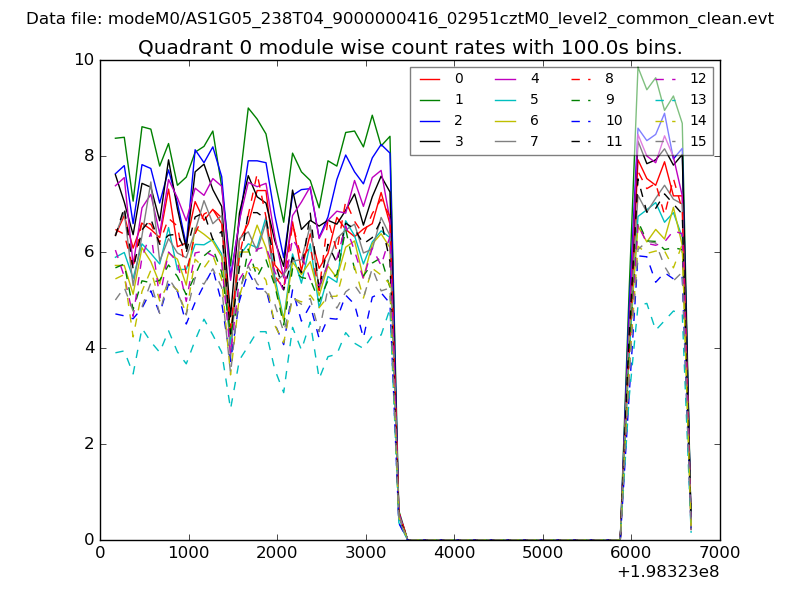 |
 |
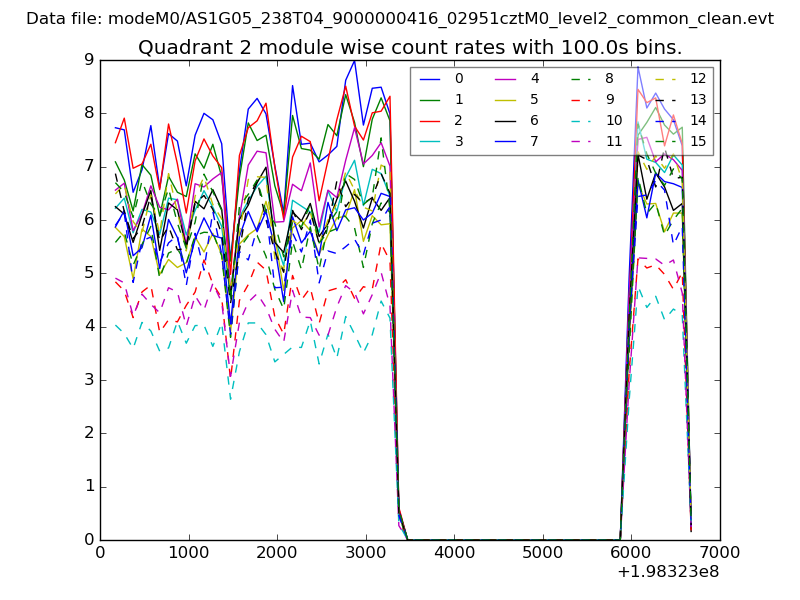
| Module-wise count rates for Quadrant B Data is divided into 100 sec bins |
 |
 |
| Module-wise count rates for Quadrant C Data is divided into 100 sec bins |
 |
 |
| Module-wise count rates for Quadrant D Data is divided into 100 sec bins |
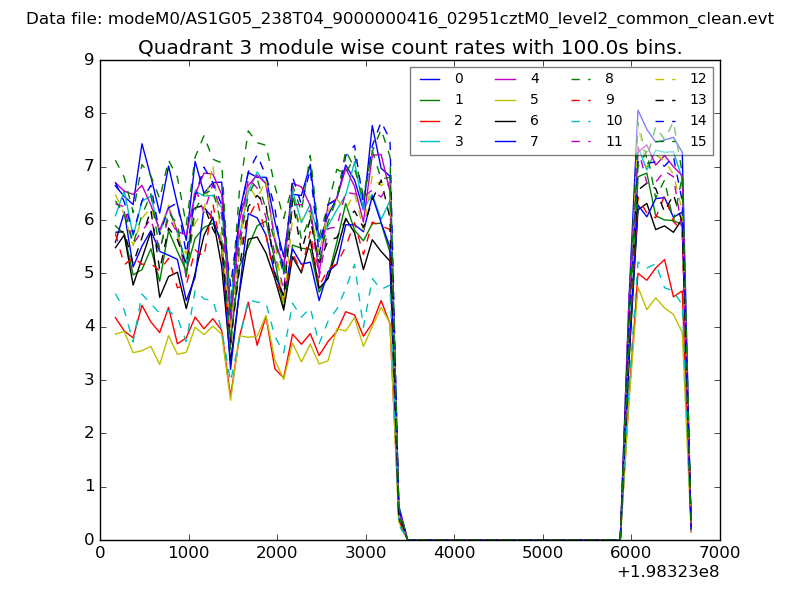 |
 |
| Parameter | Plot |
|---|---|
| CZT HV Monitor | 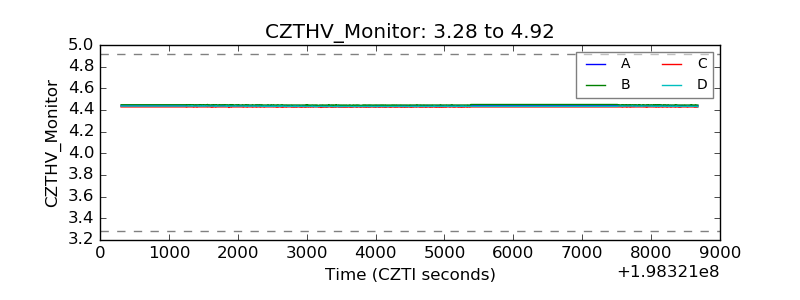 |
| D_VDD | 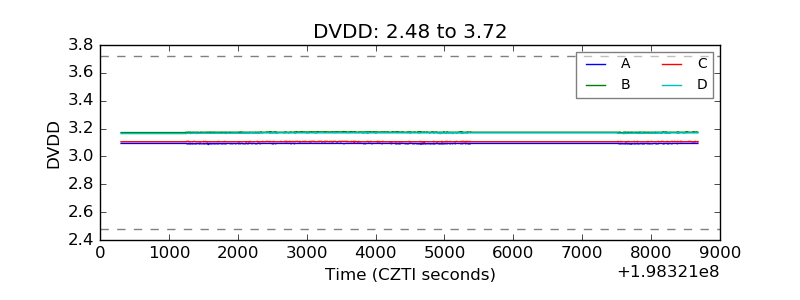 |
| Temperature 1 |  |
| Veto HV Monitor | 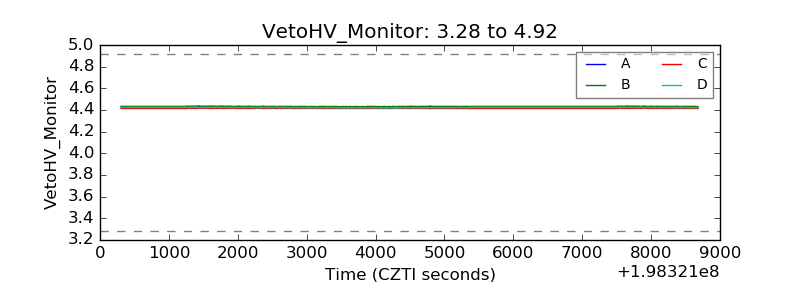 |
| Veto LLD |  |
| Alpha Counter | 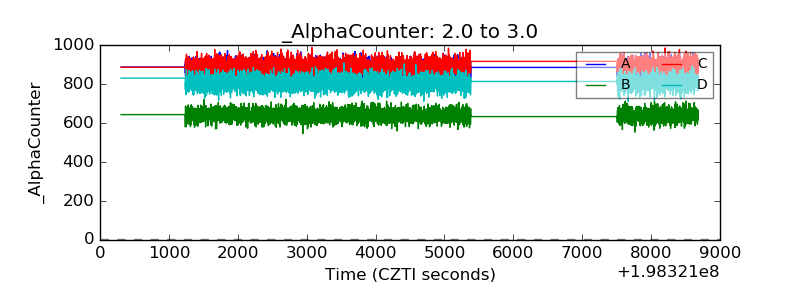 |
| _CPM_Rate | 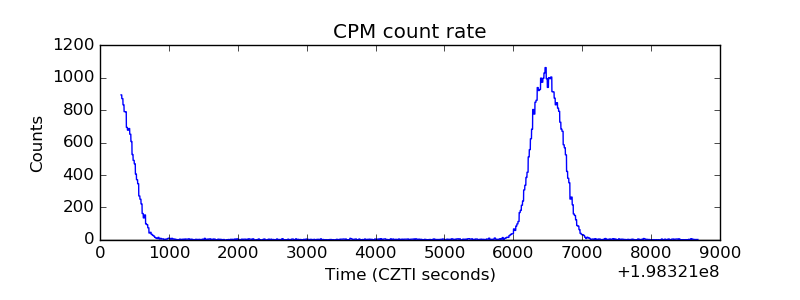 |
| CZT Counter | 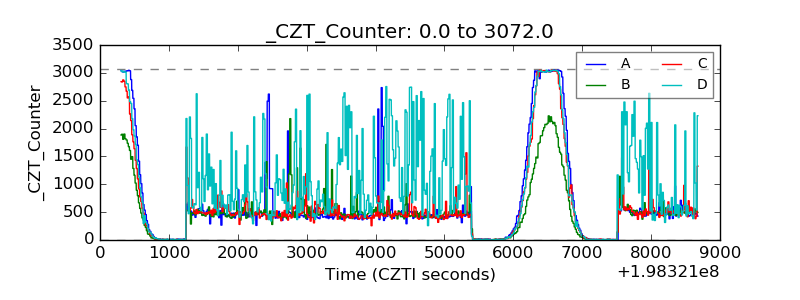 |
| +2.5 Volts monitor |  |
| +5 Volts monitor | 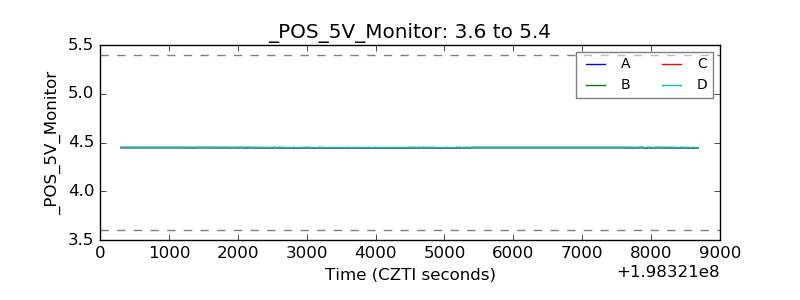 |
| Veto Counter | 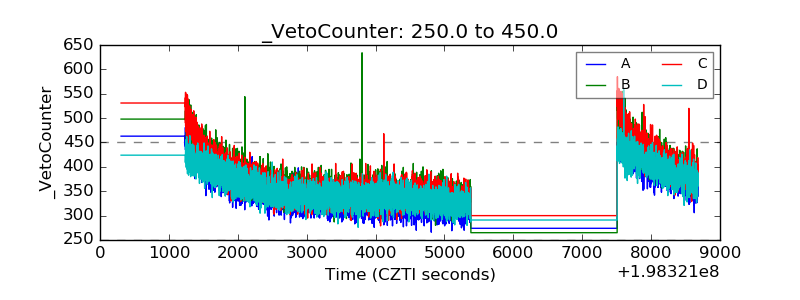 |