| Param | Original file | Final file |
|---|---|---|
| Filename | modeM0/AS1G05_238T04_9000000416_02952cztM0_level2.evt | modeM0/AS1G05_238T04_9000000416_02952cztM0_level2_common_clean.evt |
| Size (bytes) | 472,533,120 | 73,728,000 |
| Size | 450.6 MB | 70.3 MB |
| Events in quadrant A | 2,654,915 | 475,149 |
| Events in quadrant B | 2,924,171 | 476,529 |
| Events in quadrant C | 2,885,407 | 466,345 |
| Events in quadrant D | 5,487,263 | 444,948 |
| Mode M0 | |||
|---|---|---|---|
| Quadrant | BADHDUFLAG | Total packets | Discarded packets |
| A | 0 | 11337 | 3 |
| B | 0 | 11929 | 2 |
| C | 0 | 12006 | 2 |
| D | 0 | 19826 | 2 |
| Mode SS | |||
|---|---|---|---|
| Quadrant | BADHDUFLAG | Total packets | Discarded packets |
| A | 0 | 108 | 0 |
| B | 0 | 108 | 0 |
| C | 0 | 108 | 0 |
| D | 0 | 108 | 0 |
| Mode M9 | |||
|---|---|---|---|
| Quadrant | BADHDUFLAG | Total packets | Discarded packets |
| A | 0 | 36 | 0 |
| B | 0 | 36 | 0 |
| C | 0 | 36 | 0 |
| D | 0 | 37 | 0 |
| Quadrant | Total seconds | Saturated seconds | Saturation percentage |
|---|---|---|---|
| A | 5290 | 23 | 0.434783% |
| B | 5290 | 69 | 1.304348% |
| C | 5290 | 42 | 0.793951% |
| D | 5290 | 842 | 15.916824% |
Noise dominated data is calculated using 1-second bins in cleaned event files. If a bin has >2000 counts, and if more than 50% of those come from <1% of pixels, then it is considered to be noise-dominated and hence unusable.
| Quadrant | # 1 sec bins | Bins with >0 counts | Bins with >2000 counts | High rate bins dominated by noise | Noise dominated (total time) | Noise dominated (detector-on time) | Marked lightcurve |
|---|---|---|---|---|---|---|---|
| A | 7415 | 5291 | 14 | 14 | 0.19% | 0.26% | 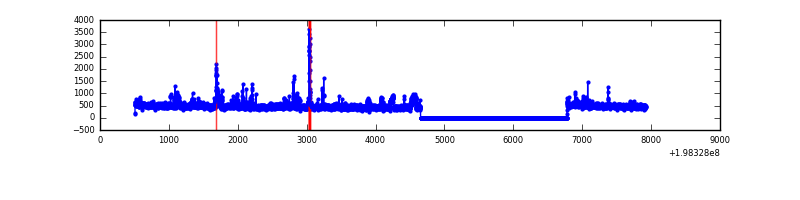 |
| B | 7415 | 5291 | 48 | 48 | 0.65% | 0.91% | 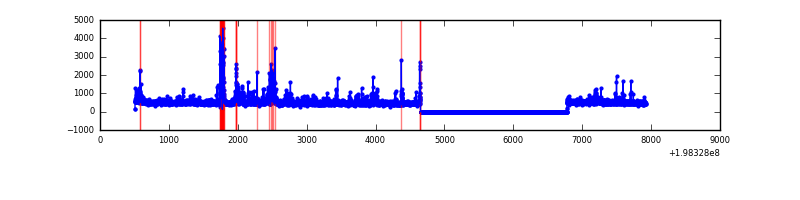 |
| C | 7415 | 5291 | 29 | 29 | 0.39% | 0.55% | 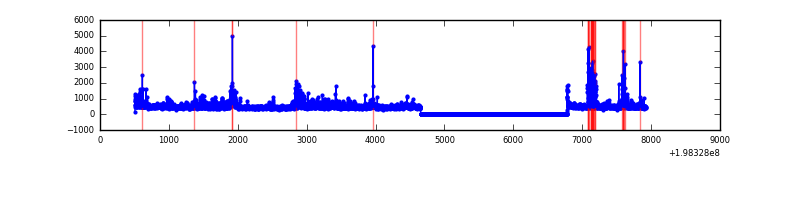 |
| D | 7415 | 5291 | 665 | 665 | 8.97% | 12.57% | 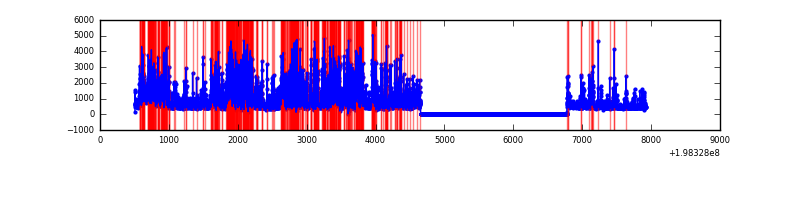 |
Top three noisy pixels from each quadrant. If the there are fewer than three noisy pixels in the level2.evt file, extra rows are filled as -1
| Pixel properties | Quadrant properties | ||||||
|---|---|---|---|---|---|---|---|
| Quadrant | DetID | PixID | Counts | Sigma | Mean | Median | Sigma |
| A | 0 | 31 | 88639 | 725.77 | 607 | 595 | 121.3 |
| A | 14 | 238 | 82172 | 672.46 | 607 | 595 | 121.3 |
| A | 0 | 50 | 72479 | 592.56 | 607 | 595 | 121.3 |
| B | 2 | 249 | 270208 | 2314.01 | 610 | 598 | 116.5 |
| B | 6 | 203 | 66470 | 565.37 | 610 | 598 | 116.5 |
| B | 0 | 205 | 48277 | 409.22 | 610 | 598 | 116.5 |
| C | 1 | 192 | 213084 | 1564.09 | 588 | 591 | 135.9 |
| C | 6 | 80 | 113101 | 828.15 | 588 | 591 | 135.9 |
| C | 8 | 161 | 95015 | 695.03 | 588 | 591 | 135.9 |
| D | 7 | 80 | 2702251 | 20513.38 | 553 | 540 | 131.7 |
| D | 14 | 81 | 149402 | 1130.27 | 553 | 540 | 131.7 |
| D | 14 | 113 | 108620 | 820.62 | 553 | 540 | 131.7 |
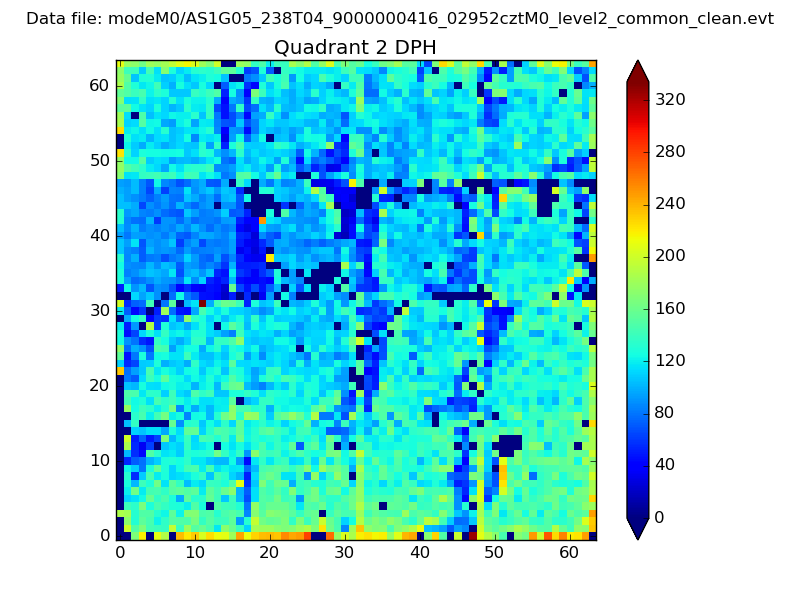
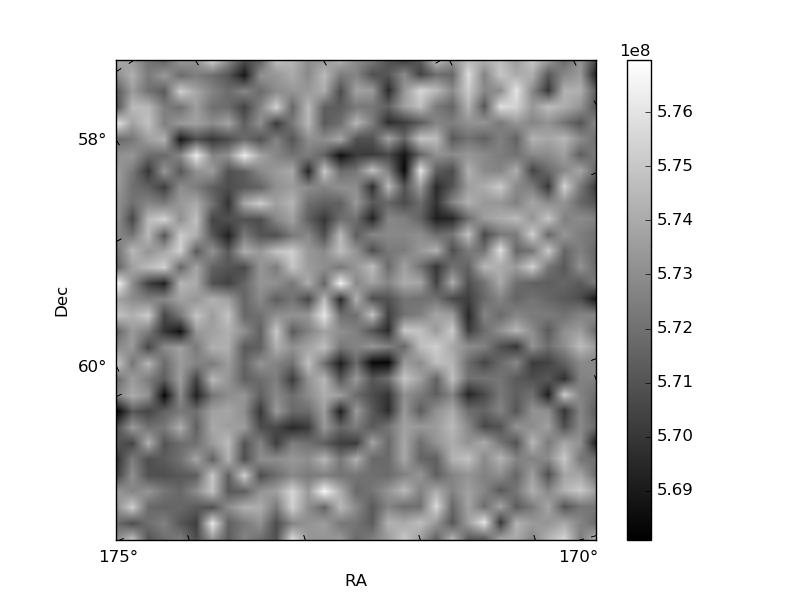
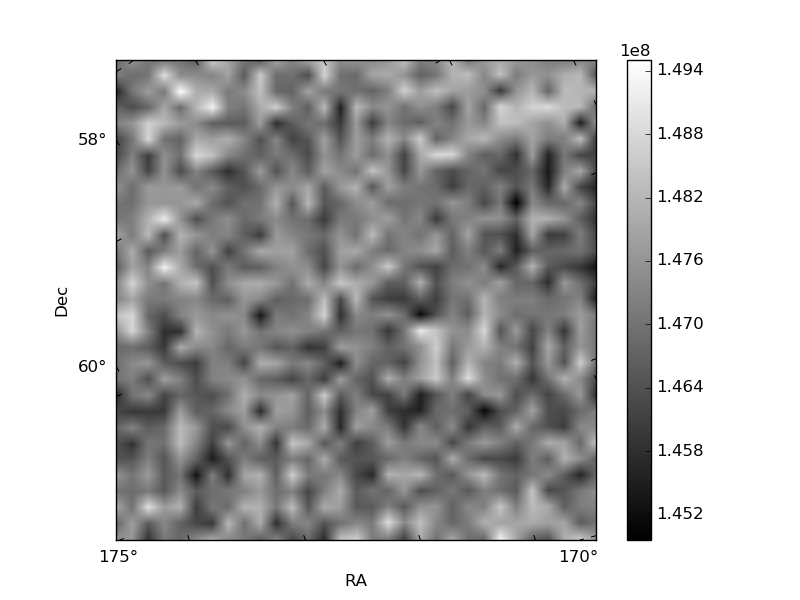
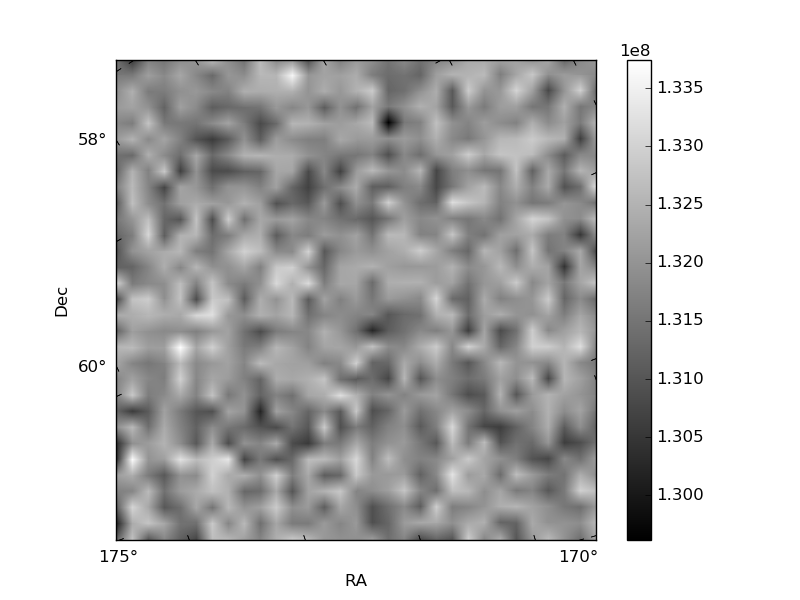
Histogram calculated using DETX and DETY for each event in the final _common_clean file
| Quadrant A | 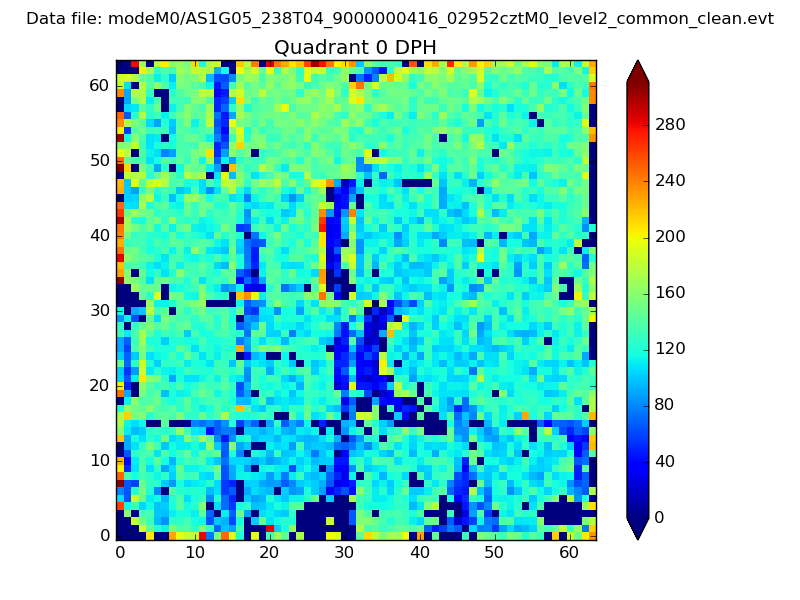 |
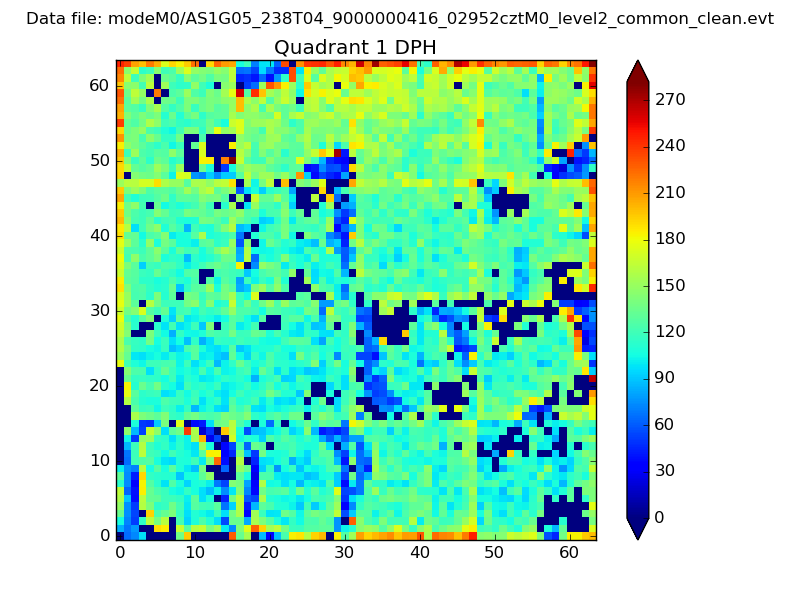 |
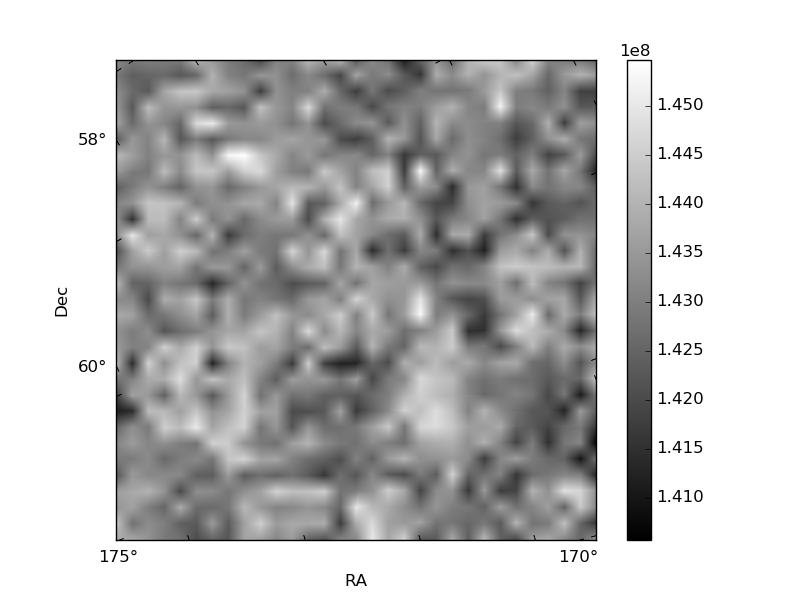
Quadrant B |
|---|---|---|---|
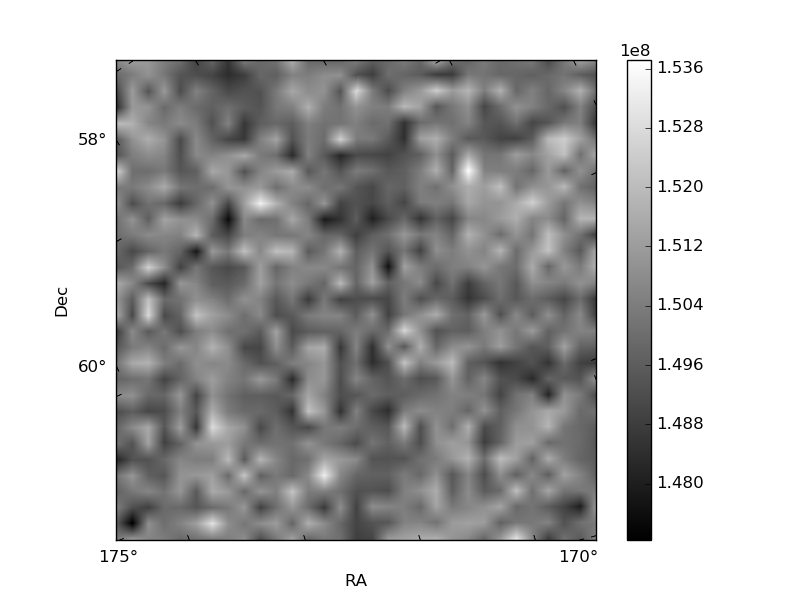
| Quadrant D | 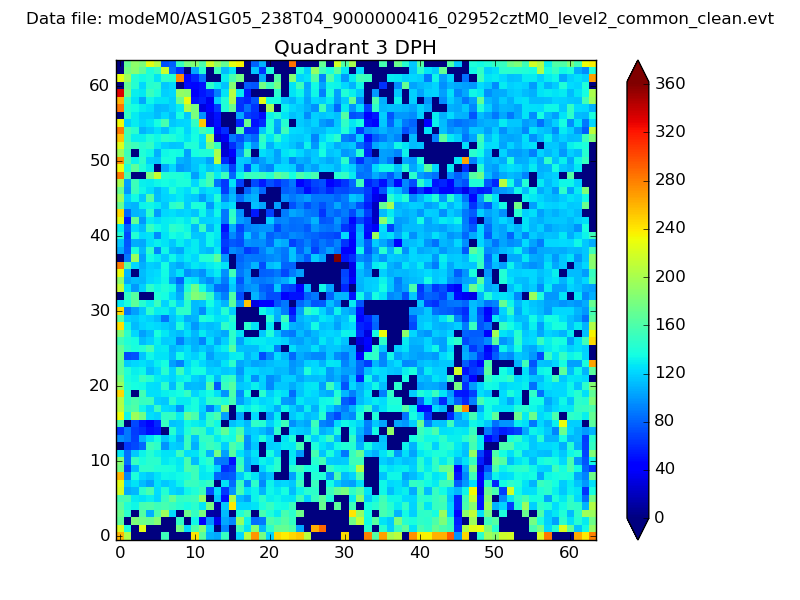 |
 |
Quadrant C |
| Plot type | Count rate plots | Images |
|---|---|---|
| Comparison with Poisson distribution Blue bars denote a histogram of data divided into 1 sec bins. Red curve is a Poisson curve with rate = median count rate of data. |
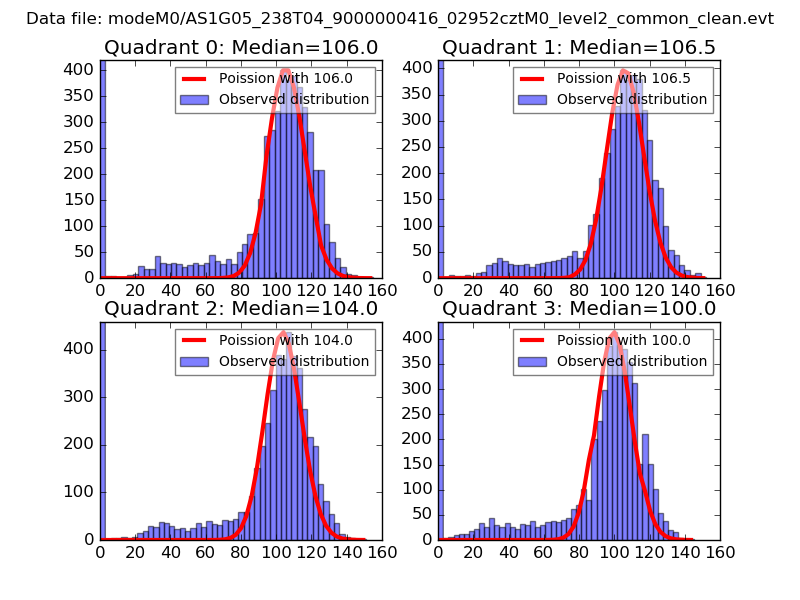 |
 |
| Quadrant-wise count rates Data is divided into 100 sec bins |
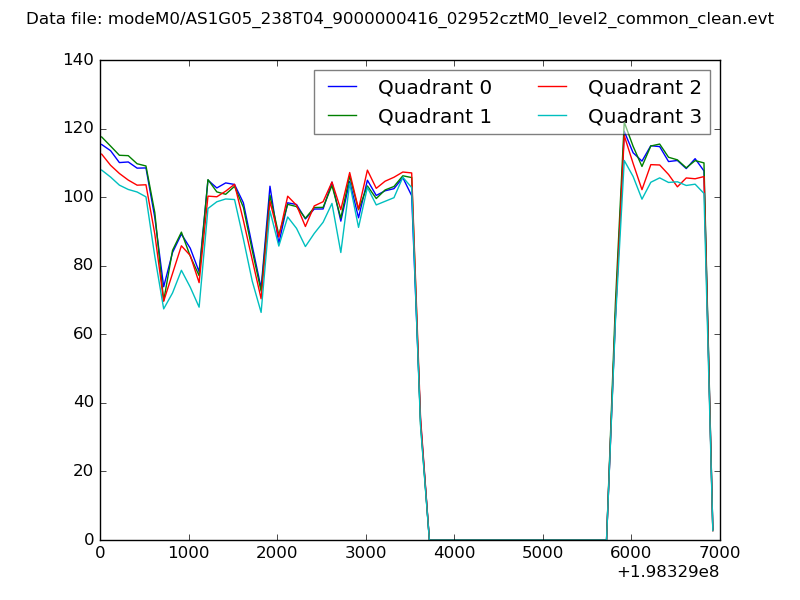 |
|
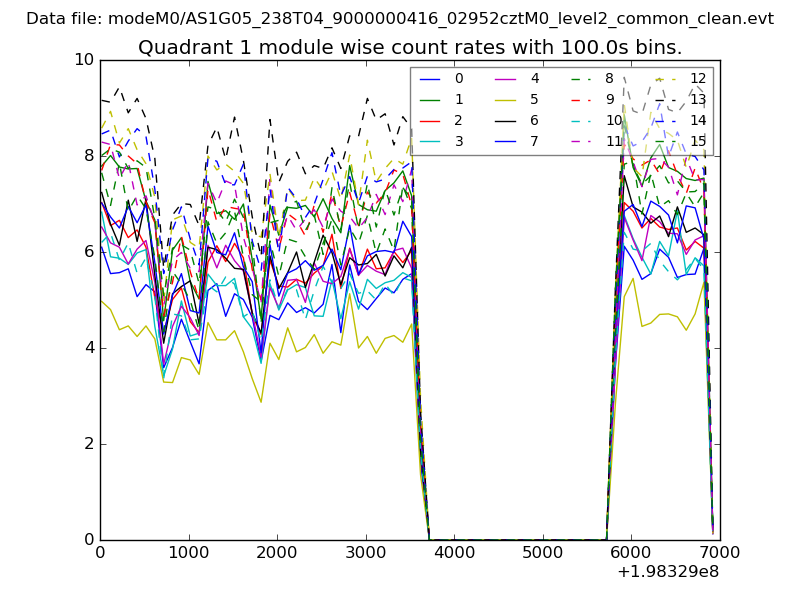
| Module-wise count rates for Quadrant A Data is divided into 100 sec bins |
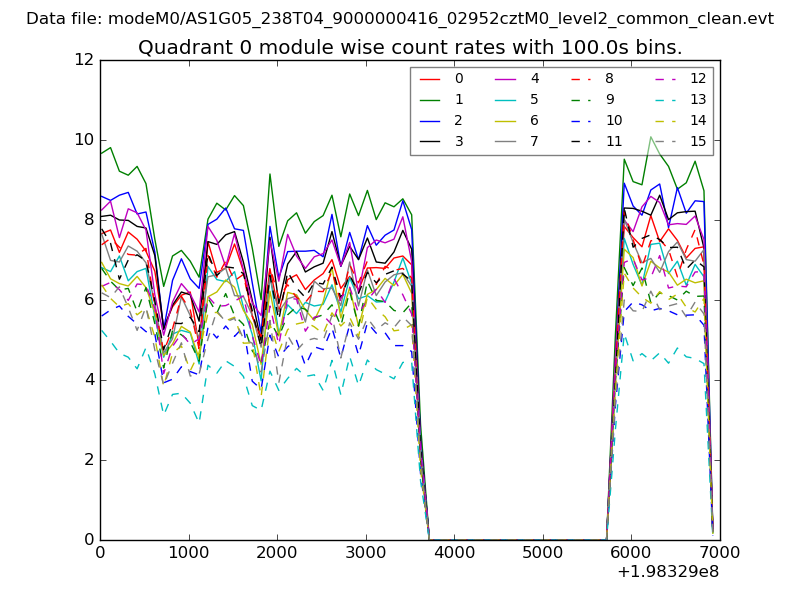 |
 |
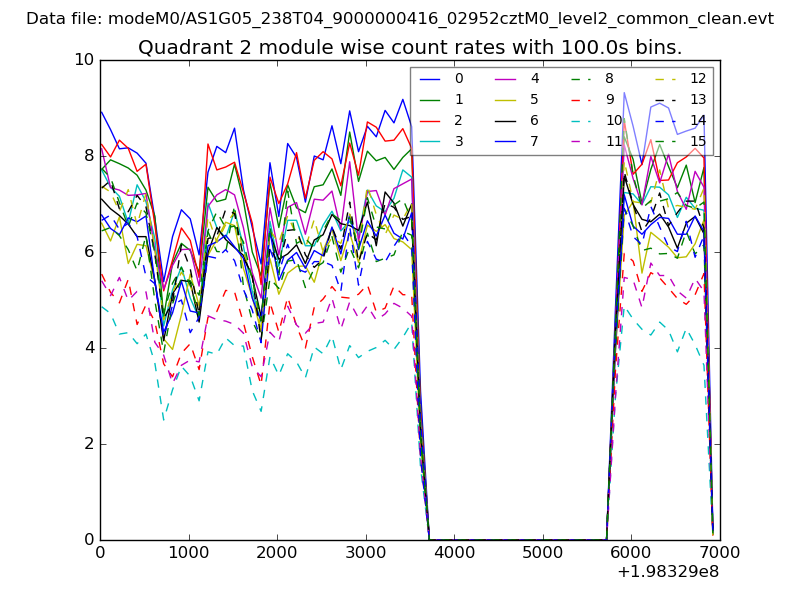
| Module-wise count rates for Quadrant B Data is divided into 100 sec bins |
 |
 |
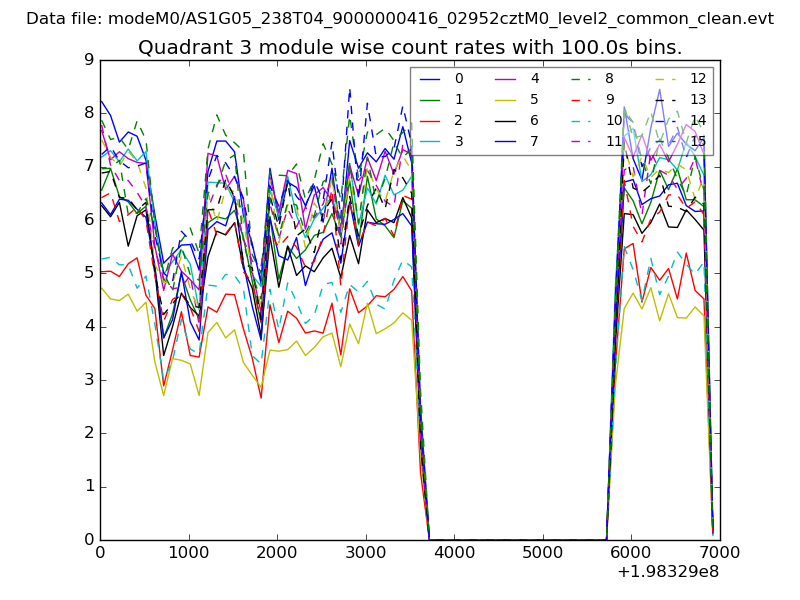
| Module-wise count rates for Quadrant C Data is divided into 100 sec bins |
 |
 |
| Module-wise count rates for Quadrant D Data is divided into 100 sec bins |
 |
 |
| Parameter | Plot |
|---|---|
| CZT HV Monitor | 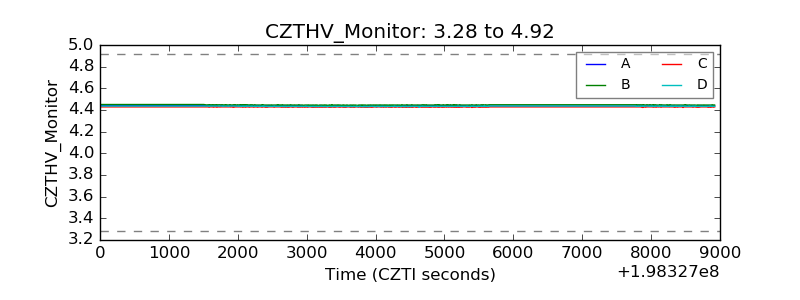 |
| D_VDD | 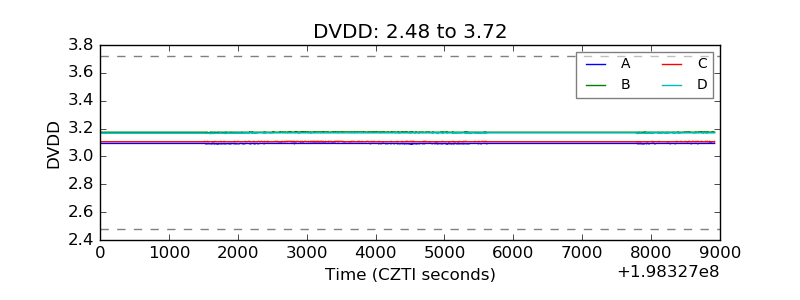 |
| Temperature 1 | 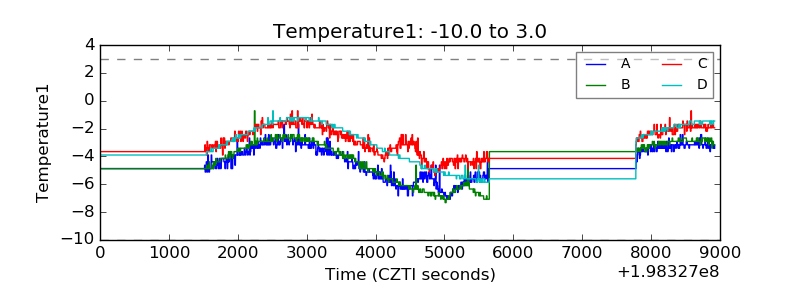 |
| Veto HV Monitor | 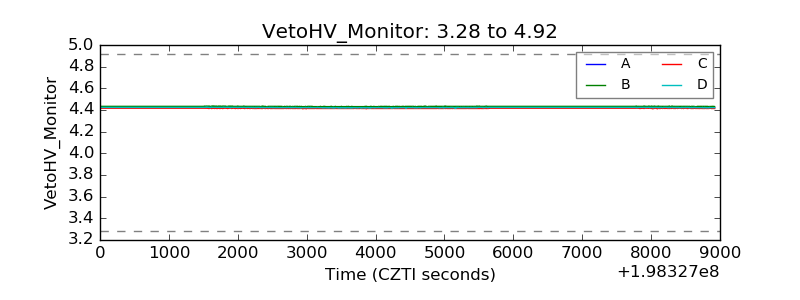 |
| Veto LLD | 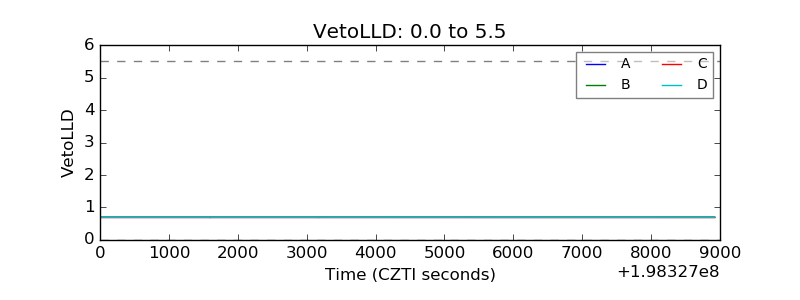 |
| Alpha Counter | 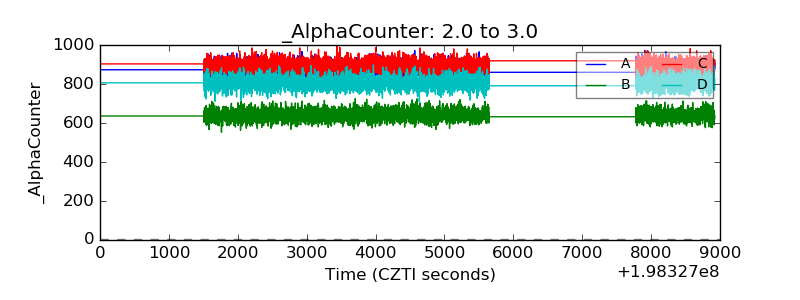 |
| _CPM_Rate | 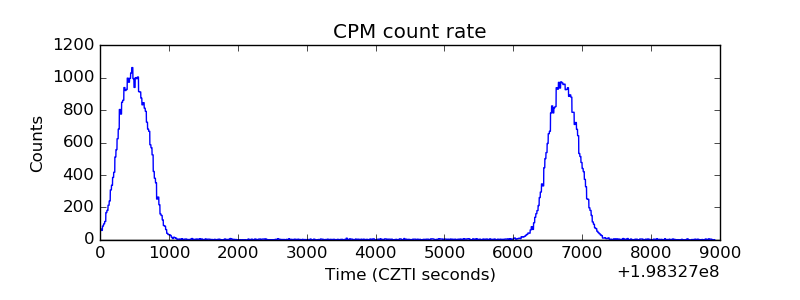 |
| CZT Counter | 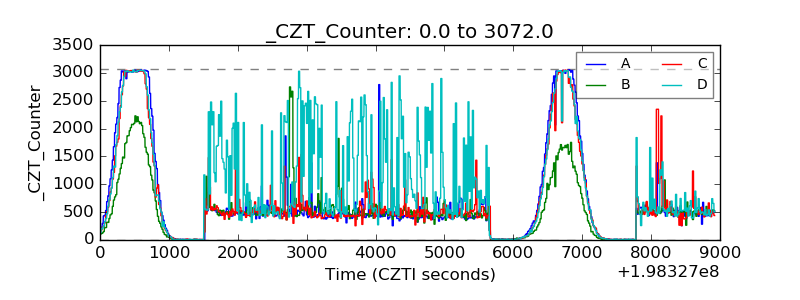 |
| +2.5 Volts monitor |  |
| +5 Volts monitor |  |
| Veto Counter | 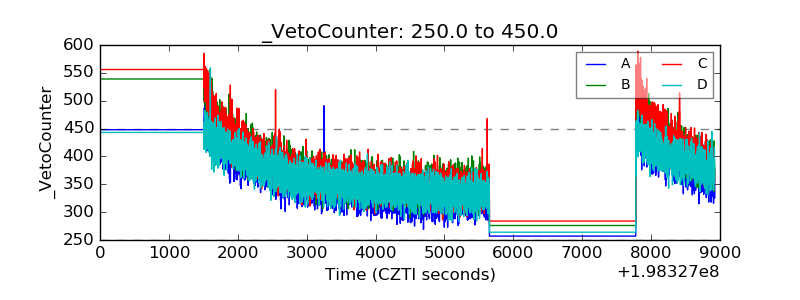 |