| Param | Original file | Final file |
|---|---|---|
| Filename | modeM0/AS1G05_238T04_9000000416_02954cztM0_level2.evt | modeM0/AS1G05_238T04_9000000416_02954cztM0_level2_common_clean.evt |
| Size (bytes) | 379,929,600 | 72,763,200 |
| Size | 362.3 MB | 69.4 MB |
| Events in quadrant A | 2,780,878 | 466,597 |
| Events in quadrant B | 2,641,912 | 463,651 |
| Events in quadrant C | 2,785,024 | 464,909 |
| Events in quadrant D | 2,953,026 | 453,406 |
| Mode M0 | |||
|---|---|---|---|
| Quadrant | BADHDUFLAG | Total packets | Discarded packets |
| A | 0 | 11745 | 3 |
| B | 0 | 11372 | 2 |
| C | 0 | 11888 | 2 |
| D | 0 | 12321 | 2 |
| Mode SS | |||
|---|---|---|---|
| Quadrant | BADHDUFLAG | Total packets | Discarded packets |
| A | 0 | 102 | 0 |
| B | 0 | 102 | 0 |
| C | 0 | 102 | 0 |
| D | 0 | 102 | 0 |
| Mode M9 | |||
|---|---|---|---|
| Quadrant | BADHDUFLAG | Total packets | Discarded packets |
| A | 0 | 24 | 0 |
| B | 0 | 24 | 0 |
| C | 0 | 24 | 0 |
| D | 0 | 25 | 0 |
| Quadrant | Total seconds | Saturated seconds | Saturation percentage |
|---|---|---|---|
| A | 5083 | 79 | 1.554200% |
| B | 5083 | 61 | 1.200079% |
| C | 5083 | 63 | 1.239426% |
| D | 5083 | 91 | 1.790281% |
Noise dominated data is calculated using 1-second bins in cleaned event files. If a bin has >2000 counts, and if more than 50% of those come from <1% of pixels, then it is considered to be noise-dominated and hence unusable.
| Quadrant | # 1 sec bins | Bins with >0 counts | Bins with >2000 counts | High rate bins dominated by noise | Noise dominated (total time) | Noise dominated (detector-on time) | Marked lightcurve |
|---|---|---|---|---|---|---|---|
| A | 7209 | 5084 | 59 | 59 | 0.82% | 1.16% | 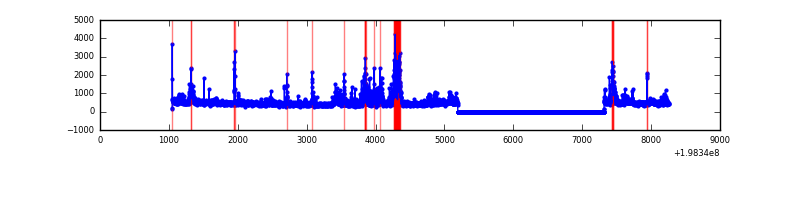 |
| B | 7209 | 5084 | 44 | 44 | 0.61% | 0.87% | 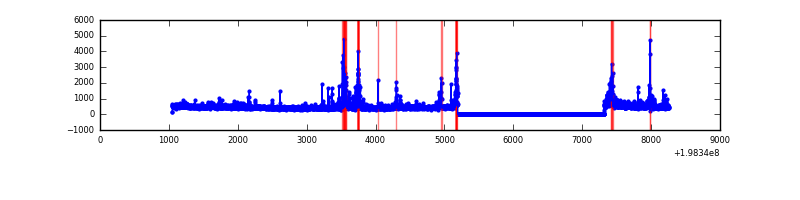 |
| C | 7209 | 5084 | 50 | 50 | 0.69% | 0.98% | 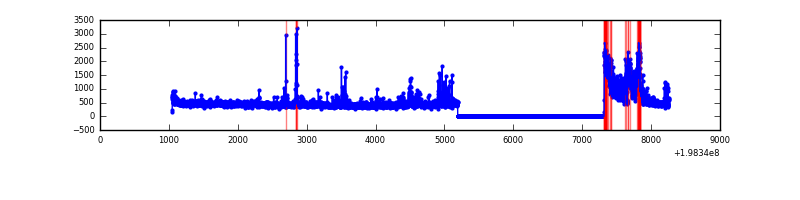 |
| D | 7209 | 5084 | 82 | 82 | 1.14% | 1.61% | 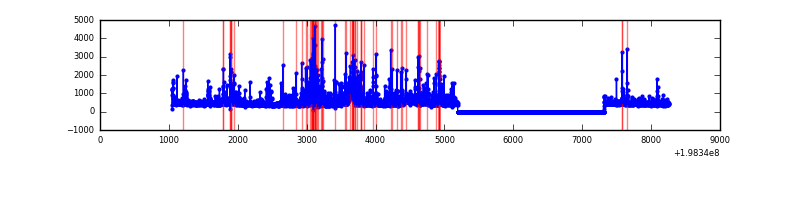 |
Top three noisy pixels from each quadrant. If the there are fewer than three noisy pixels in the level2.evt file, extra rows are filled as -1
| Pixel properties | Quadrant properties | ||||||
|---|---|---|---|---|---|---|---|
| Quadrant | DetID | PixID | Counts | Sigma | Mean | Median | Sigma |
| A | 14 | 238 | 494403 | 4491.91 | 547 | 535 | 109.9 |
| A | 14 | 249 | 54755 | 493.15 | 547 | 535 | 109.9 |
| A | 0 | 31 | 42003 | 377.16 | 547 | 535 | 109.9 |
| B | 2 | 249 | 229256 | 2153.39 | 557 | 545 | 106.2 |
| B | 3 | 27 | 64396 | 601.18 | 557 | 545 | 106.2 |
| B | 0 | 205 | 45218 | 420.61 | 557 | 545 | 106.2 |
| C | 1 | 192 | 515465 | 4090.08 | 542 | 546 | 125.9 |
| C | 6 | 80 | 80223 | 632.89 | 542 | 546 | 125.9 |
| C | 10 | 21 | 17567 | 135.2 | 542 | 546 | 125.9 |
| D | 1 | 31 | 271347 | 2105.42 | 536 | 523 | 128.6 |
| D | 15 | 35 | 166608 | 1291.16 | 536 | 523 | 128.6 |
| D | 14 | 81 | 83821 | 647.57 | 536 | 523 | 128.6 |
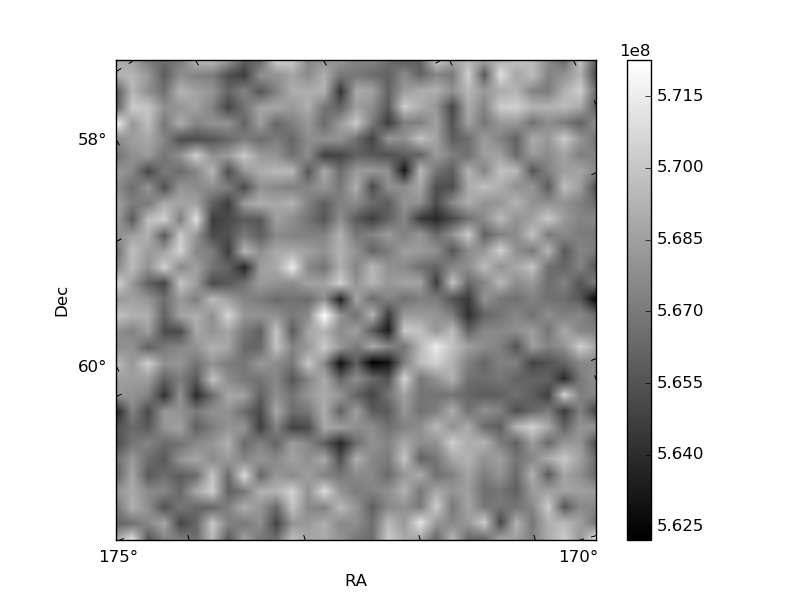
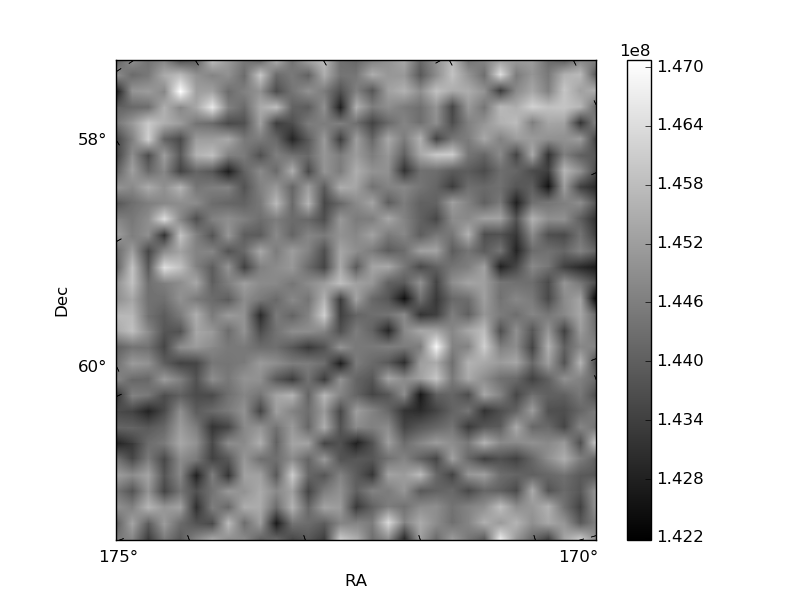
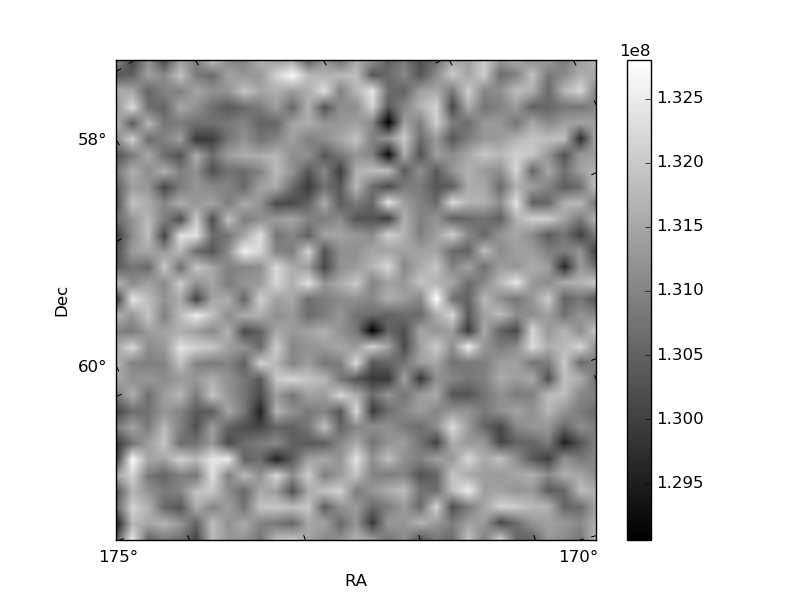
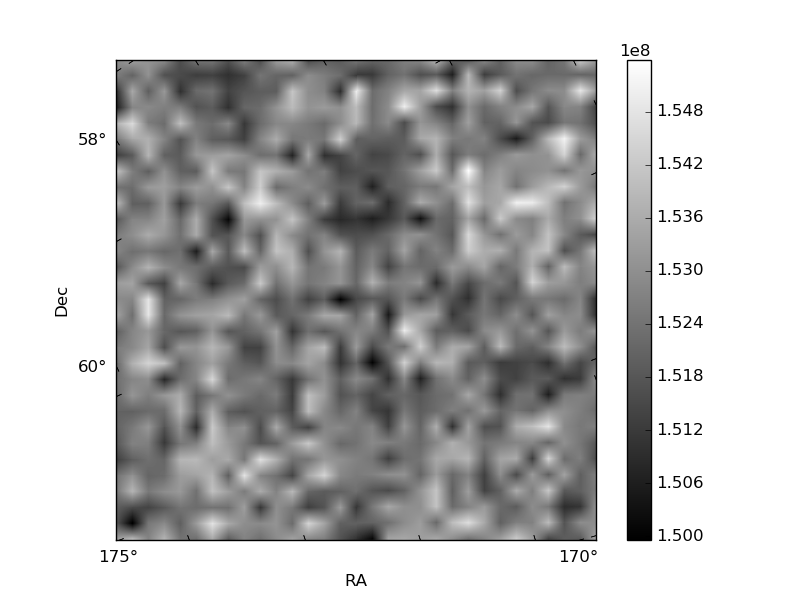
Histogram calculated using DETX and DETY for each event in the final _common_clean file
| Quadrant A | 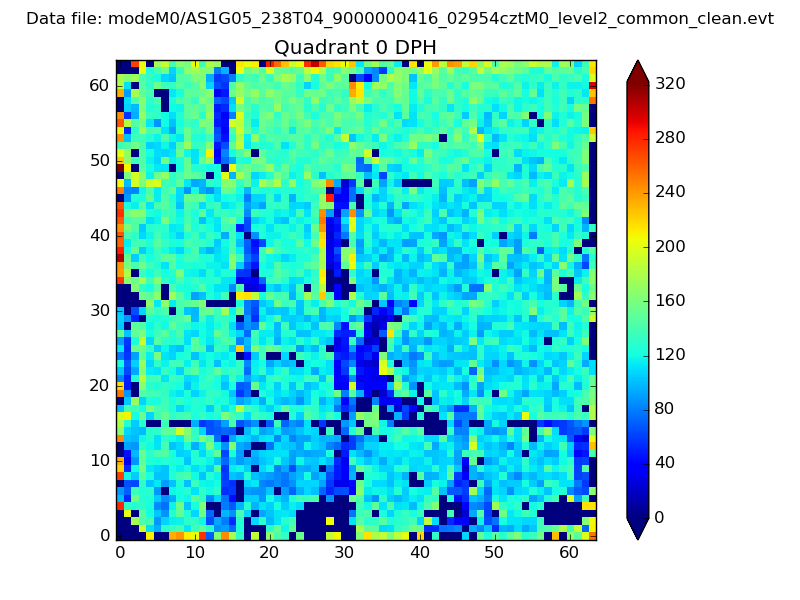 |
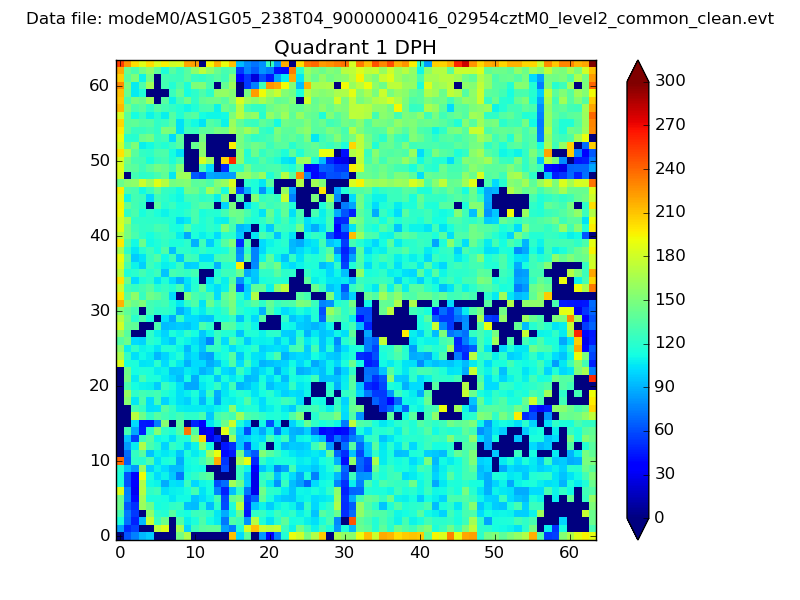 |
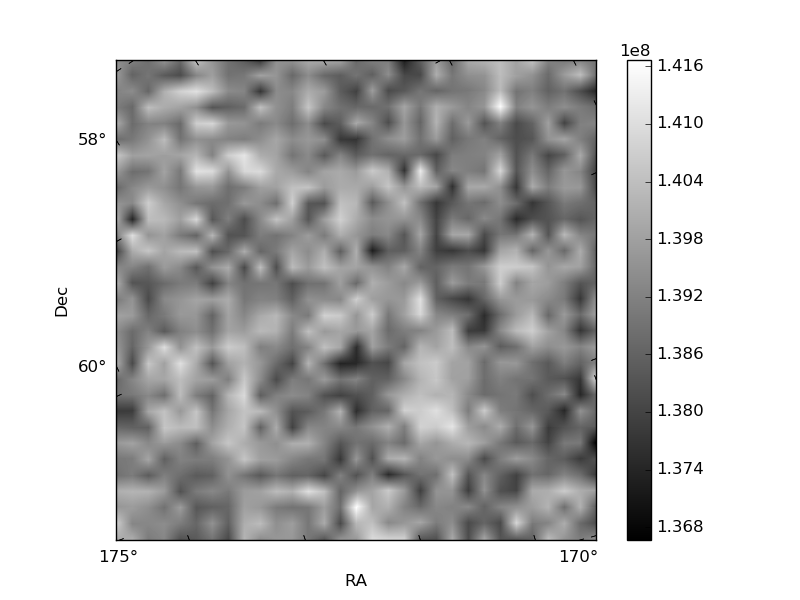
Quadrant B |
|---|---|---|---|
| Quadrant D | 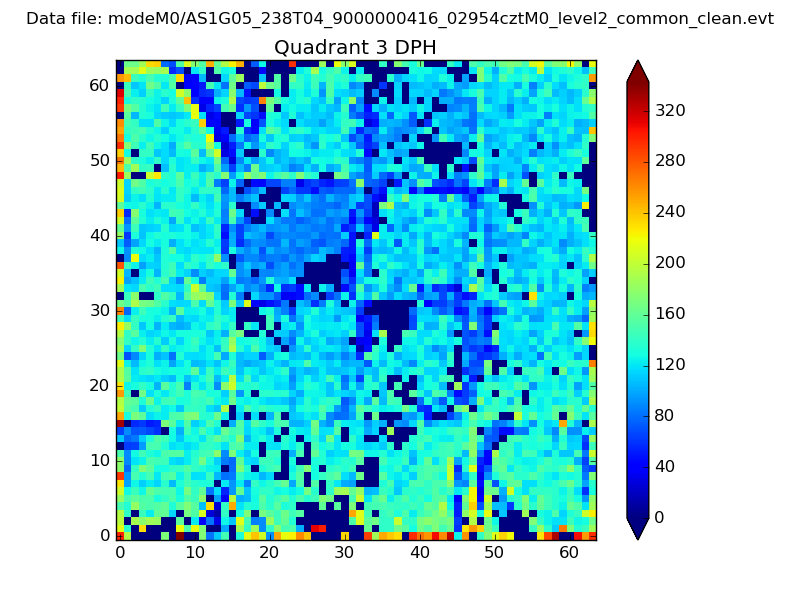 |
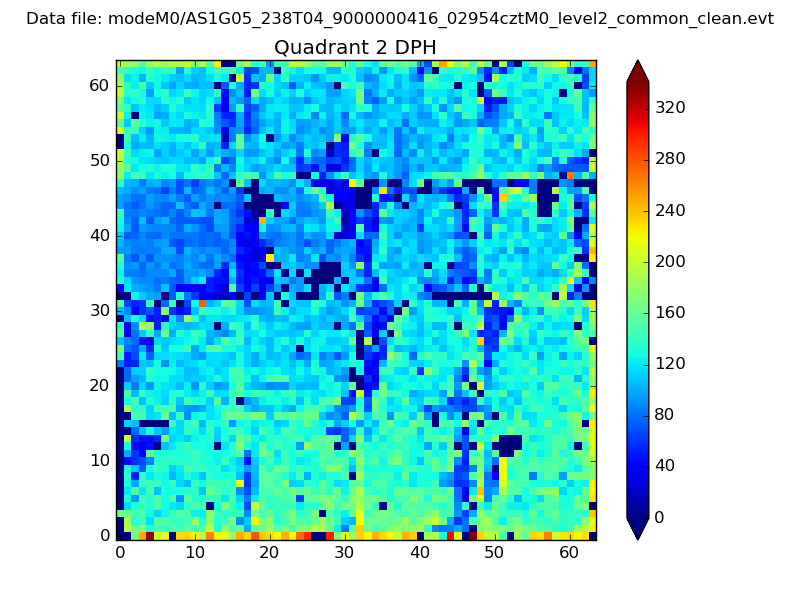 |
Quadrant C |
| Plot type | Count rate plots | Images |
|---|---|---|
| Comparison with Poisson distribution Blue bars denote a histogram of data divided into 1 sec bins. Red curve is a Poisson curve with rate = median count rate of data. |
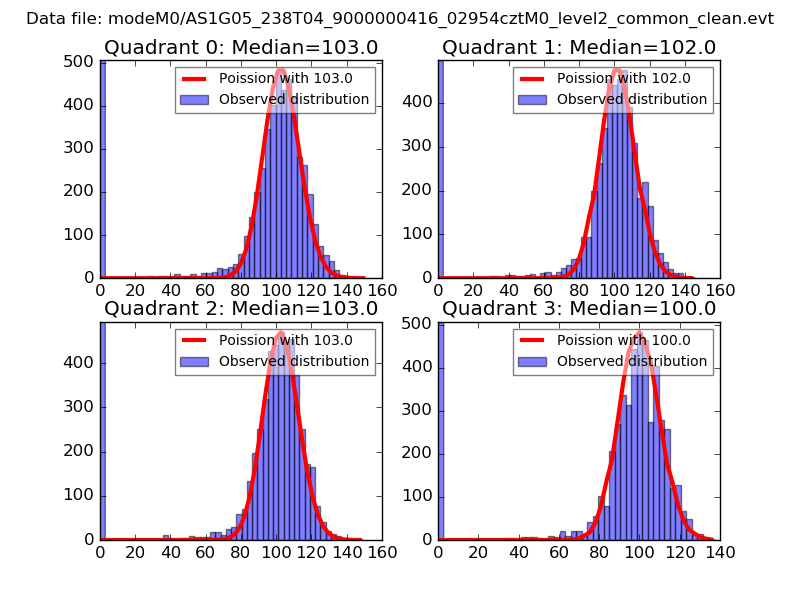 |
 |
| Quadrant-wise count rates Data is divided into 100 sec bins |
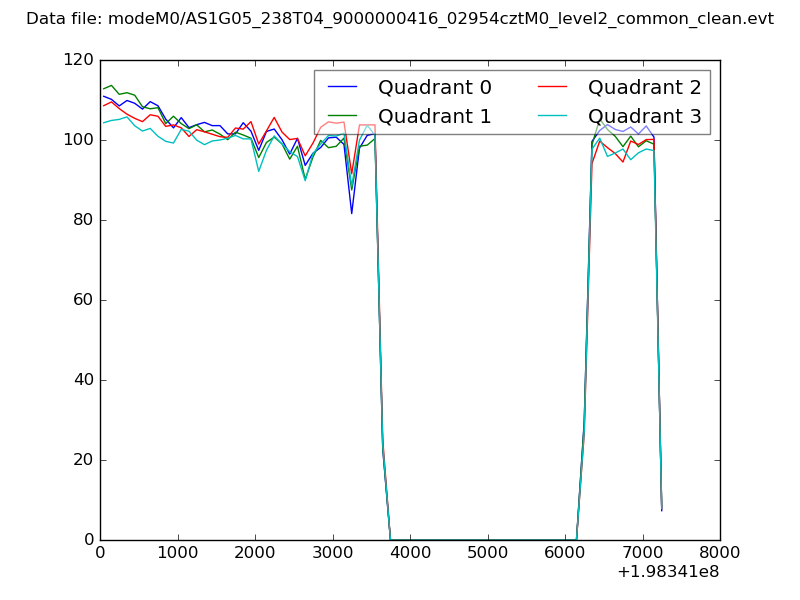 |
|
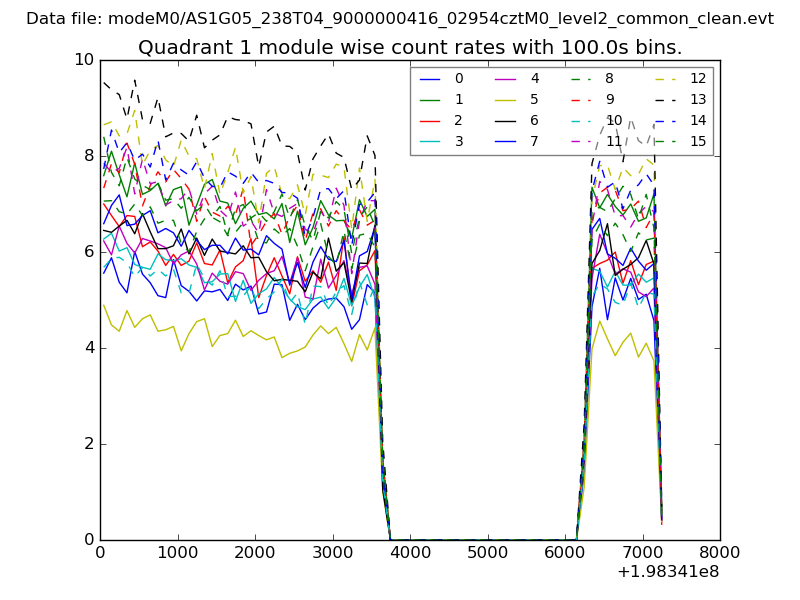
| Module-wise count rates for Quadrant A Data is divided into 100 sec bins |
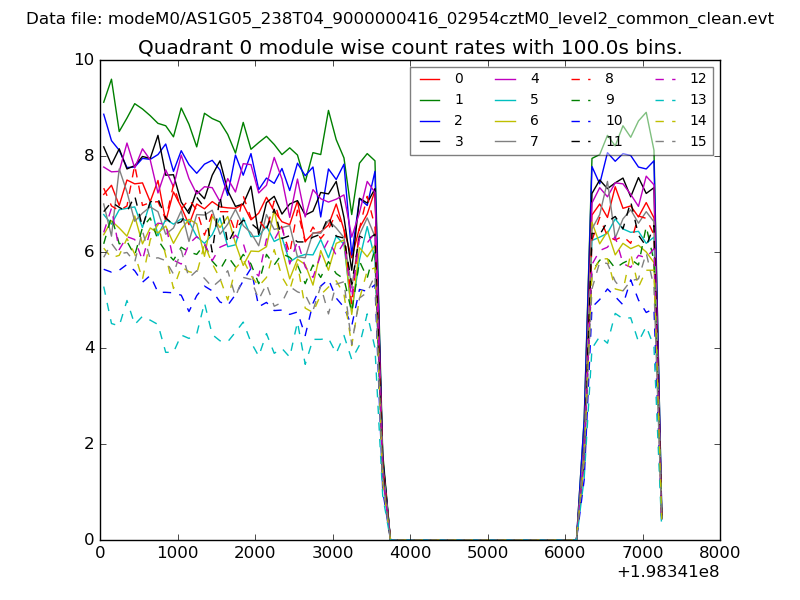 |
 |
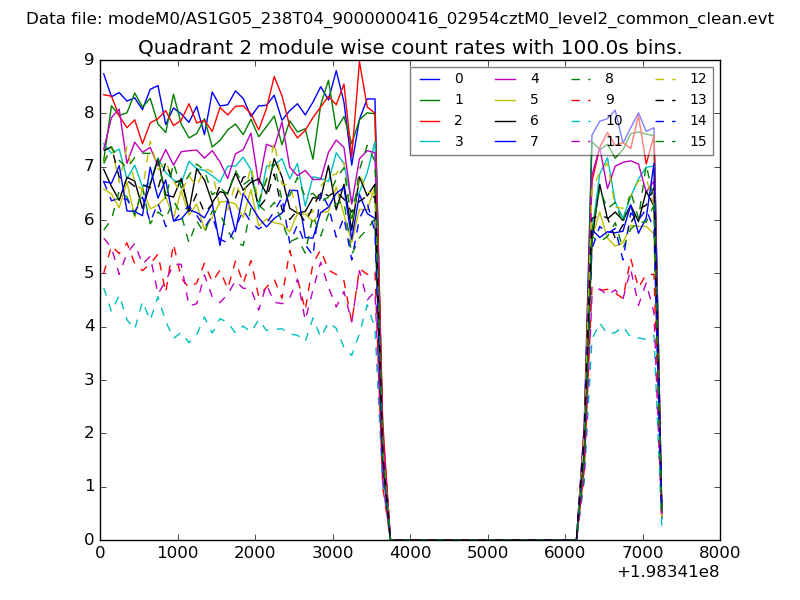
| Module-wise count rates for Quadrant B Data is divided into 100 sec bins |
 |
 |
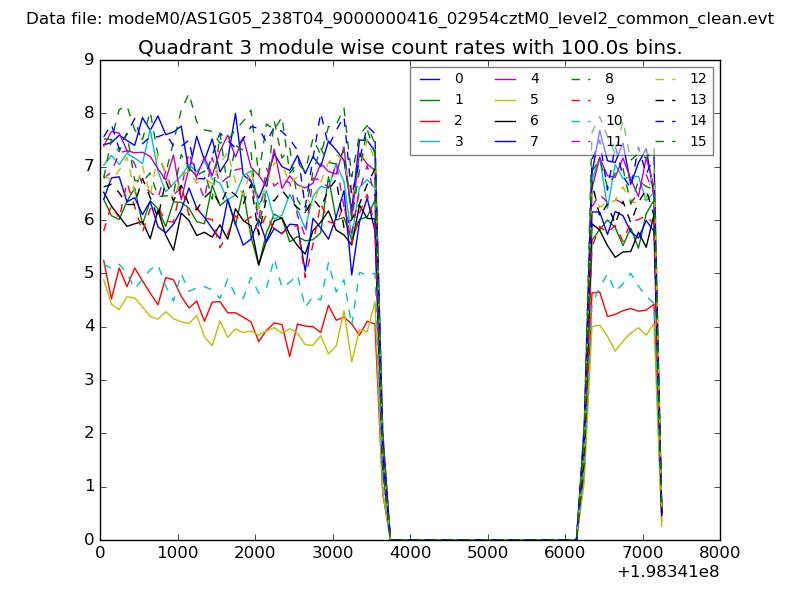
| Module-wise count rates for Quadrant C Data is divided into 100 sec bins |
 |
 |
| Module-wise count rates for Quadrant D Data is divided into 100 sec bins |
 |
 |
| Parameter | Plot |
|---|---|
| CZT HV Monitor | 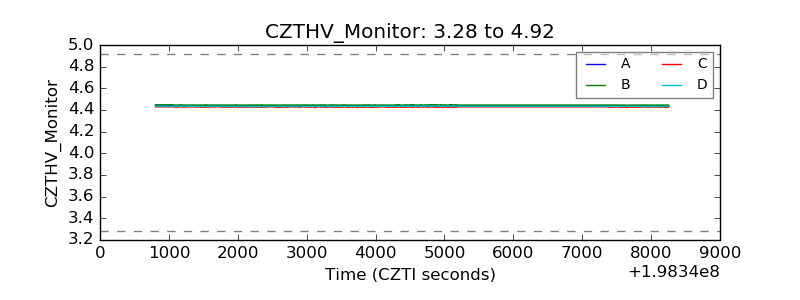 |
| D_VDD | 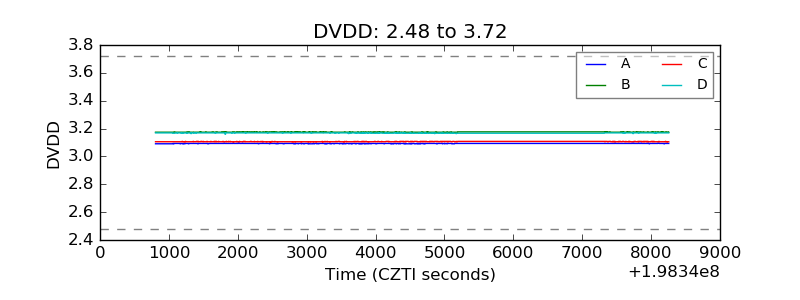 |
| Temperature 1 | 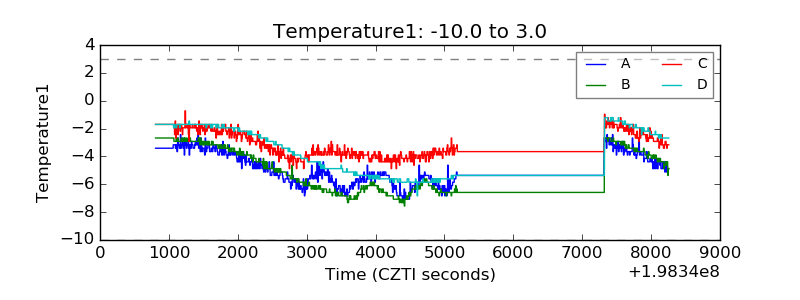 |
| Veto HV Monitor |  |
| Veto LLD | 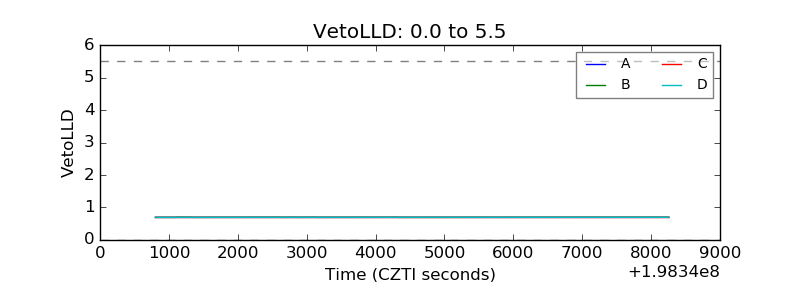 |
| Alpha Counter | 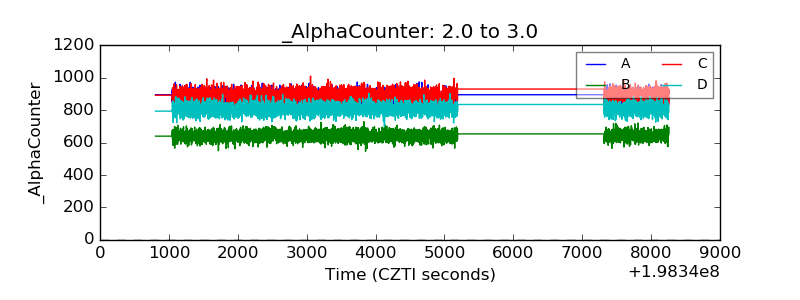 |
| _CPM_Rate | 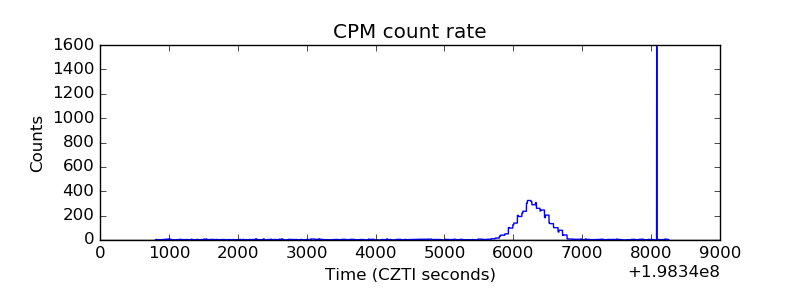 |
| CZT Counter | 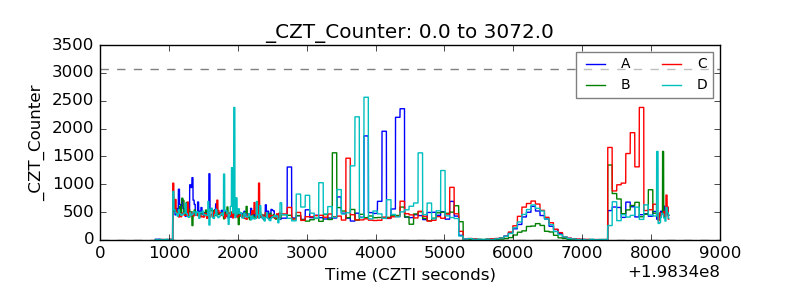 |
| +2.5 Volts monitor |  |
| +5 Volts monitor |  |
| Veto Counter | 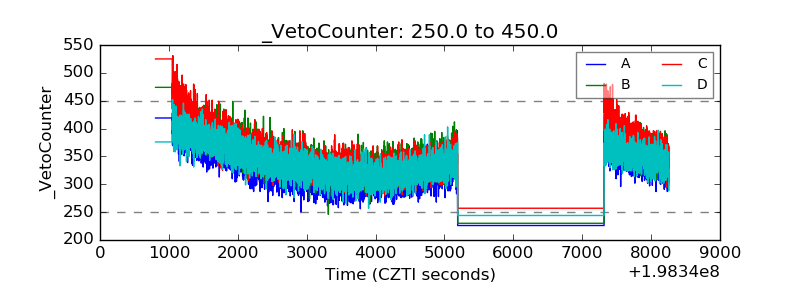 |