| Param | Original file | Final file |
|---|---|---|
| Filename | modeM0/AS1G05_238T04_9000000416_02955cztM0_level2.evt | modeM0/AS1G05_238T04_9000000416_02955cztM0_level2_common_clean.evt |
| Size (bytes) | 364,360,320 | 62,360,640 |
| Size | 347.5 MB | 59.5 MB |
| Events in quadrant A | 2,852,984 | 387,879 |
| Events in quadrant B | 2,550,627 | 384,947 |
| Events in quadrant C | 2,647,312 | 389,201 |
| Events in quadrant D | 2,648,679 | 382,128 |
| Mode M0 | |||
|---|---|---|---|
| Quadrant | BADHDUFLAG | Total packets | Discarded packets |
| A | 0 | 11952 | 3 |
| B | 0 | 11049 | 2 |
| C | 0 | 11535 | 2 |
| D | 0 | 11410 | 2 |
| Mode SS | |||
|---|---|---|---|
| Quadrant | BADHDUFLAG | Total packets | Discarded packets |
| A | 0 | 100 | 0 |
| B | 0 | 100 | 0 |
| C | 0 | 100 | 0 |
| D | 0 | 100 | 0 |
| Mode M9 | |||
|---|---|---|---|
| Quadrant | BADHDUFLAG | Total packets | Discarded packets |
| A | 0 | 27 | 0 |
| B | 0 | 27 | 0 |
| C | 0 | 27 | 0 |
| D | 0 | 28 | 0 |
| Quadrant | Total seconds | Saturated seconds | Saturation percentage |
|---|---|---|---|
| A | 4922 | 139 | 2.824055% |
| B | 4922 | 70 | 1.422186% |
| C | 4922 | 62 | 1.259651% |
| D | 4922 | 70 | 1.422186% |
Noise dominated data is calculated using 1-second bins in cleaned event files. If a bin has >2000 counts, and if more than 50% of those come from <1% of pixels, then it is considered to be noise-dominated and hence unusable.
| Quadrant | # 1 sec bins | Bins with >0 counts | Bins with >2000 counts | High rate bins dominated by noise | Noise dominated (total time) | Noise dominated (detector-on time) | Marked lightcurve |
|---|---|---|---|---|---|---|---|
| A | 7048 | 4923 | 106 | 106 | 1.50% | 2.15% | 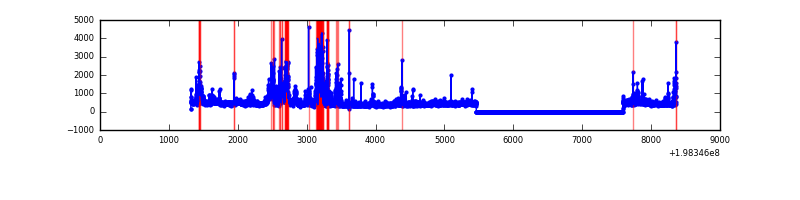 |
| B | 7048 | 4923 | 49 | 49 | 0.70% | 1.00% | 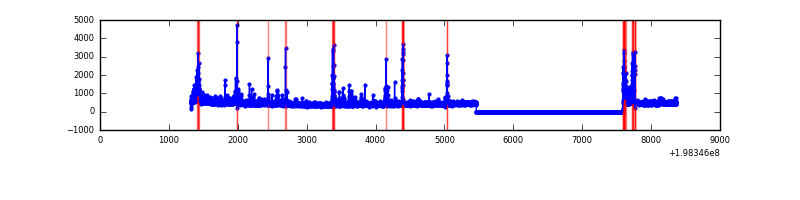 |
| C | 7048 | 4923 | 48 | 48 | 0.68% | 0.98% | 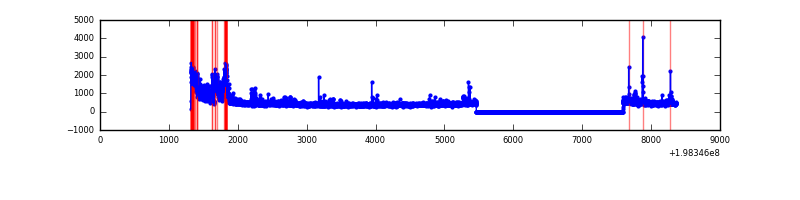 |
| D | 7048 | 4923 | 60 | 60 | 0.85% | 1.22% | 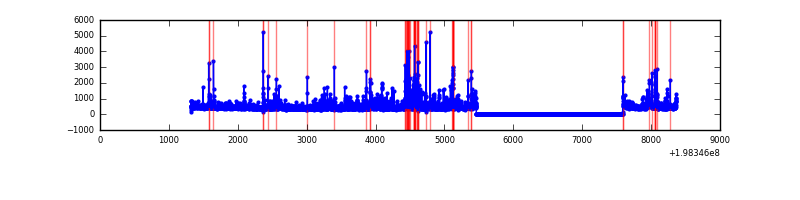 |
Top three noisy pixels from each quadrant. If the there are fewer than three noisy pixels in the level2.evt file, extra rows are filled as -1
| Pixel properties | Quadrant properties | ||||||
|---|---|---|---|---|---|---|---|
| Quadrant | DetID | PixID | Counts | Sigma | Mean | Median | Sigma |
| A | 14 | 238 | 638168 | 6149.91 | 510 | 499 | 103.7 |
| A | 0 | 31 | 92463 | 886.93 | 510 | 499 | 103.7 |
| A | 0 | 50 | 68593 | 656.72 | 510 | 499 | 103.7 |
| B | 2 | 249 | 192479 | 1896.52 | 524 | 512 | 101.2 |
| B | 6 | 36 | 97784 | 960.99 | 524 | 512 | 101.2 |
| B | 6 | 203 | 59283 | 580.62 | 524 | 512 | 101.2 |
| C | 1 | 192 | 530042 | 4398.96 | 510 | 511 | 120.4 |
| C | 6 | 80 | 49335 | 405.59 | 510 | 511 | 120.4 |
| C | 0 | 219 | 21432 | 173.8 | 510 | 511 | 120.4 |
| D | 13 | 239 | 135722 | 1112.47 | 503 | 492 | 121.6 |
| D | 14 | 81 | 130359 | 1068.35 | 503 | 492 | 121.6 |
| D | 12 | 1 | 100431 | 822.15 | 503 | 492 | 121.6 |
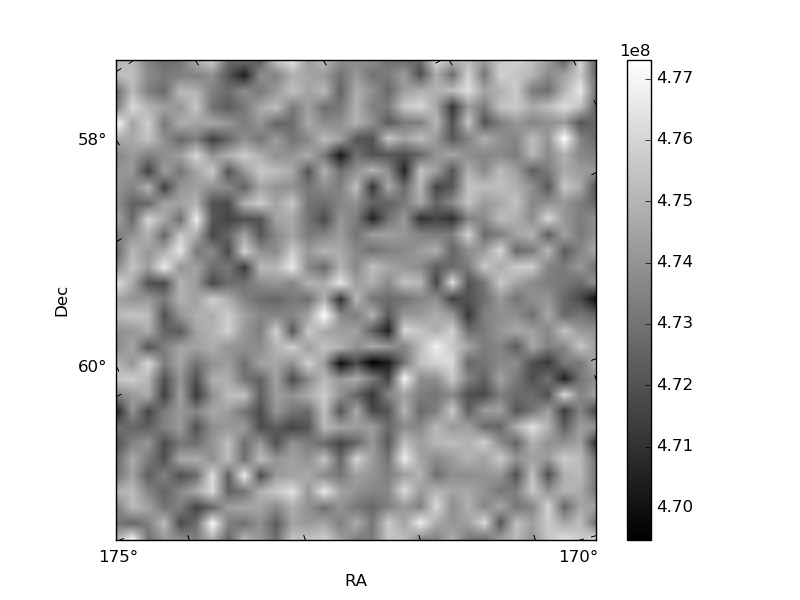
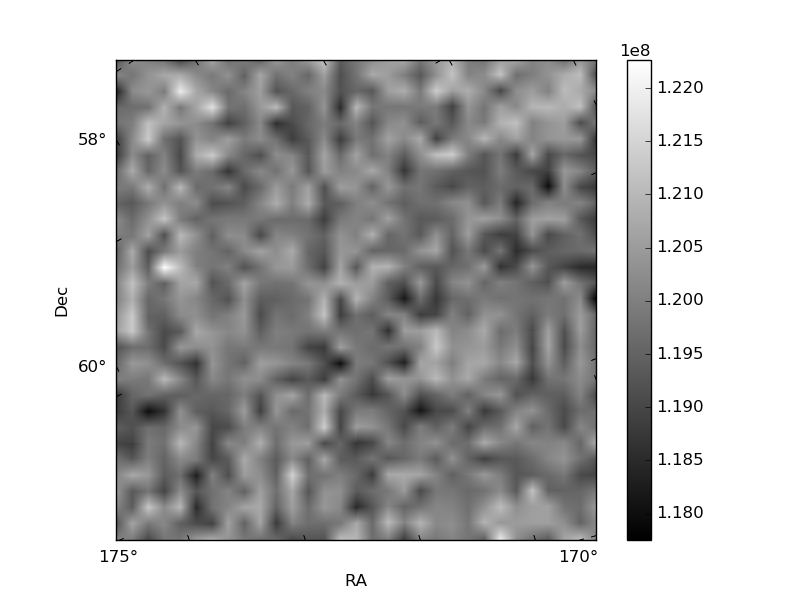
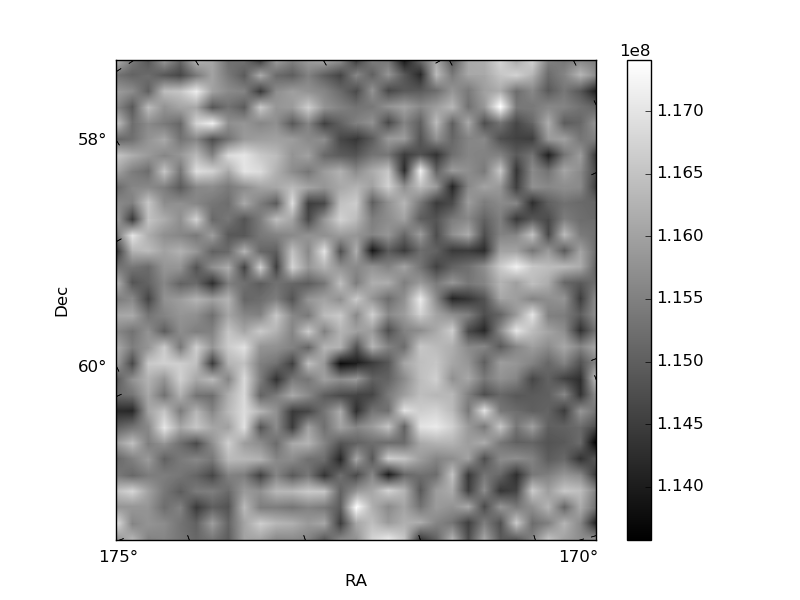
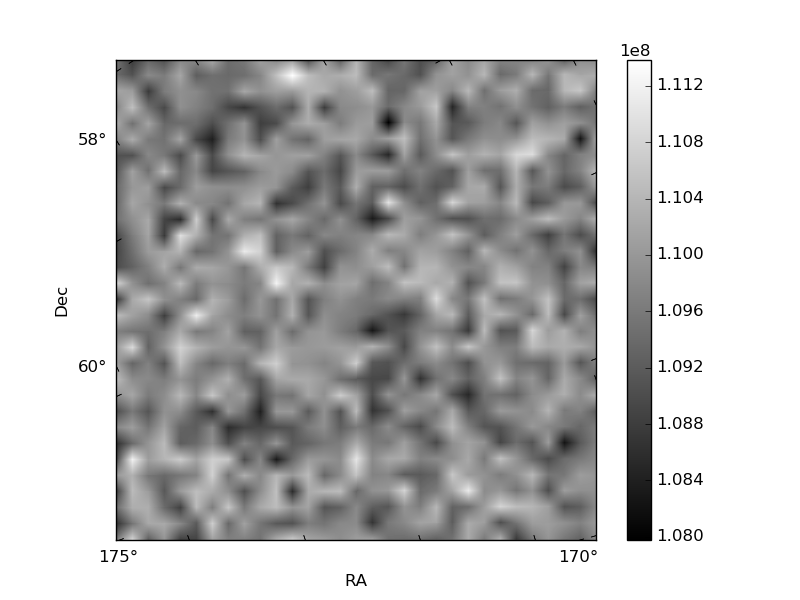
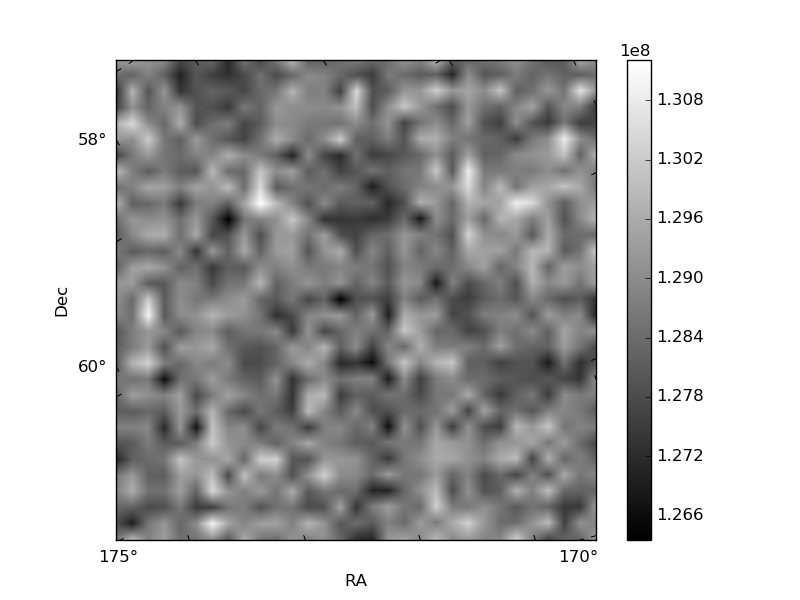
Histogram calculated using DETX and DETY for each event in the final _common_clean file
| Quadrant A | 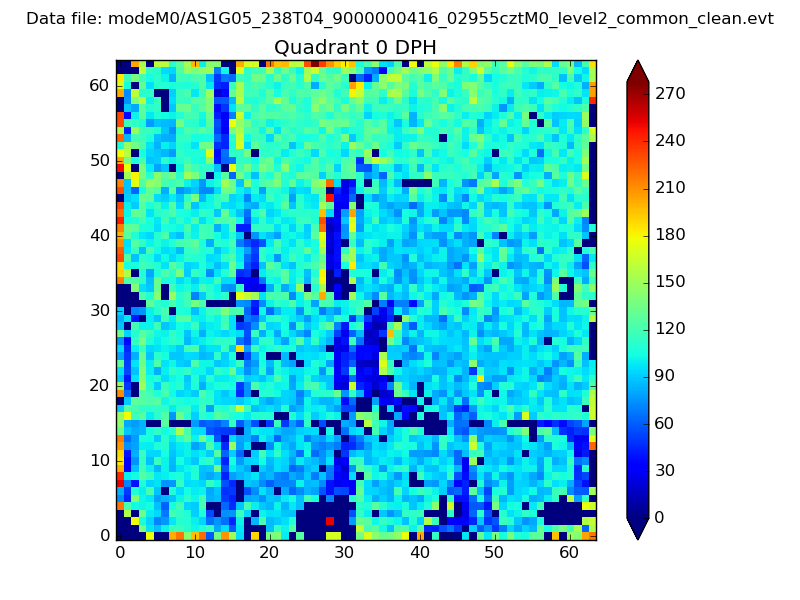 |
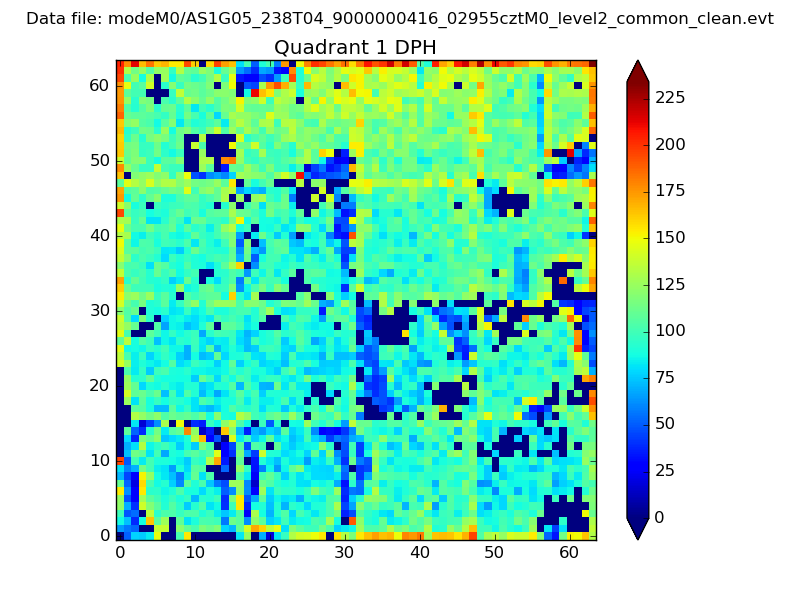 |
Quadrant B |
|---|---|---|---|
| Quadrant D | 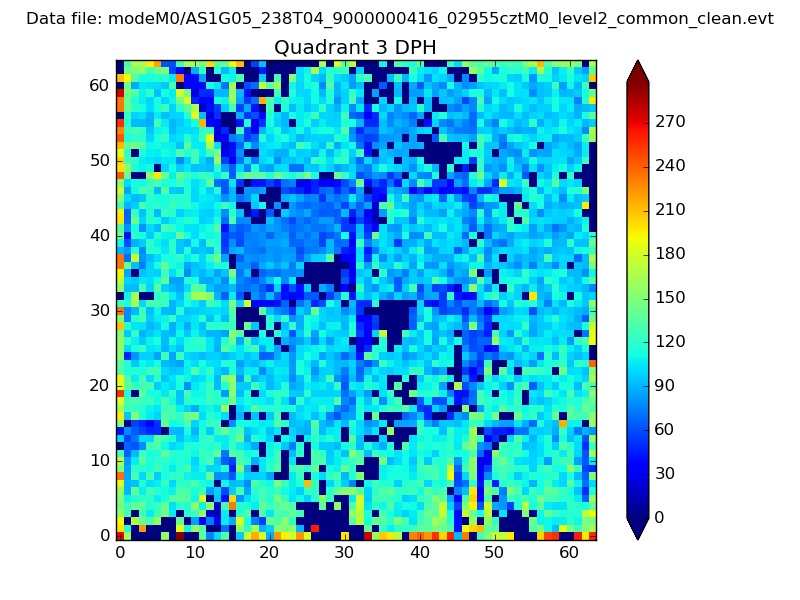 |
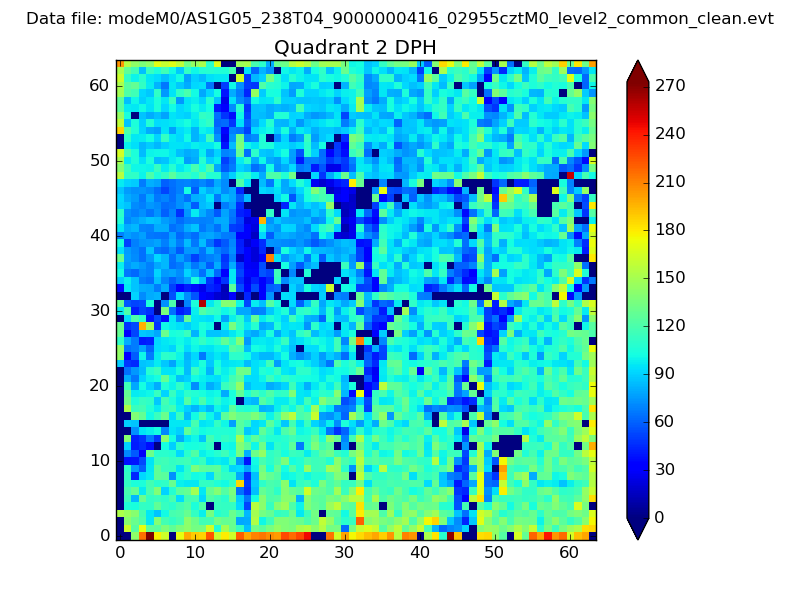 |
Quadrant C |
| Plot type | Count rate plots | Images |
|---|---|---|
| Comparison with Poisson distribution Blue bars denote a histogram of data divided into 1 sec bins. Red curve is a Poisson curve with rate = median count rate of data. |
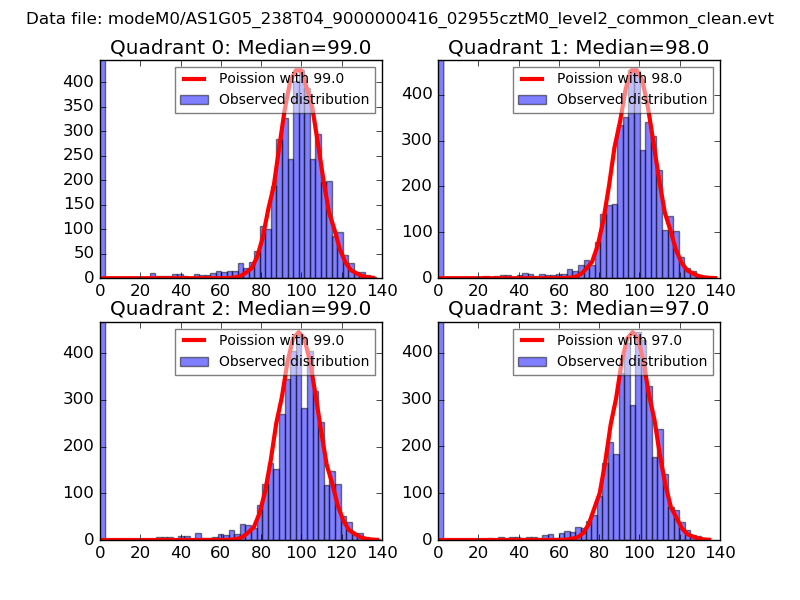 |
 |
| Quadrant-wise count rates Data is divided into 100 sec bins |
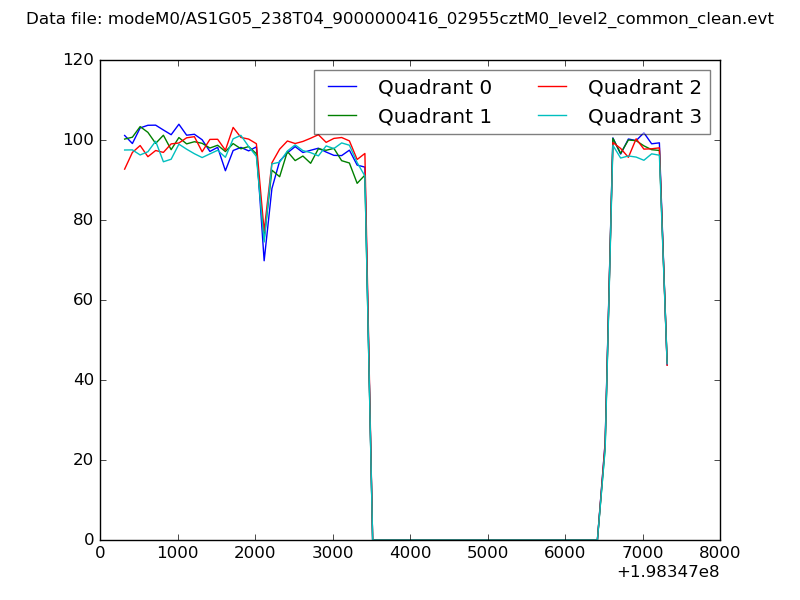 |
|
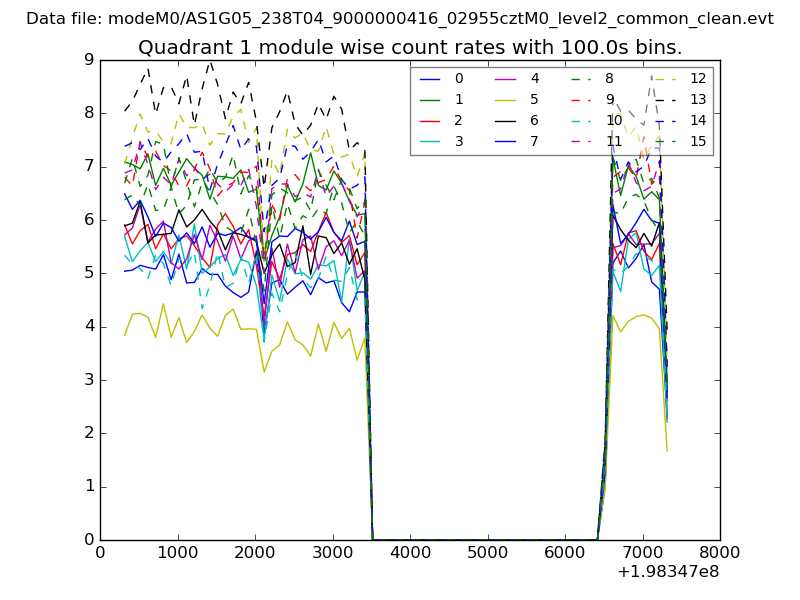
| Module-wise count rates for Quadrant A Data is divided into 100 sec bins |
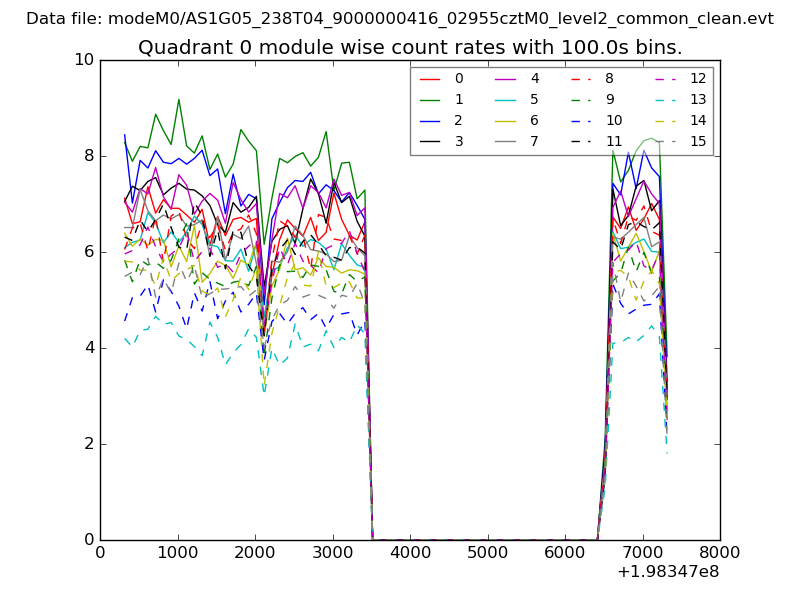 |
 |
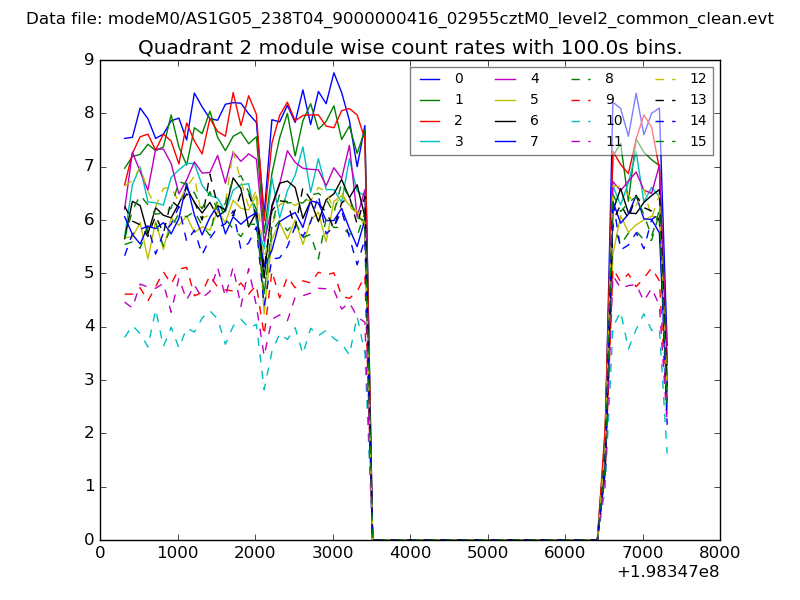
| Module-wise count rates for Quadrant B Data is divided into 100 sec bins |
 |
 |
| Module-wise count rates for Quadrant C Data is divided into 100 sec bins |
 |
 |
| Module-wise count rates for Quadrant D Data is divided into 100 sec bins |
 |
 |
| Parameter | Plot |
|---|---|
| CZT HV Monitor | 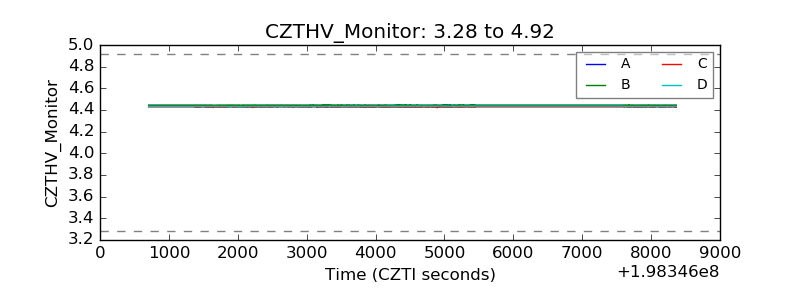 |
| D_VDD | 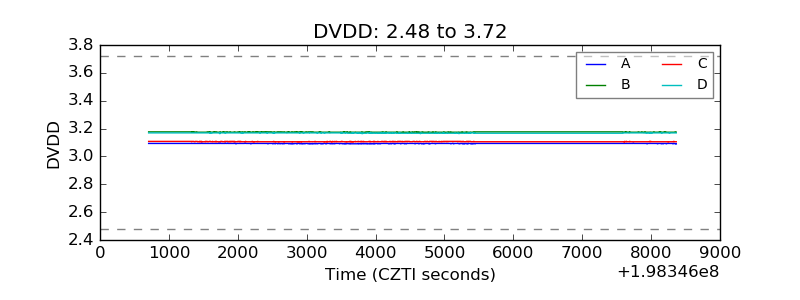 |
| Temperature 1 | 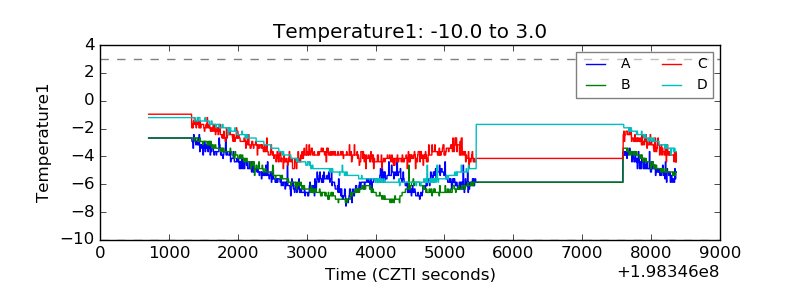 |
| Veto HV Monitor | 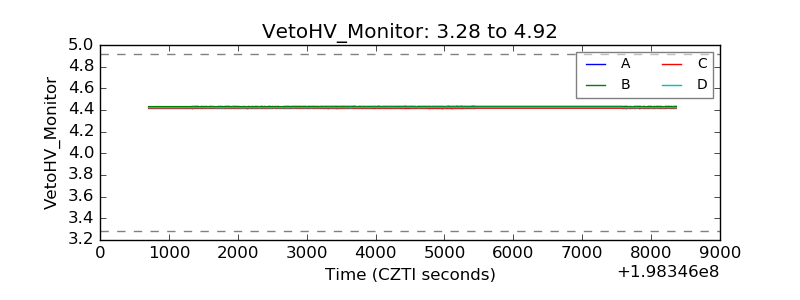 |
| Veto LLD | 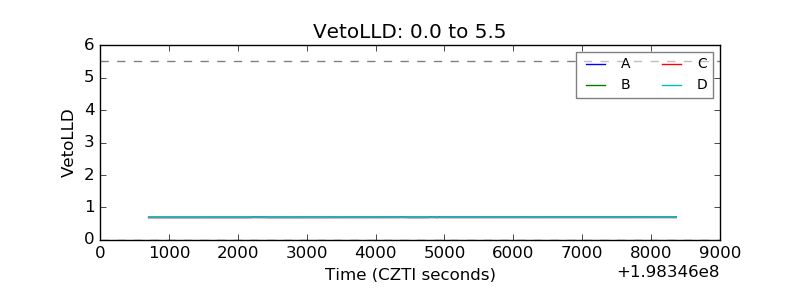 |
| Alpha Counter | 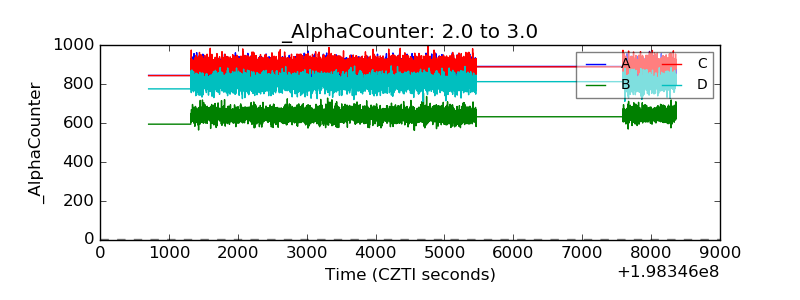 |
| _CPM_Rate | 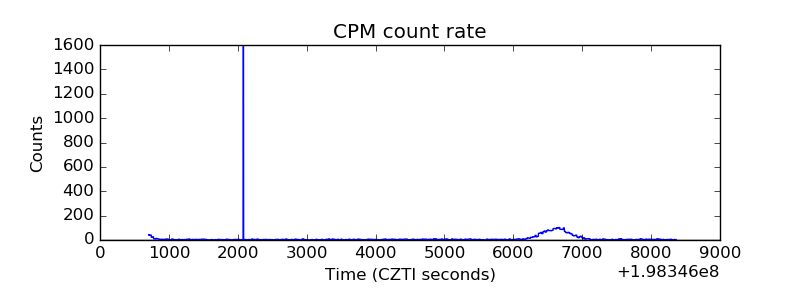 |
| CZT Counter | 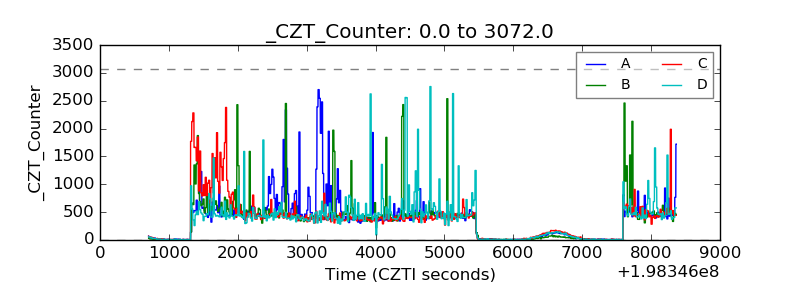 |
| +2.5 Volts monitor |  |
| +5 Volts monitor |  |
| Veto Counter | 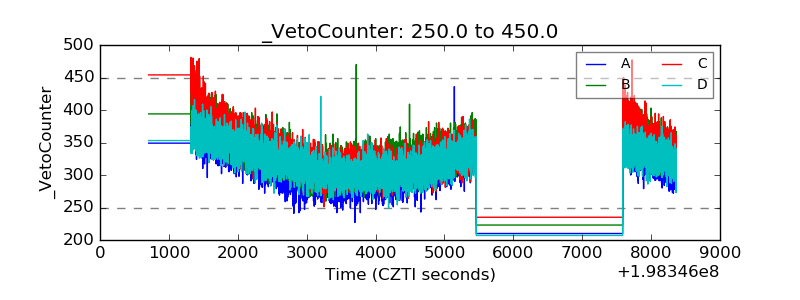 |