| Param | Original file | Final file |
|---|---|---|
| Filename | modeM0/AS1G05_238T04_9000000416_02956cztM0_level2.evt | modeM0/AS1G05_238T04_9000000416_02956cztM0_level2_common_clean.evt |
| Size (bytes) | 308,344,320 | 51,321,600 |
| Size | 294.1 MB | 48.9 MB |
| Events in quadrant A | 2,019,979 | 306,634 |
| Events in quadrant B | 2,252,924 | 304,818 |
| Events in quadrant C | 2,071,062 | 312,036 |
| Events in quadrant D | 2,676,397 | 304,235 |
| Mode M0 | |||
|---|---|---|---|
| Quadrant | BADHDUFLAG | Total packets | Discarded packets |
| A | 0 | 9791 | 116 |
| B | 0 | 10266 | 107 |
| C | 0 | 9773 | 111 |
| D | 0 | 11540 | 114 |
| Mode SS | |||
|---|---|---|---|
| Quadrant | BADHDUFLAG | Total packets | Discarded packets |
| A | 0 | 96 | 0 |
| B | 0 | 96 | 0 |
| C | 0 | 96 | 0 |
| D | 0 | 96 | 0 |
| Mode M9 | |||
|---|---|---|---|
| Quadrant | BADHDUFLAG | Total packets | Discarded packets |
| A | 0 | 21 | 0 |
| B | 0 | 21 | 0 |
| C | 0 | 22 | 1 |
| D | 0 | 21 | 0 |
| Quadrant | Total seconds | Saturated seconds | Saturation percentage |
|---|---|---|---|
| A | 4655 | 21 | 0.451128% |
| B | 4653 | 73 | 1.568880% |
| C | 4651 | 7 | 0.150505% |
| D | 4652 | 146 | 3.138435% |
Noise dominated data is calculated using 1-second bins in cleaned event files. If a bin has >2000 counts, and if more than 50% of those come from <1% of pixels, then it is considered to be noise-dominated and hence unusable.
| Quadrant | # 1 sec bins | Bins with >0 counts | Bins with >2000 counts | High rate bins dominated by noise | Noise dominated (total time) | Noise dominated (detector-on time) | Marked lightcurve |
|---|---|---|---|---|---|---|---|
| A | 6782 | 4657 | 14 | 14 | 0.21% | 0.30% | 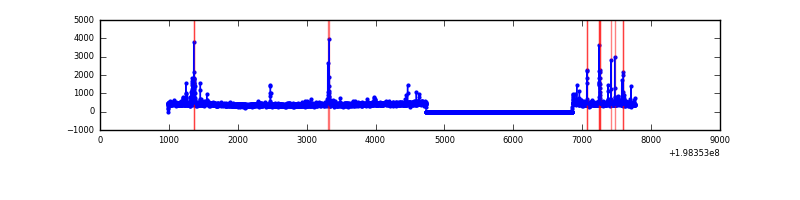 |
| B | 6781 | 4656 | 63 | 63 | 0.93% | 1.35% | 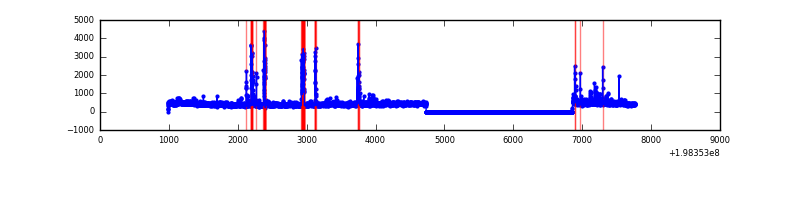 |
| C | 6777 | 4653 | 5 | 5 | 0.07% | 0.11% | 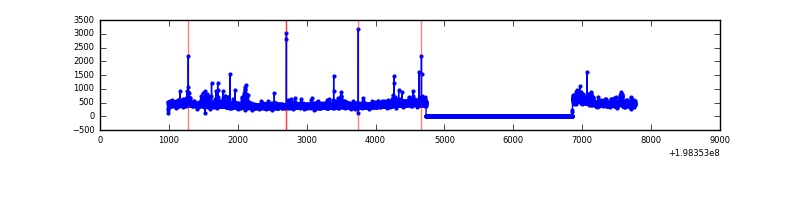 |
| D | 6779 | 4655 | 112 | 112 | 1.65% | 2.41% | 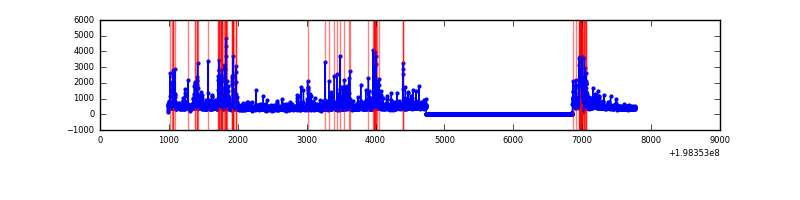 |
Top three noisy pixels from each quadrant. If the there are fewer than three noisy pixels in the level2.evt file, extra rows are filled as -1
| Pixel properties | Quadrant properties | ||||||
|---|---|---|---|---|---|---|---|
| Quadrant | DetID | PixID | Counts | Sigma | Mean | Median | Sigma |
| A | 0 | 50 | 72827 | 748.31 | 470 | 459 | 96.7 |
| A | 14 | 249 | 61512 | 631.31 | 470 | 459 | 96.7 |
| A | 0 | 31 | 27829 | 283.01 | 470 | 459 | 96.7 |
| B | 2 | 249 | 233858 | 2515.08 | 480 | 469 | 92.8 |
| B | 6 | 36 | 36329 | 386.44 | 480 | 469 | 92.8 |
| B | 6 | 203 | 32559 | 345.81 | 480 | 469 | 92.8 |
| C | 1 | 192 | 94271 | 837.24 | 470 | 471 | 112.0 |
| C | 6 | 80 | 61010 | 540.36 | 470 | 471 | 112.0 |
| C | 0 | 219 | 22469 | 196.35 | 470 | 471 | 112.0 |
| D | 12 | 1 | 244046 | 2246.83 | 453 | 443 | 108.4 |
| D | 2 | 136 | 185616 | 1707.91 | 453 | 443 | 108.4 |
| D | 15 | 35 | 122410 | 1124.94 | 453 | 443 | 108.4 |
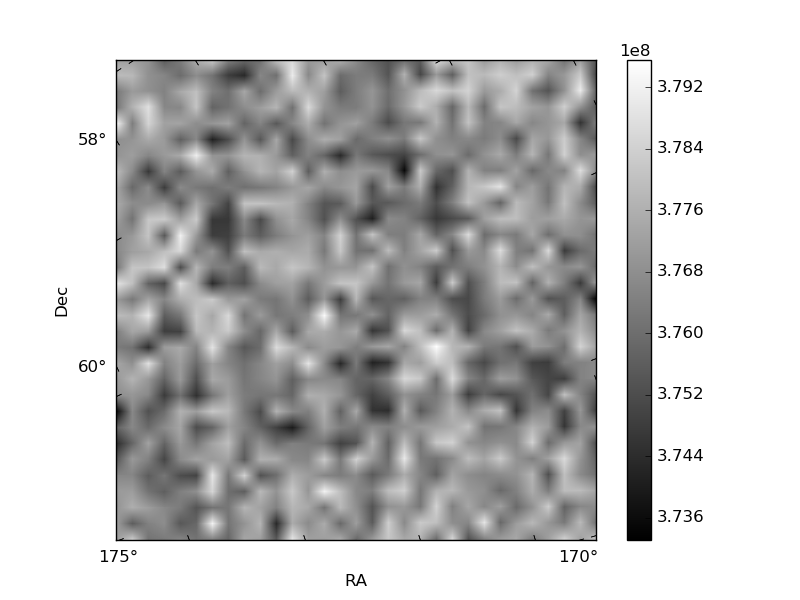
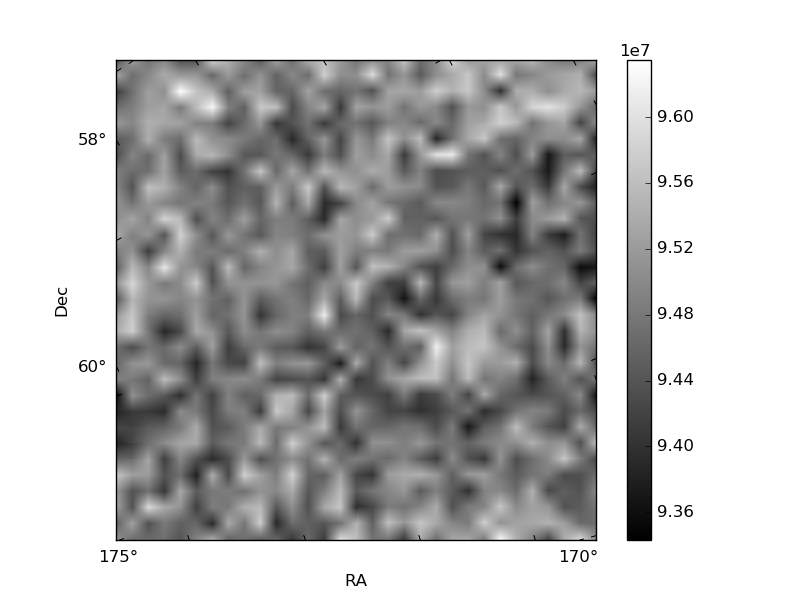
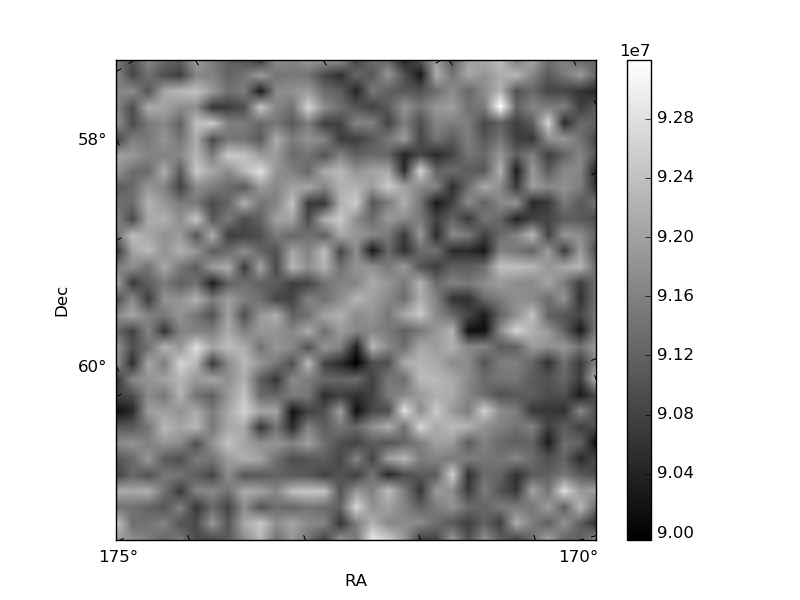
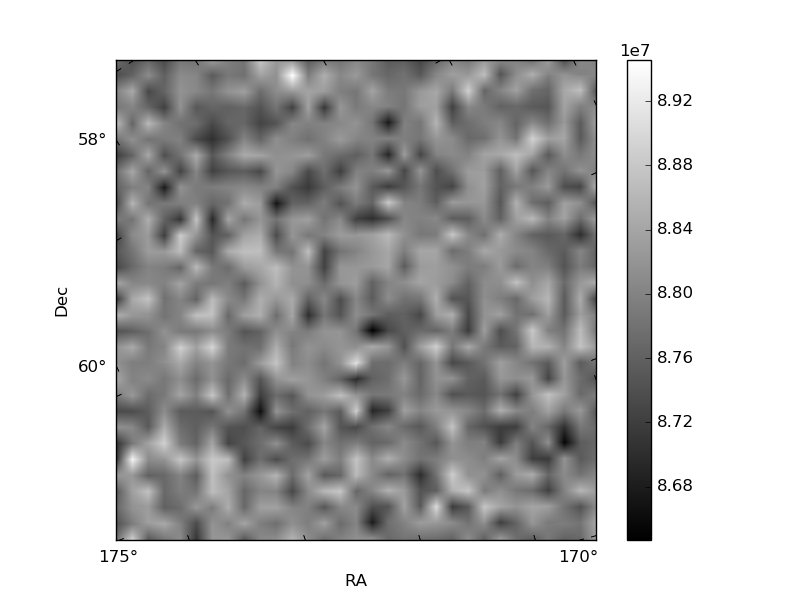
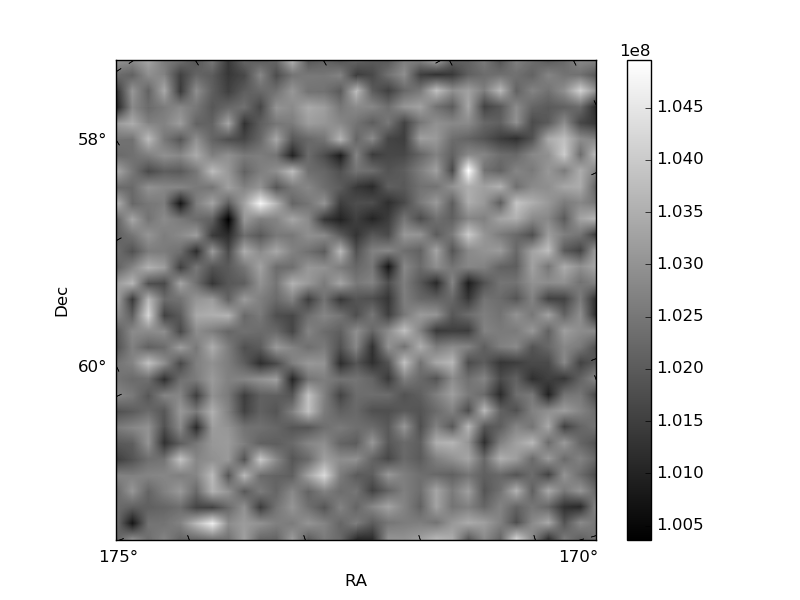
Histogram calculated using DETX and DETY for each event in the final _common_clean file
| Quadrant A | 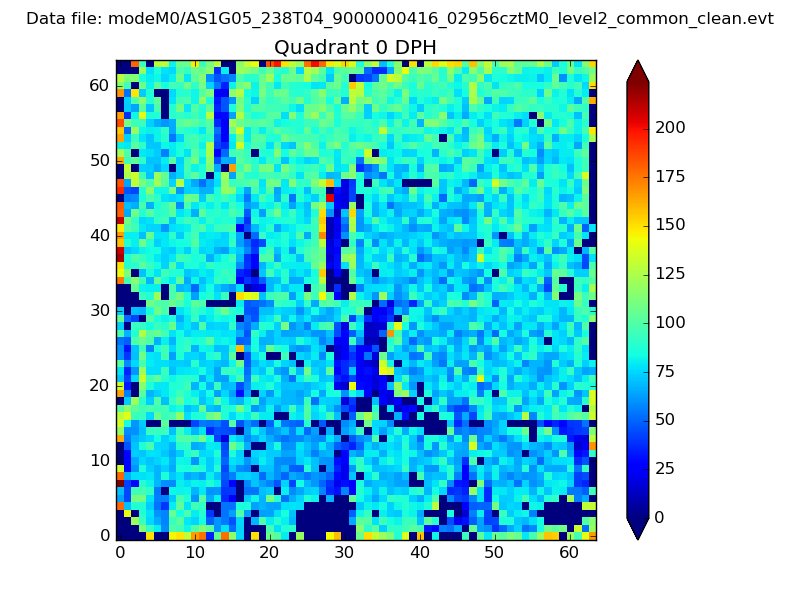 |
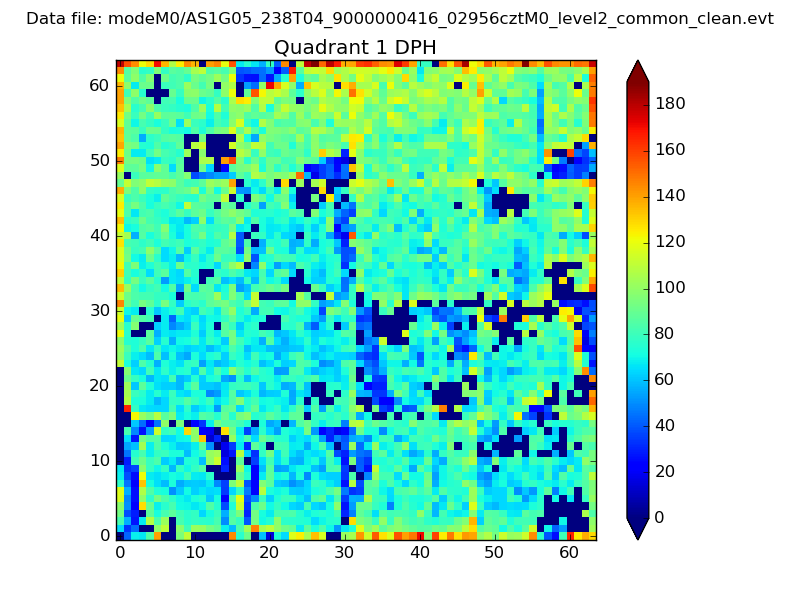 |
Quadrant B |
|---|---|---|---|
| Quadrant D | 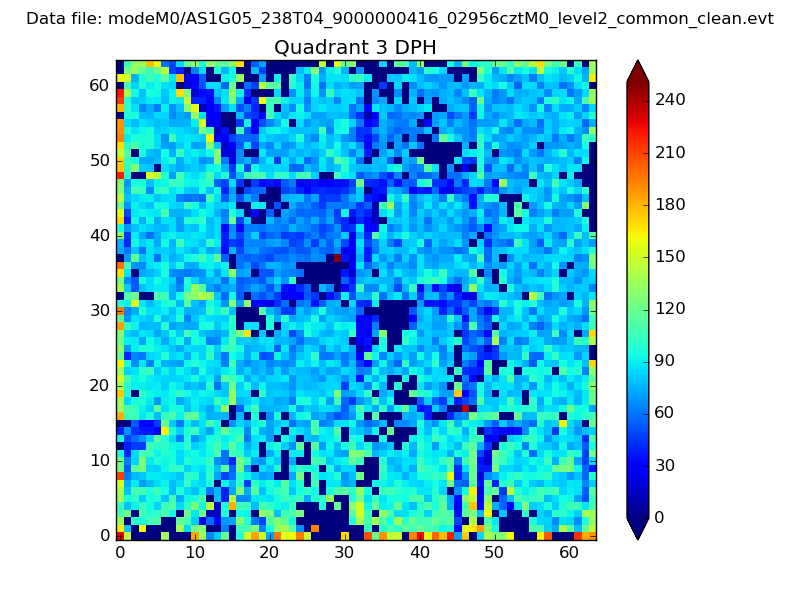 |
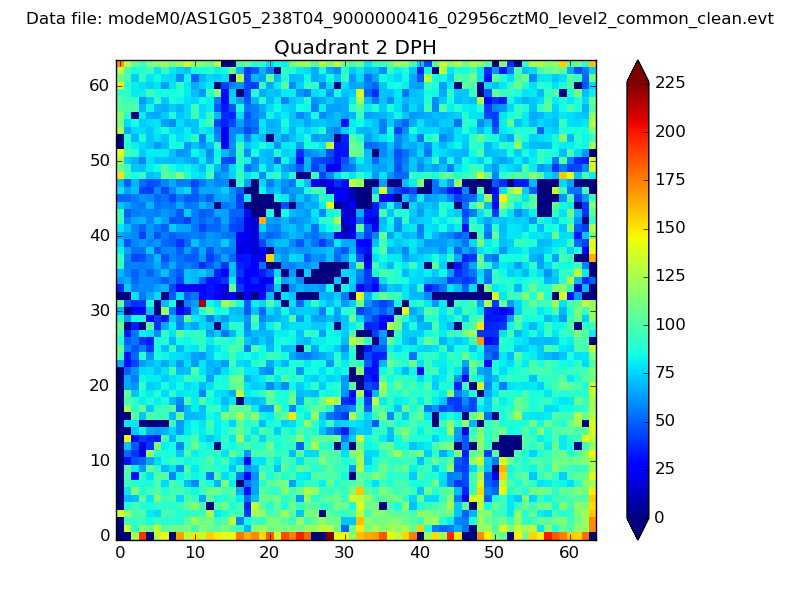 |
Quadrant C |
| Plot type | Count rate plots | Images |
|---|---|---|
| Comparison with Poisson distribution Blue bars denote a histogram of data divided into 1 sec bins. Red curve is a Poisson curve with rate = median count rate of data. |
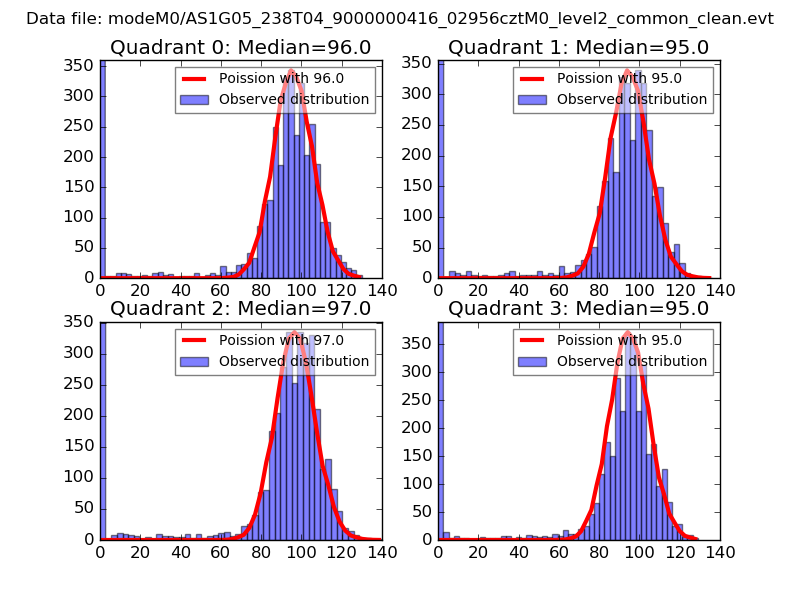 |
 |
| Quadrant-wise count rates Data is divided into 100 sec bins |
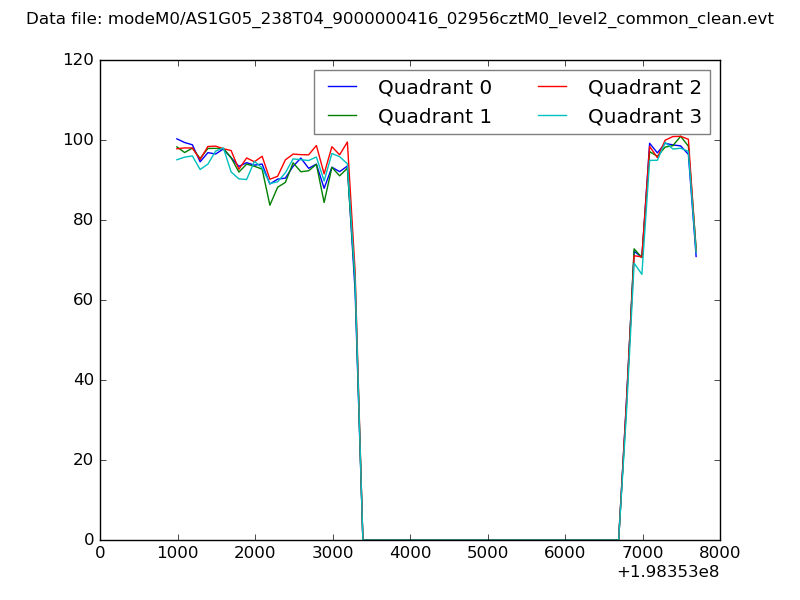 |
|
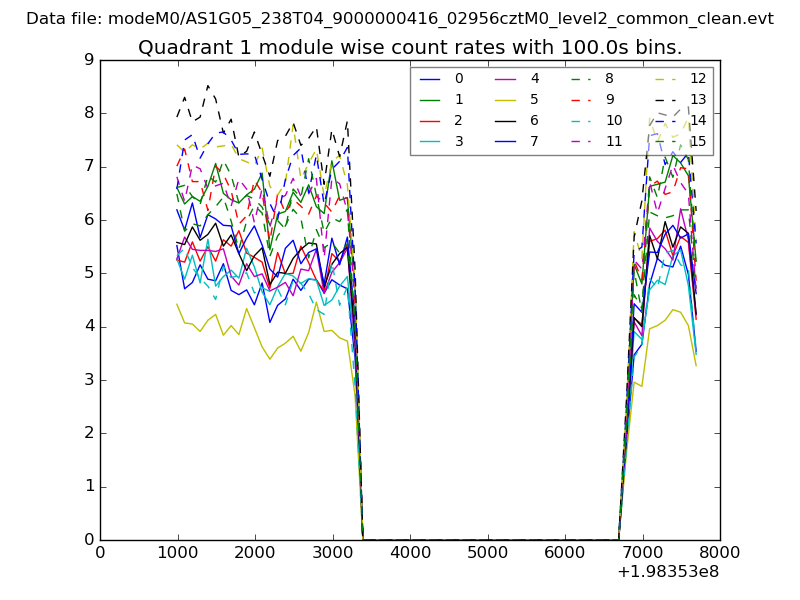
| Module-wise count rates for Quadrant A Data is divided into 100 sec bins |
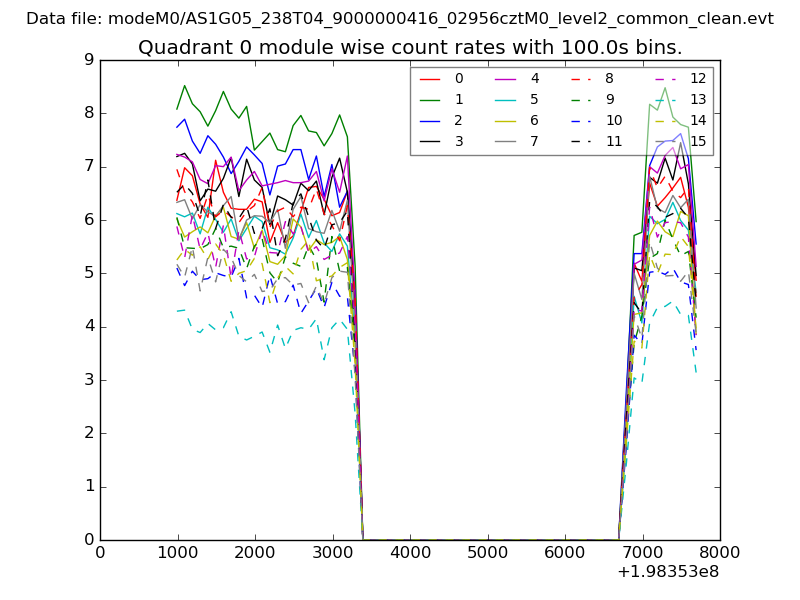 |
 |
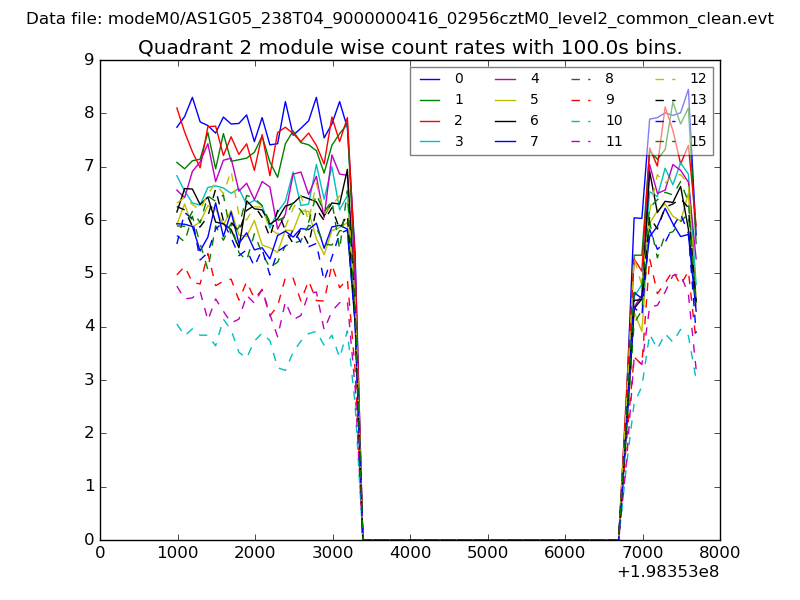
| Module-wise count rates for Quadrant B Data is divided into 100 sec bins |
 |
 |
| Module-wise count rates for Quadrant C Data is divided into 100 sec bins |
 |
 |
| Module-wise count rates for Quadrant D Data is divided into 100 sec bins |
 |
 |
| Parameter | Plot |
|---|---|
| CZT HV Monitor | 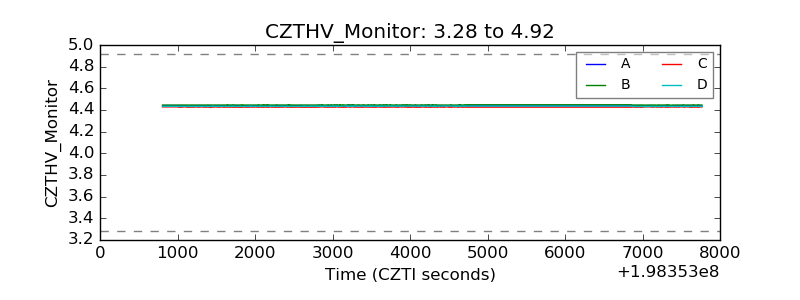 |
| D_VDD | 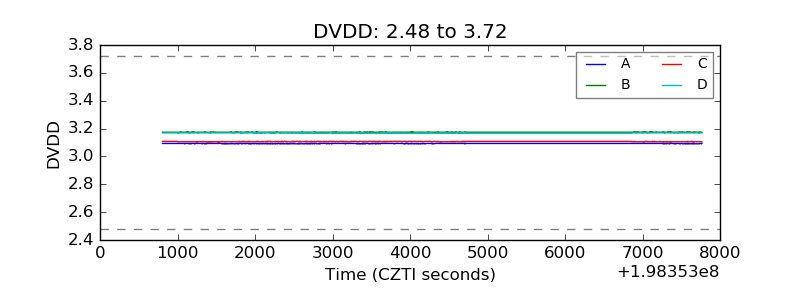 |
| Temperature 1 | 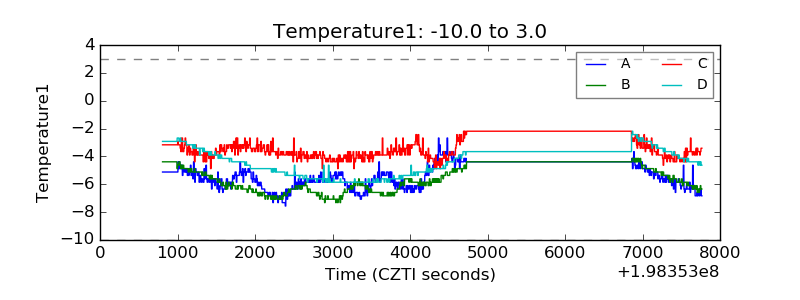 |
| Veto HV Monitor | 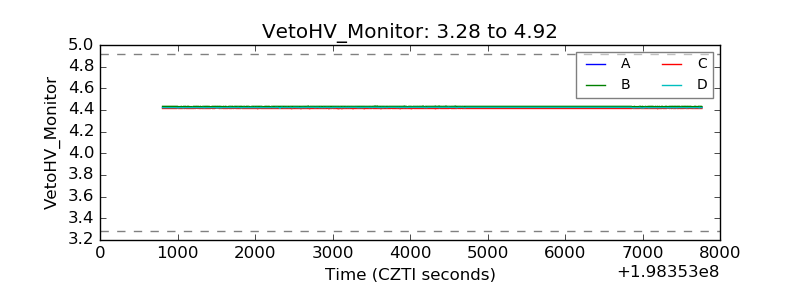 |
| Veto LLD | 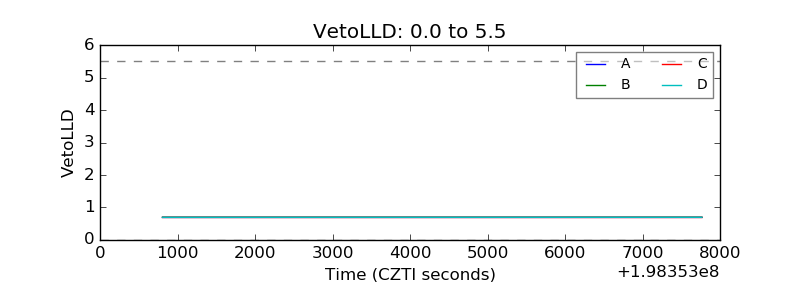 |
| Alpha Counter | 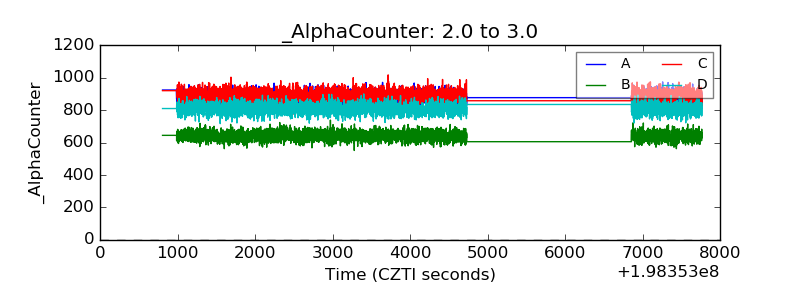 |
| _CPM_Rate | 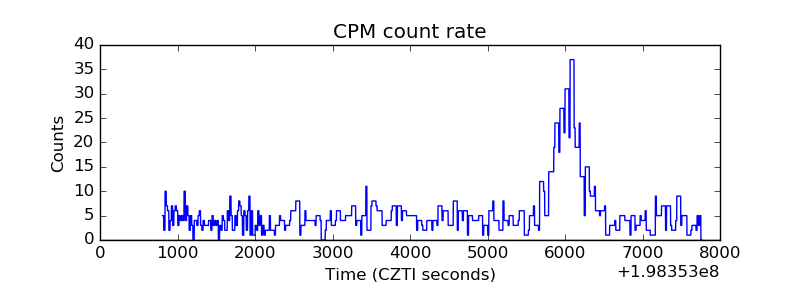 |
| CZT Counter | 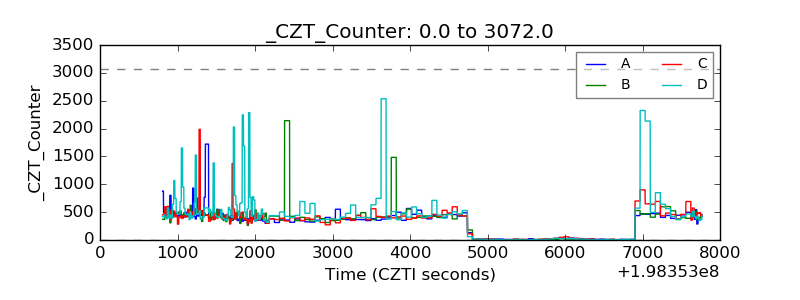 |
| +2.5 Volts monitor |  |
| +5 Volts monitor | 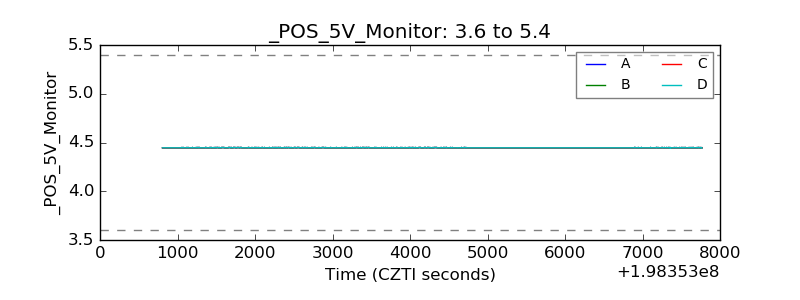 |
| Veto Counter | 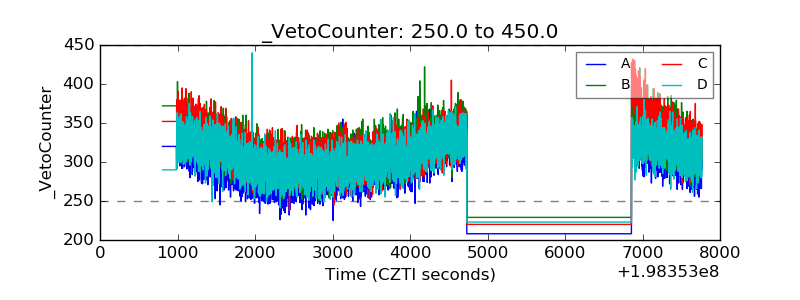 |