| Param | Original file | Final file |
|---|---|---|
| Filename | modeM0/AS1G05_238T04_9000000416_02957cztM0_level2.evt | modeM0/AS1G05_238T04_9000000416_02957cztM0_level2_common_clean.evt |
| Size (bytes) | 352,445,760 | 53,726,400 |
| Size | 336.1 MB | 51.2 MB |
| Events in quadrant A | 2,418,577 | 315,375 |
| Events in quadrant B | 2,622,603 | 313,878 |
| Events in quadrant C | 2,537,112 | 321,611 |
| Events in quadrant D | 2,743,399 | 314,693 |
| Mode M0 | |||
|---|---|---|---|
| Quadrant | BADHDUFLAG | Total packets | Discarded packets |
| A | 0 | 11239 | 3 |
| B | 0 | 11701 | 2 |
| C | 0 | 11390 | 2 |
| D | 0 | 12060 | 2 |
| Mode SS | |||
|---|---|---|---|
| Quadrant | BADHDUFLAG | Total packets | Discarded packets |
| A | 0 | 104 | 0 |
| B | 0 | 104 | 0 |
| C | 0 | 104 | 0 |
| D | 0 | 104 | 0 |
| Mode M9 | |||
|---|---|---|---|
| Quadrant | BADHDUFLAG | Total packets | Discarded packets |
| A | 0 | 36 | 0 |
| B | 0 | 36 | 0 |
| C | 0 | 36 | 0 |
| D | 0 | 37 | 0 |
| Quadrant | Total seconds | Saturated seconds | Saturation percentage |
|---|---|---|---|
| A | 5173 | 39 | 0.753915% |
| B | 5173 | 130 | 2.513049% |
| C | 5173 | 13 | 0.251305% |
| D | 5173 | 122 | 2.358399% |
Noise dominated data is calculated using 1-second bins in cleaned event files. If a bin has >2000 counts, and if more than 50% of those come from <1% of pixels, then it is considered to be noise-dominated and hence unusable.
| Quadrant | # 1 sec bins | Bins with >0 counts | Bins with >2000 counts | High rate bins dominated by noise | Noise dominated (total time) | Noise dominated (detector-on time) | Marked lightcurve |
|---|---|---|---|---|---|---|---|
| A | 7298 | 5174 | 38 | 38 | 0.52% | 0.73% | 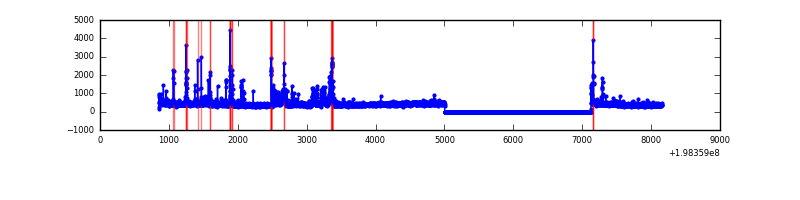 |
| B | 7298 | 5174 | 105 | 105 | 1.44% | 2.03% | 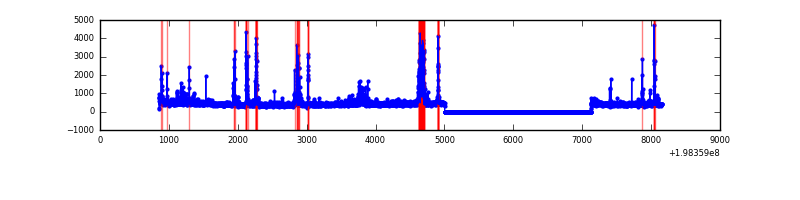 |
| C | 7298 | 5174 | 8 | 8 | 0.11% | 0.15% | 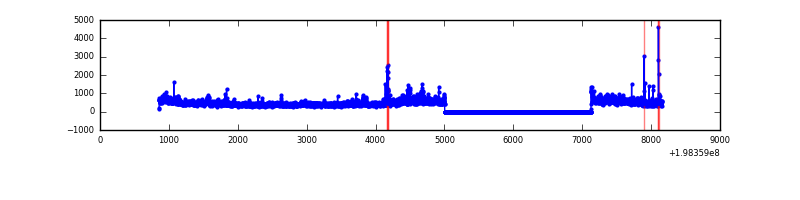 |
| D | 7298 | 5174 | 86 | 86 | 1.18% | 1.66% | 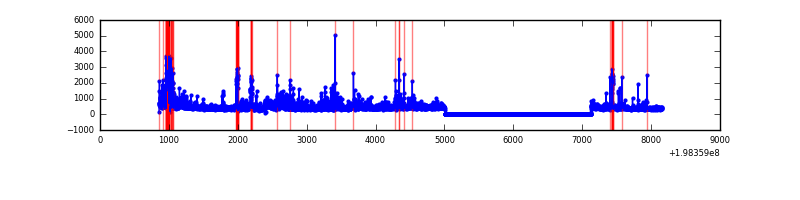 |
Top three noisy pixels from each quadrant. If the there are fewer than three noisy pixels in the level2.evt file, extra rows are filled as -1
| Pixel properties | Quadrant properties | ||||||
|---|---|---|---|---|---|---|---|
| Quadrant | DetID | PixID | Counts | Sigma | Mean | Median | Sigma |
| A | 0 | 31 | 293602 | 2756.17 | 521 | 510 | 106.3 |
| A | 0 | 50 | 54571 | 508.38 | 521 | 510 | 106.3 |
| A | 14 | 249 | 35758 | 331.46 | 521 | 510 | 106.3 |
| B | 2 | 249 | 345400 | 3347.2 | 530 | 518 | 103.0 |
| B | 3 | 27 | 56070 | 539.15 | 530 | 518 | 103.0 |
| B | 5 | 70 | 35930 | 343.69 | 530 | 518 | 103.0 |
| C | 1 | 192 | 341894 | 2776.0 | 519 | 520 | 123.0 |
| C | 6 | 80 | 70565 | 569.59 | 519 | 520 | 123.0 |
| C | 0 | 219 | 25400 | 202.32 | 519 | 520 | 123.0 |
| D | 2 | 136 | 198974 | 1637.4 | 503 | 490 | 121.2 |
| D | 14 | 81 | 103531 | 850.04 | 503 | 490 | 121.2 |
| D | 2 | 209 | 82763 | 678.71 | 503 | 490 | 121.2 |
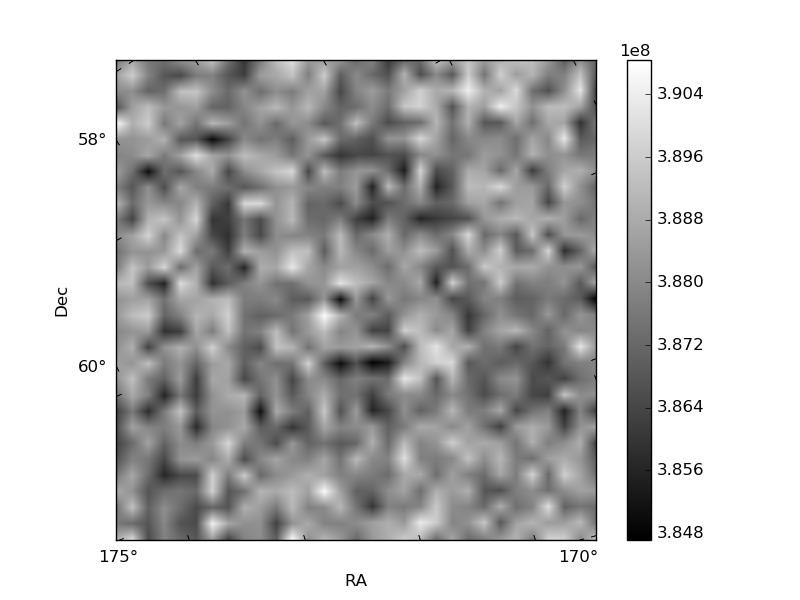
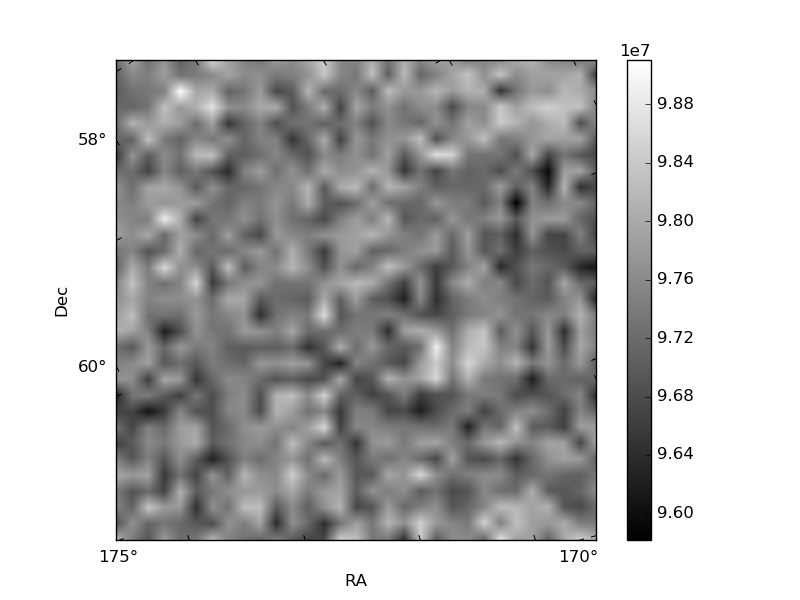
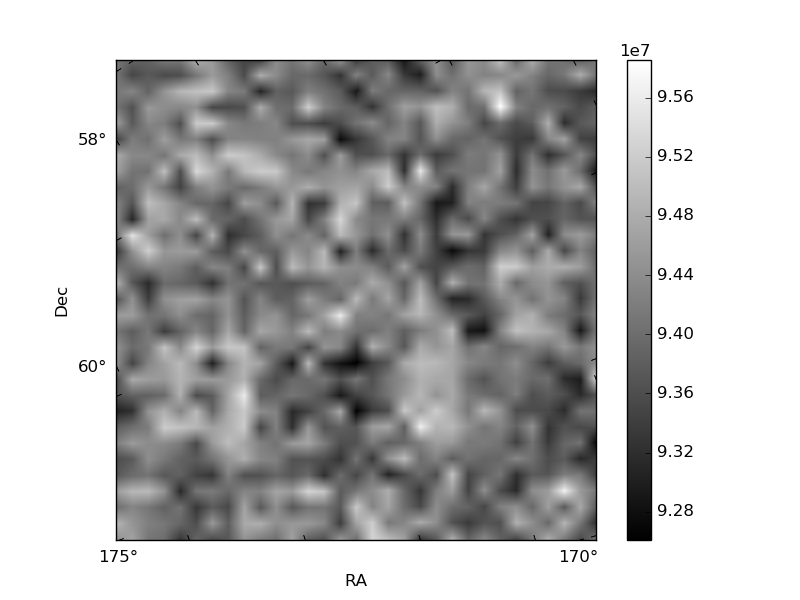
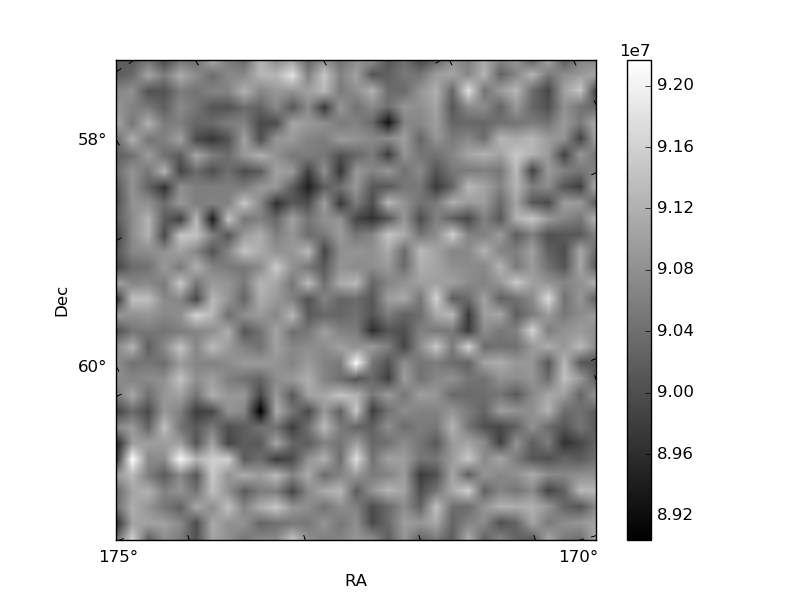
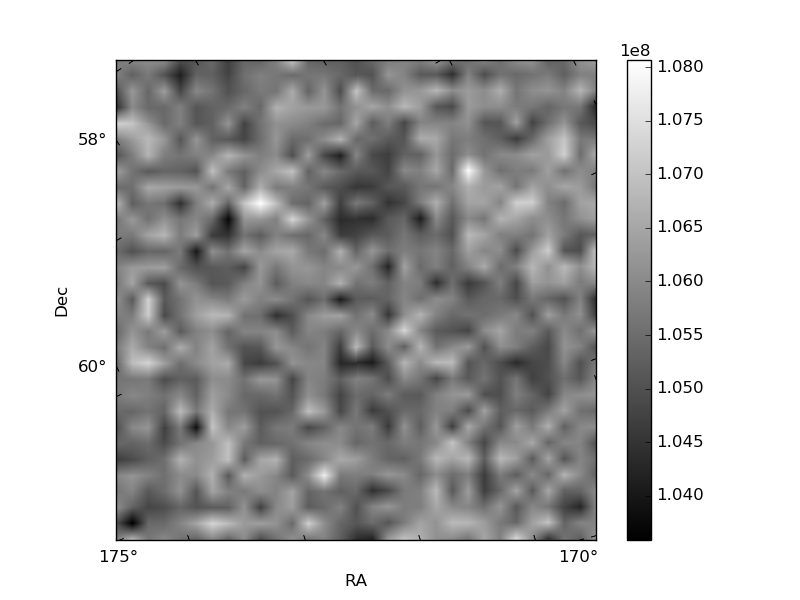
Histogram calculated using DETX and DETY for each event in the final _common_clean file
| Quadrant A | 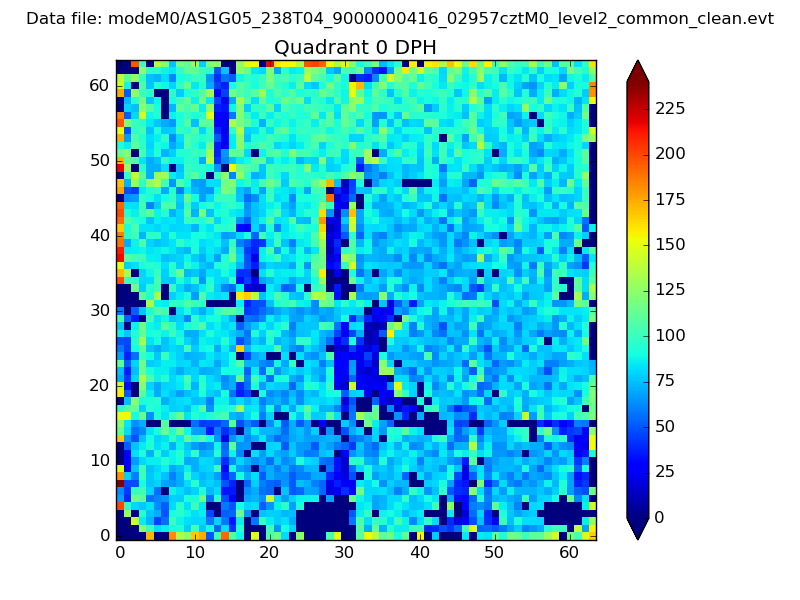 |
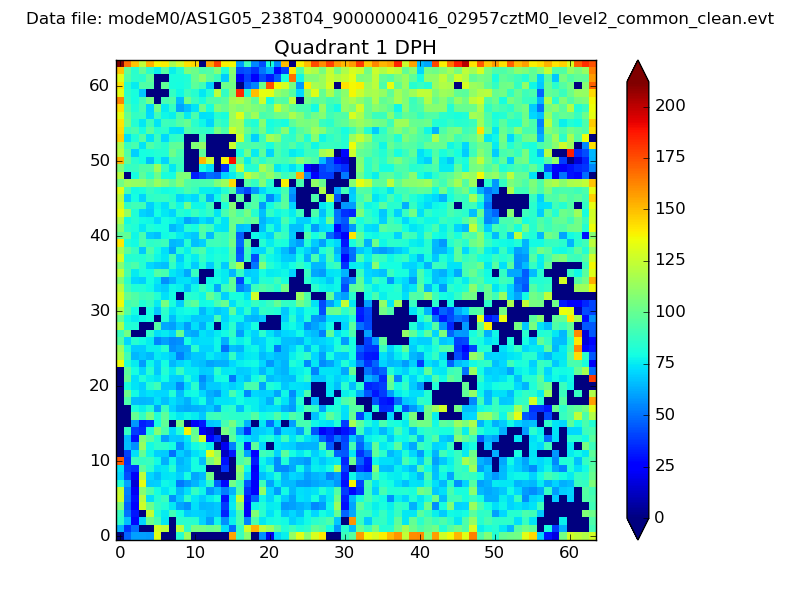 |
Quadrant B |
|---|---|---|---|
| Quadrant D | 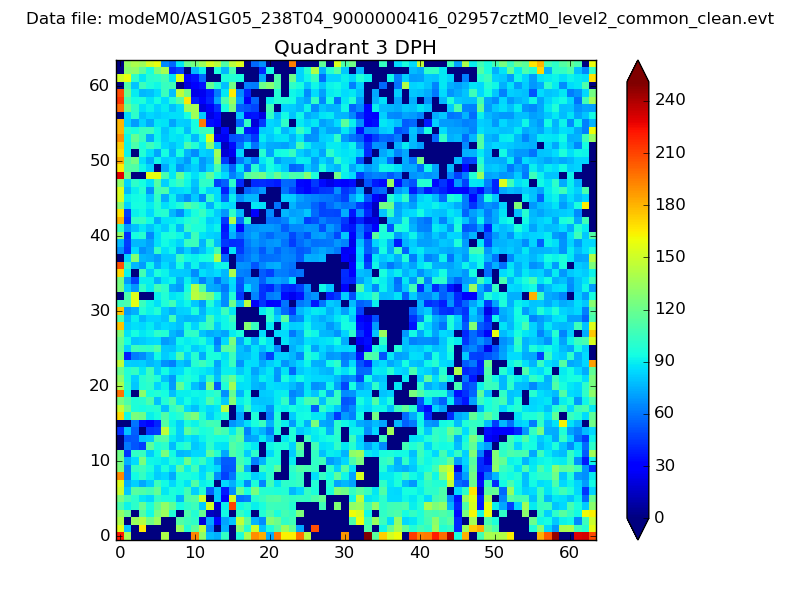 |
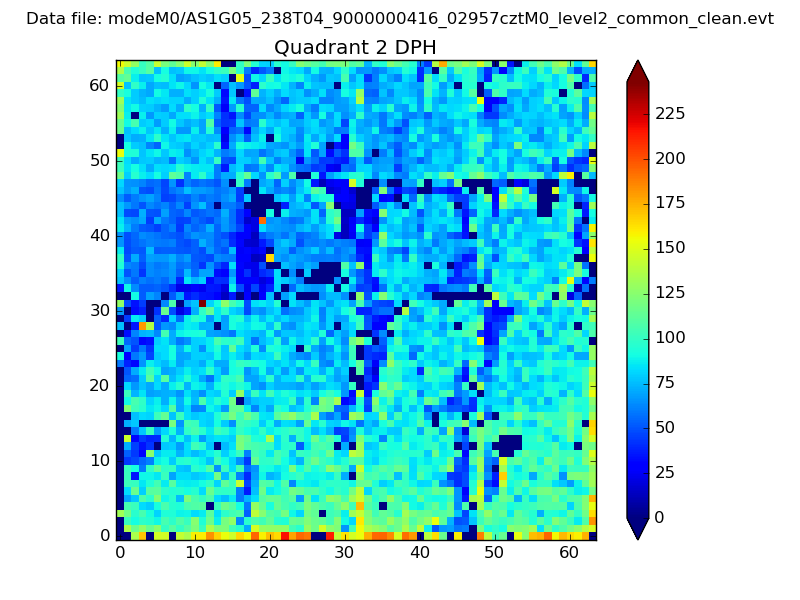 |
Quadrant C |
| Plot type | Count rate plots | Images |
|---|---|---|
| Comparison with Poisson distribution Blue bars denote a histogram of data divided into 1 sec bins. Red curve is a Poisson curve with rate = median count rate of data. |
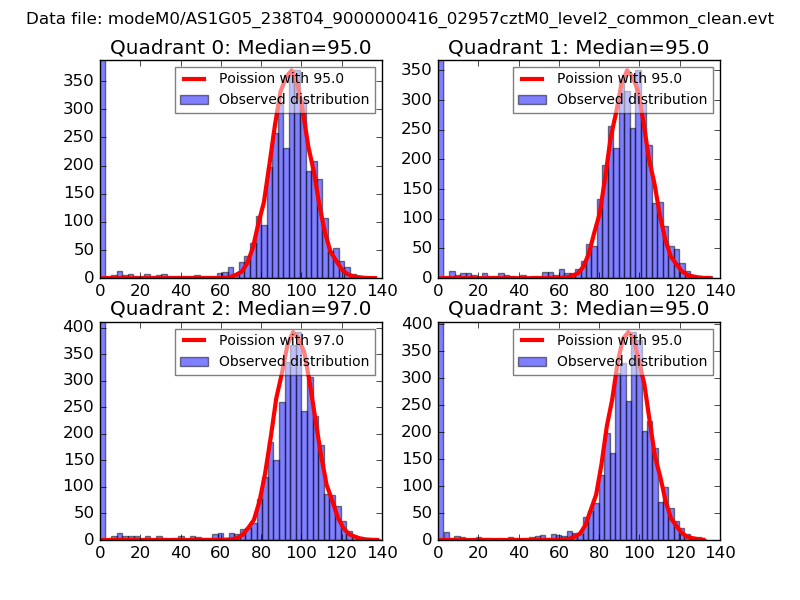 |
 |
| Quadrant-wise count rates Data is divided into 100 sec bins |
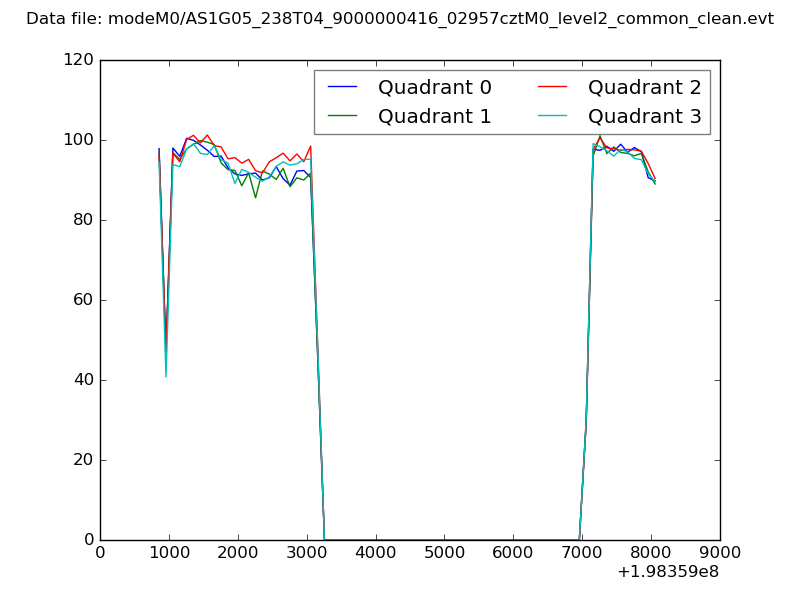 |
|
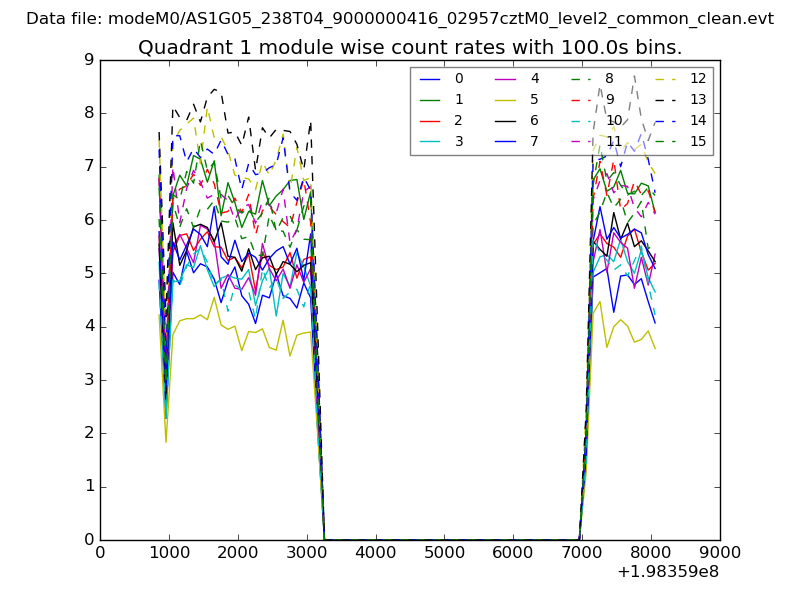
| Module-wise count rates for Quadrant A Data is divided into 100 sec bins |
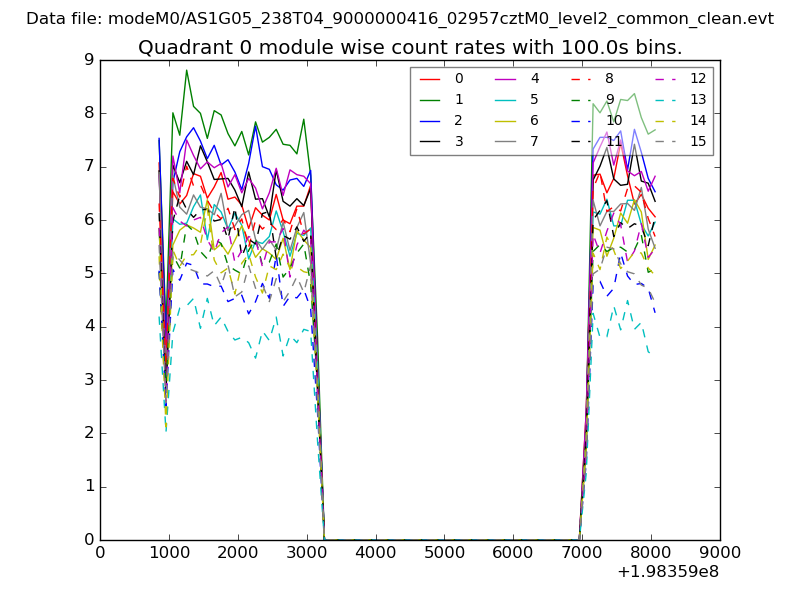 |
 |
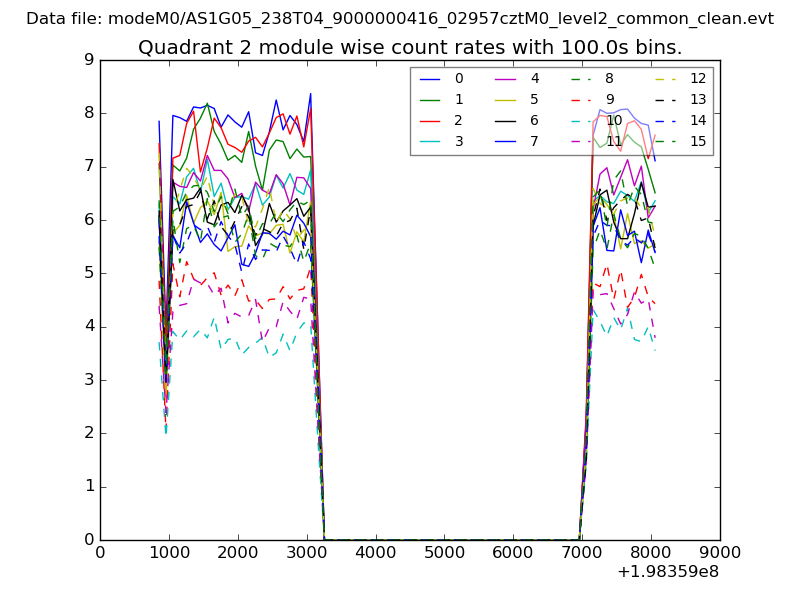
| Module-wise count rates for Quadrant B Data is divided into 100 sec bins |
 |
 |
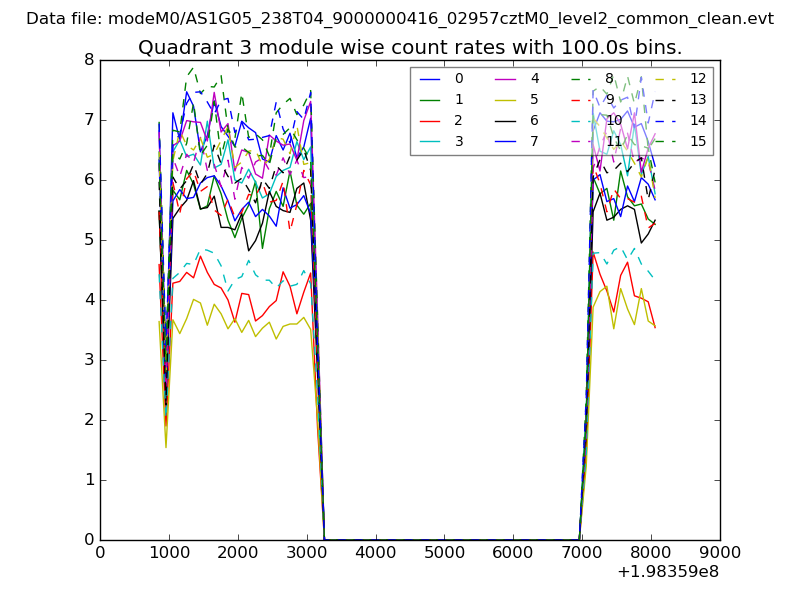
| Module-wise count rates for Quadrant C Data is divided into 100 sec bins |
 |
 |
| Module-wise count rates for Quadrant D Data is divided into 100 sec bins |
 |
 |
| Parameter | Plot |
|---|---|
| CZT HV Monitor | 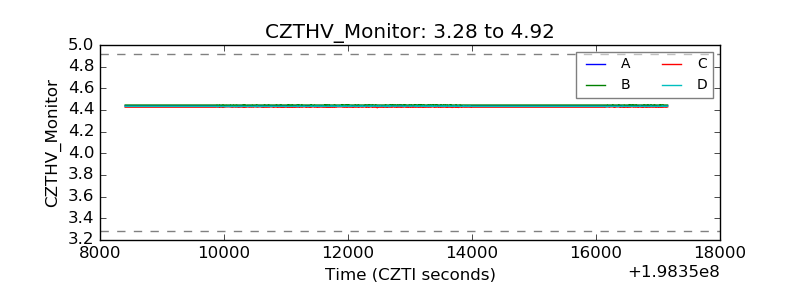 |
| D_VDD |  |
| Temperature 1 | 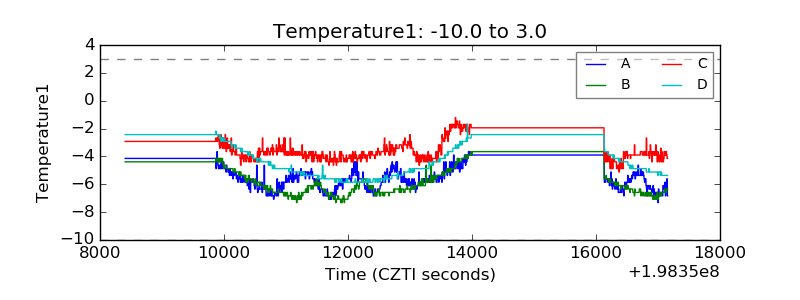 |
| Veto HV Monitor | 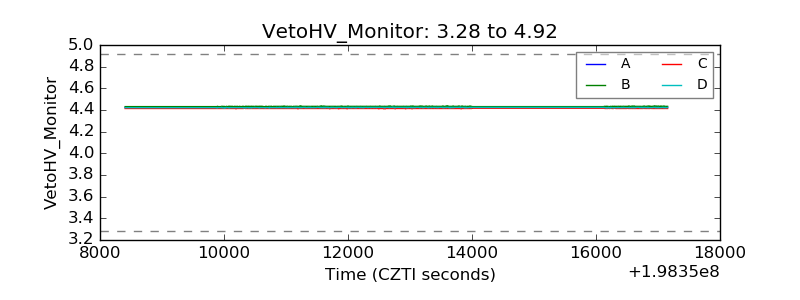 |
| Veto LLD | 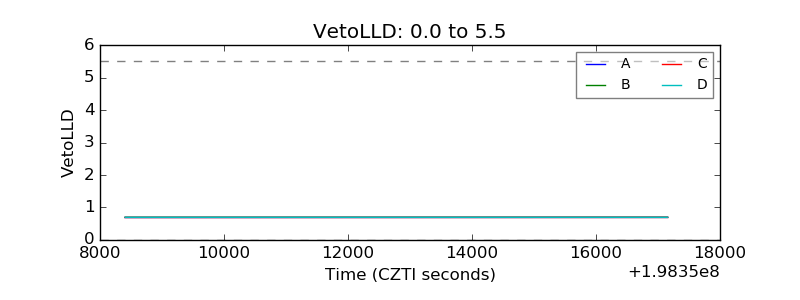 |
| Alpha Counter | 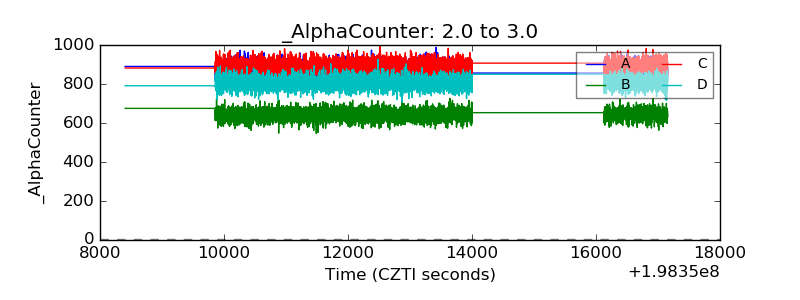 |
| _CPM_Rate | 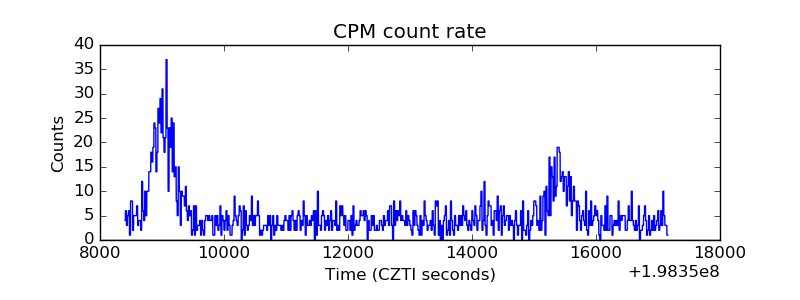 |
| CZT Counter | 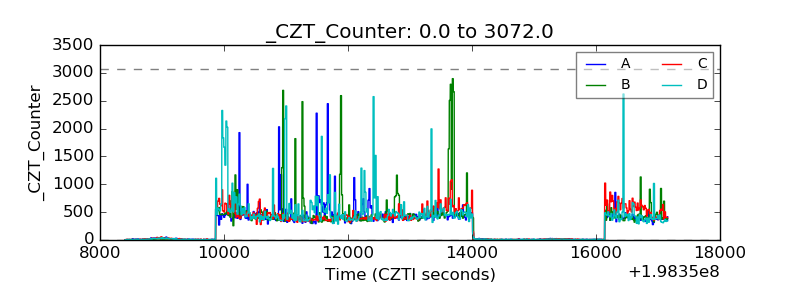 |
| +2.5 Volts monitor |  |
| +5 Volts monitor |  |
| Veto Counter | 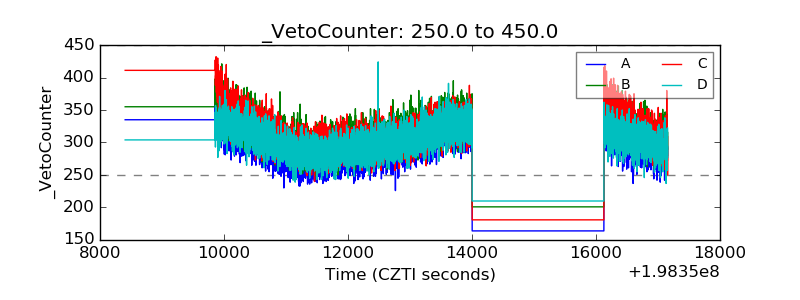 |