| Param | Original file | Final file |
|---|---|---|
| Filename | modeM0/AS1G05_238T04_9000000416_02958cztM0_level2.evt | modeM0/AS1G05_238T04_9000000416_02958cztM0_level2_common_clean.evt |
| Size (bytes) | 412,920,000 | 52,571,520 |
| Size | 393.8 MB | 50.1 MB |
| Events in quadrant A | 2,305,969 | 307,857 |
| Events in quadrant B | 2,365,238 | 307,098 |
| Events in quadrant C | 5,078,909 | 307,478 |
| Events in quadrant D | 2,402,597 | 307,008 |
| Mode M0 | |||
|---|---|---|---|
| Quadrant | BADHDUFLAG | Total packets | Discarded packets |
| A | 0 | 10882 | 3 |
| B | 0 | 11043 | 2 |
| C | 0 | 18784 | 2 |
| D | 0 | 11173 | 2 |
| Mode SS | |||
|---|---|---|---|
| Quadrant | BADHDUFLAG | Total packets | Discarded packets |
| A | 0 | 106 | 0 |
| B | 0 | 106 | 0 |
| C | 0 | 106 | 0 |
| D | 0 | 106 | 0 |
| Mode M9 | |||
|---|---|---|---|
| Quadrant | BADHDUFLAG | Total packets | Discarded packets |
| A | 0 | 39 | 0 |
| B | 0 | 39 | 0 |
| C | 0 | 39 | 0 |
| D | 0 | 40 | 0 |
| Quadrant | Total seconds | Saturated seconds | Saturation percentage |
|---|---|---|---|
| A | 5184 | 29 | 0.559414% |
| B | 5184 | 69 | 1.331019% |
| C | 5184 | 614 | 11.844136% |
| D | 5184 | 28 | 0.540123% |
Noise dominated data is calculated using 1-second bins in cleaned event files. If a bin has >2000 counts, and if more than 50% of those come from <1% of pixels, then it is considered to be noise-dominated and hence unusable.
| Quadrant | # 1 sec bins | Bins with >0 counts | Bins with >2000 counts | High rate bins dominated by noise | Noise dominated (total time) | Noise dominated (detector-on time) | Marked lightcurve |
|---|---|---|---|---|---|---|---|
| A | 7310 | 5185 | 18 | 18 | 0.25% | 0.35% | 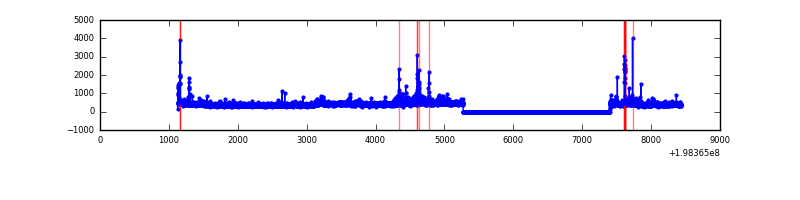 |
| B | 7310 | 5185 | 49 | 49 | 0.67% | 0.95% | 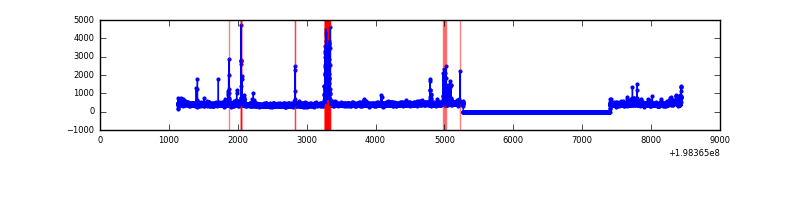 |
| C | 7310 | 5185 | 597 | 597 | 8.17% | 11.51% | 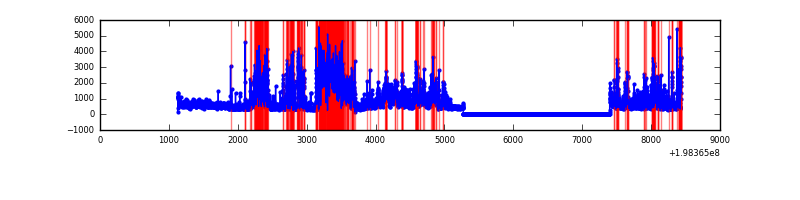 |
| D | 7310 | 5185 | 23 | 23 | 0.31% | 0.44% | 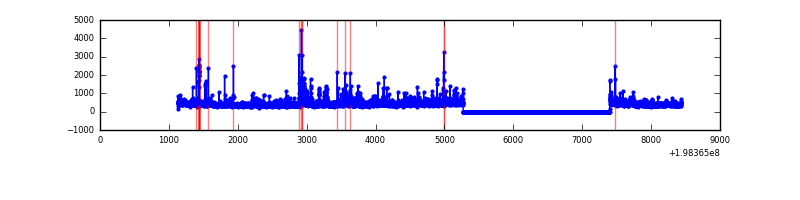 |
Top three noisy pixels from each quadrant. If the there are fewer than three noisy pixels in the level2.evt file, extra rows are filled as -1
| Pixel properties | Quadrant properties | ||||||
|---|---|---|---|---|---|---|---|
| Quadrant | DetID | PixID | Counts | Sigma | Mean | Median | Sigma |
| A | 0 | 31 | 101795 | 948.44 | 521 | 509 | 106.8 |
| A | 8 | 15 | 44175 | 408.89 | 521 | 509 | 106.8 |
| A | 14 | 249 | 39097 | 361.34 | 521 | 509 | 106.8 |
| B | 2 | 249 | 179601 | 1726.54 | 532 | 520 | 103.7 |
| B | 3 | 27 | 48690 | 464.41 | 532 | 520 | 103.7 |
| B | 4 | 170 | 31119 | 295.01 | 532 | 520 | 103.7 |
| C | 1 | 192 | 2955975 | 25739.19 | 487 | 488 | 114.8 |
| C | 8 | 161 | 70976 | 613.88 | 487 | 488 | 114.8 |
| C | 6 | 80 | 59131 | 510.72 | 487 | 488 | 114.8 |
| D | 1 | 31 | 85540 | 669.18 | 506 | 492 | 127.1 |
| D | 13 | 239 | 63007 | 491.88 | 506 | 492 | 127.1 |
| D | 14 | 81 | 39912 | 310.16 | 506 | 492 | 127.1 |
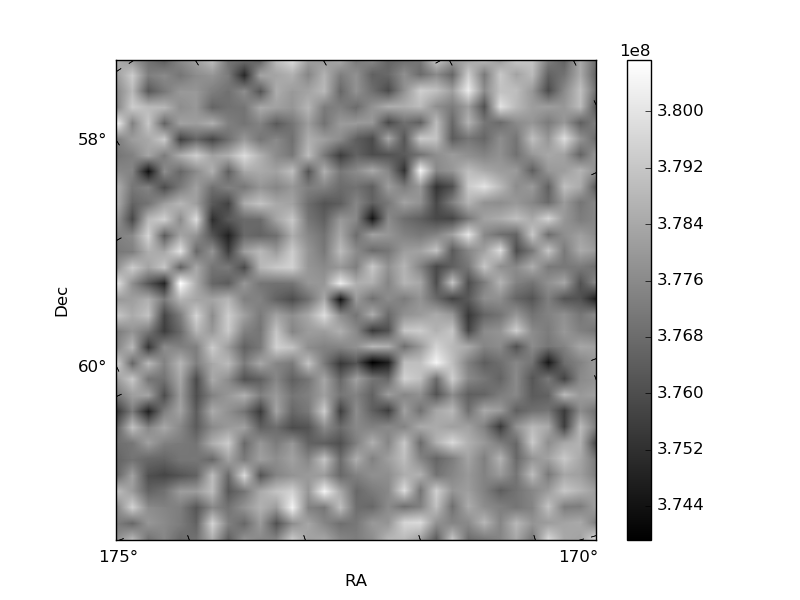
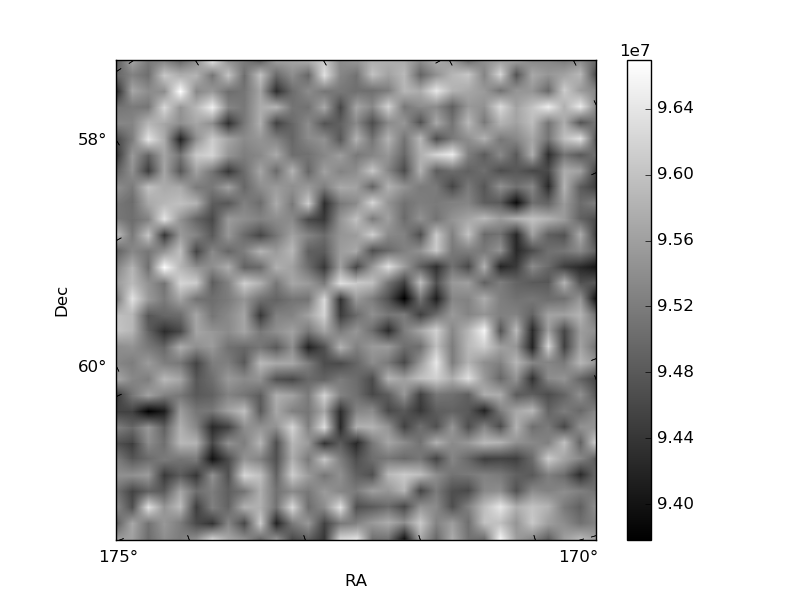
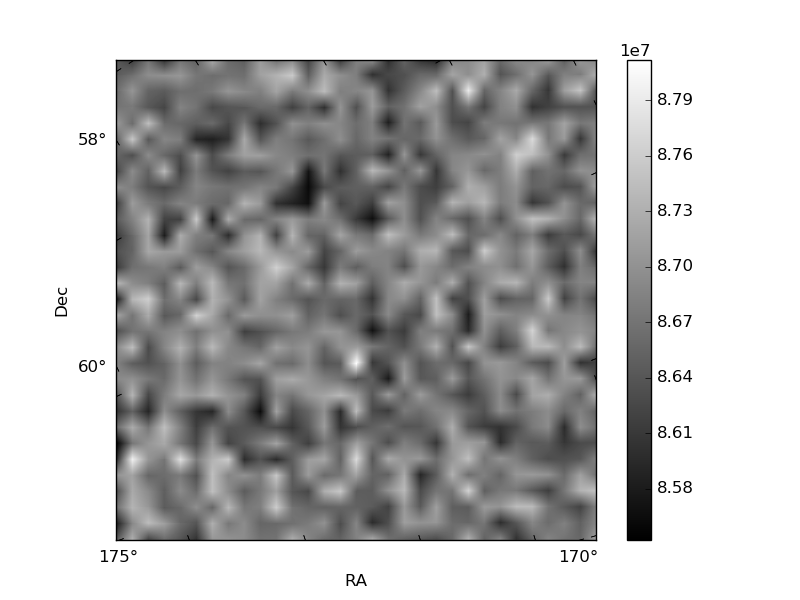
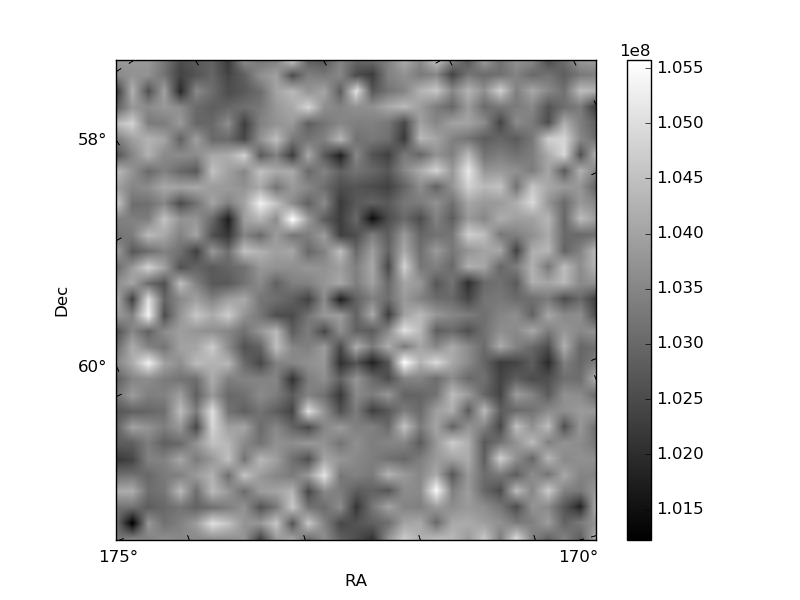
Histogram calculated using DETX and DETY for each event in the final _common_clean file
| Quadrant A | 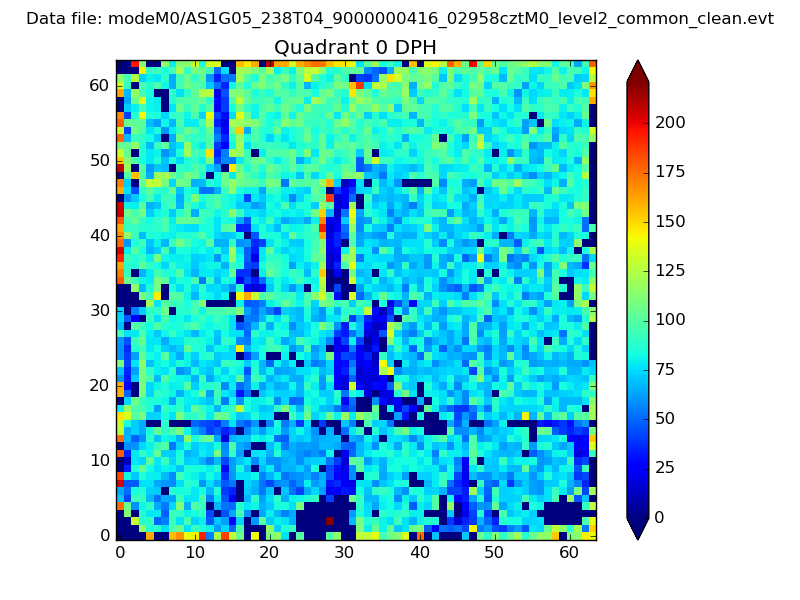 |
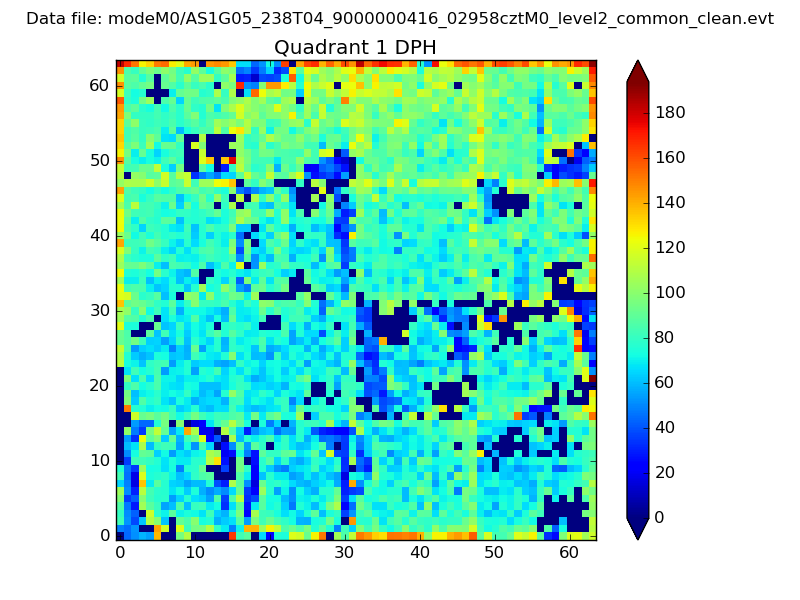 |
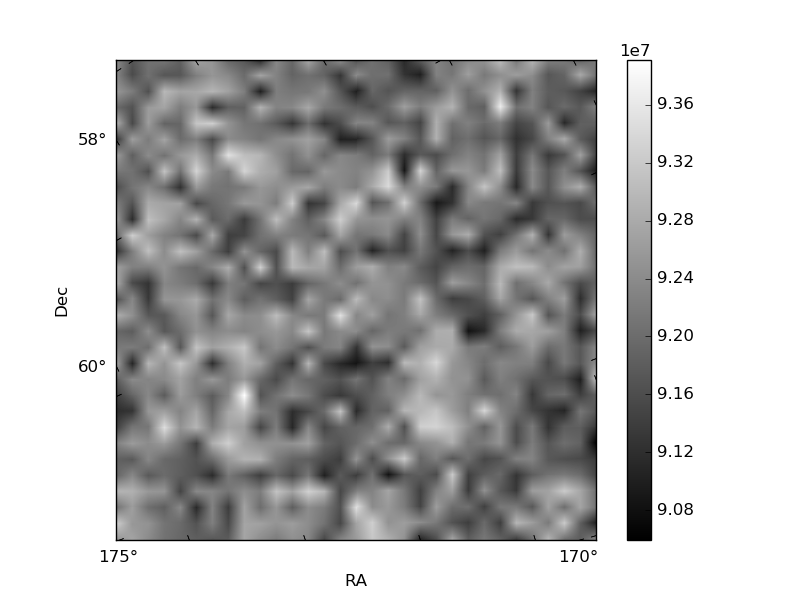
Quadrant B |
|---|---|---|---|
| Quadrant D | 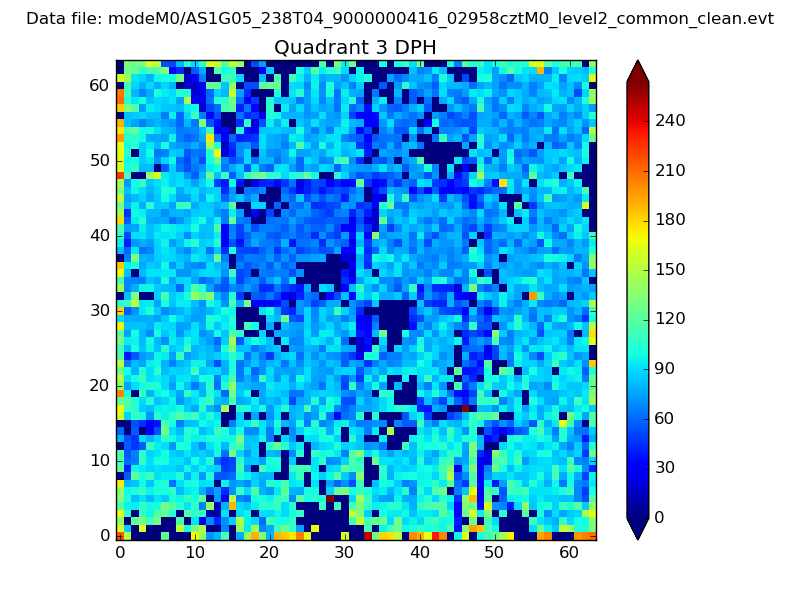 |
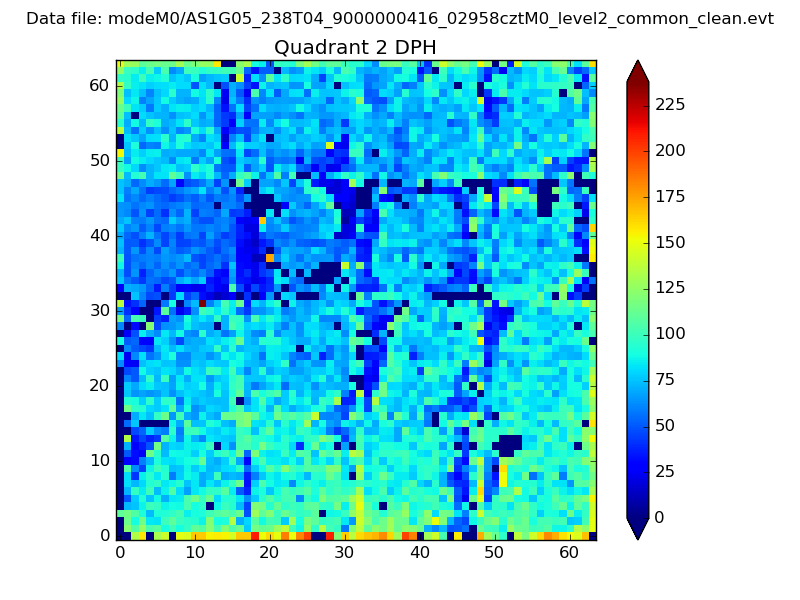 |
Quadrant C |
| Plot type | Count rate plots | Images |
|---|---|---|
| Comparison with Poisson distribution Blue bars denote a histogram of data divided into 1 sec bins. Red curve is a Poisson curve with rate = median count rate of data. |
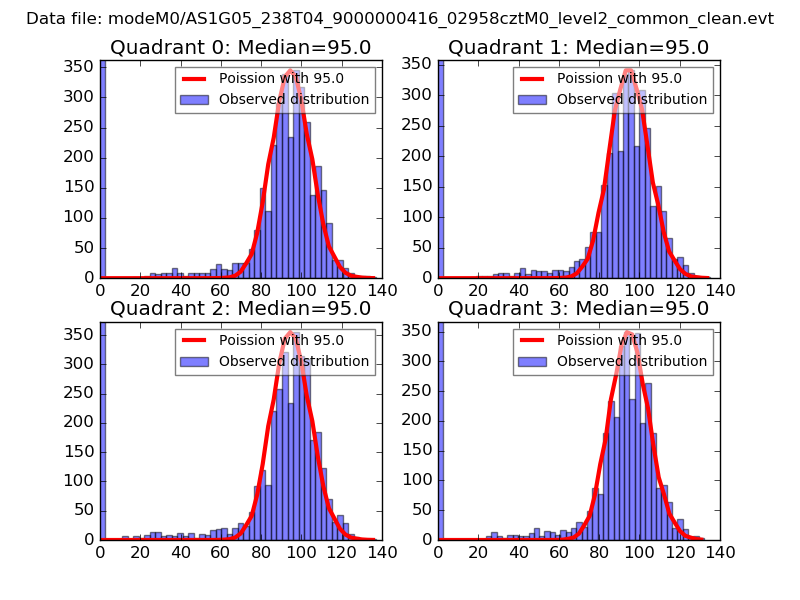 |
 |
| Quadrant-wise count rates Data is divided into 100 sec bins |
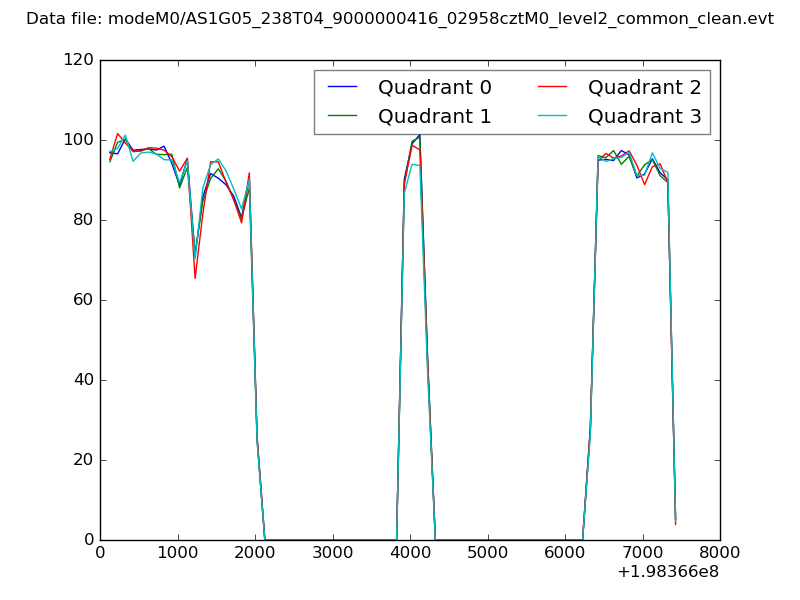 |
|
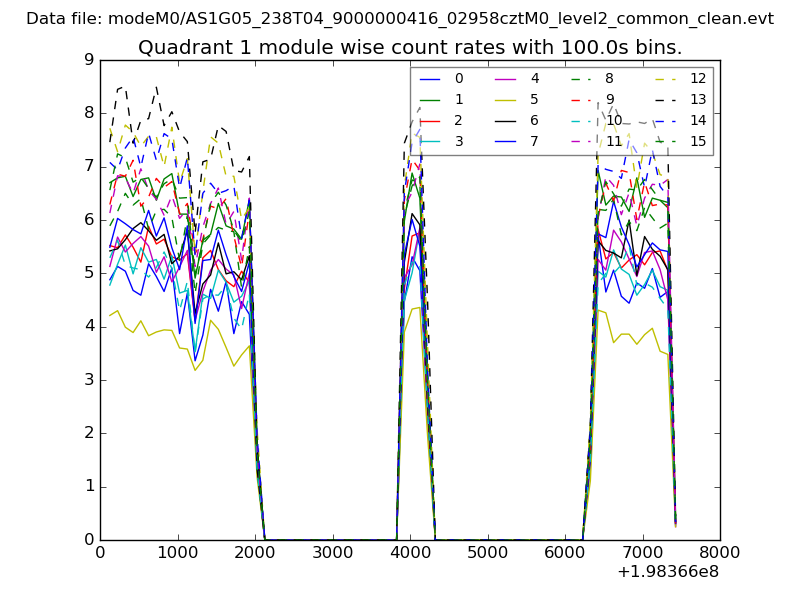
| Module-wise count rates for Quadrant A Data is divided into 100 sec bins |
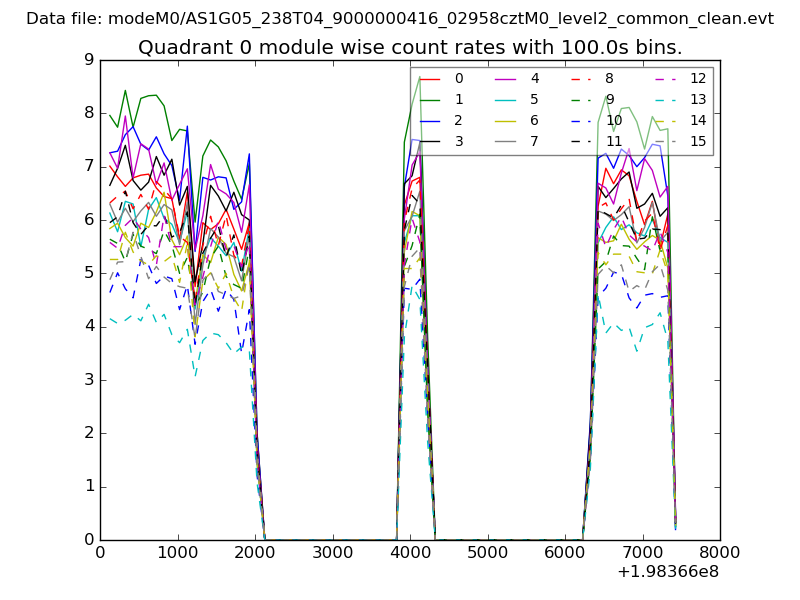 |
 |
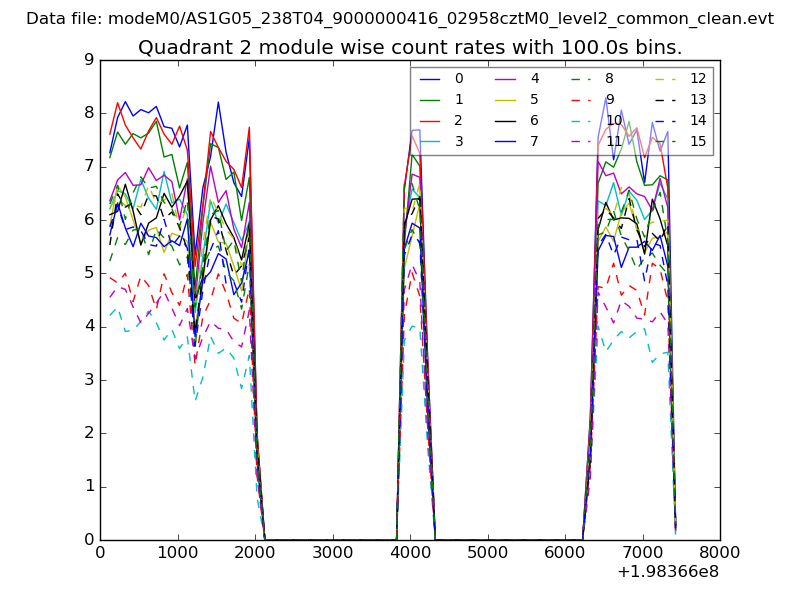
| Module-wise count rates for Quadrant B Data is divided into 100 sec bins |
 |
 |
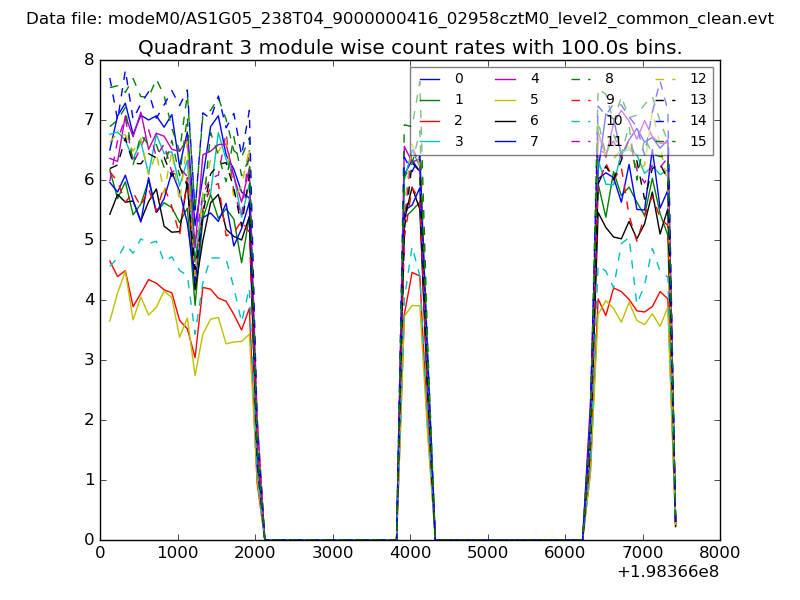
| Module-wise count rates for Quadrant C Data is divided into 100 sec bins |
 |
 |
| Module-wise count rates for Quadrant D Data is divided into 100 sec bins |
 |
 |
| Parameter | Plot |
|---|---|
| CZT HV Monitor | 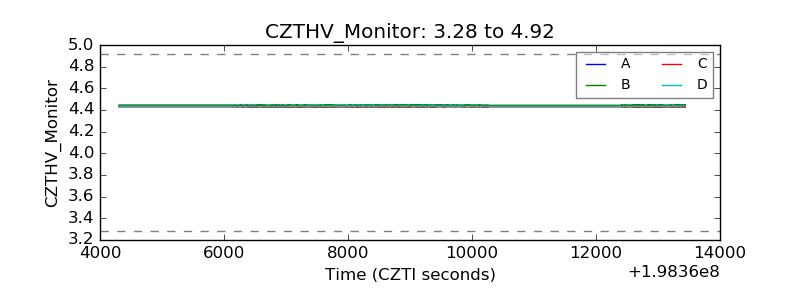 |
| D_VDD | 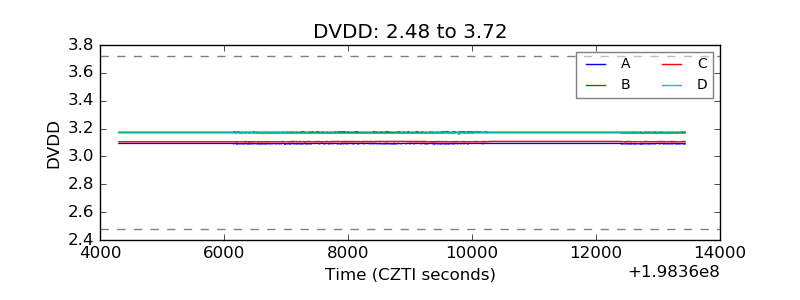 |
| Temperature 1 | 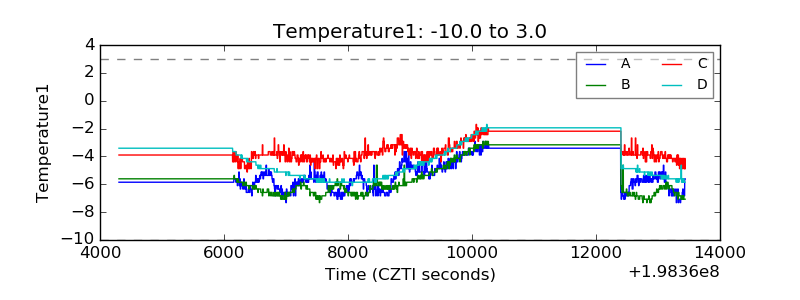 |
| Veto HV Monitor | 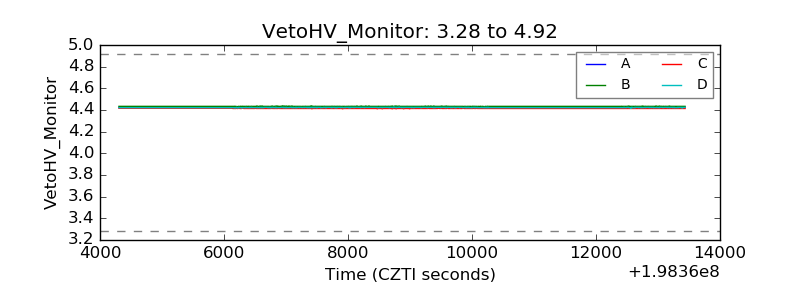 |
| Veto LLD |  |
| Alpha Counter | 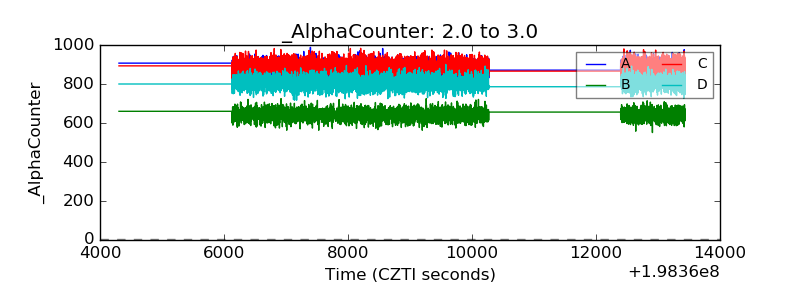 |
| _CPM_Rate | 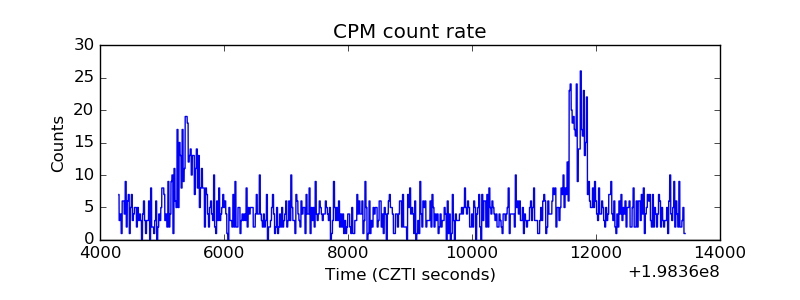 |
| CZT Counter | 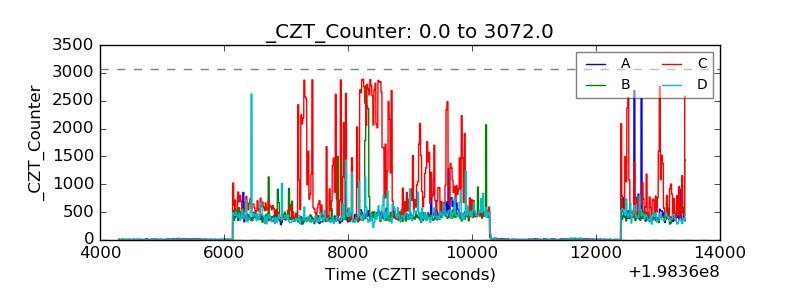 |
| +2.5 Volts monitor |  |
| +5 Volts monitor | 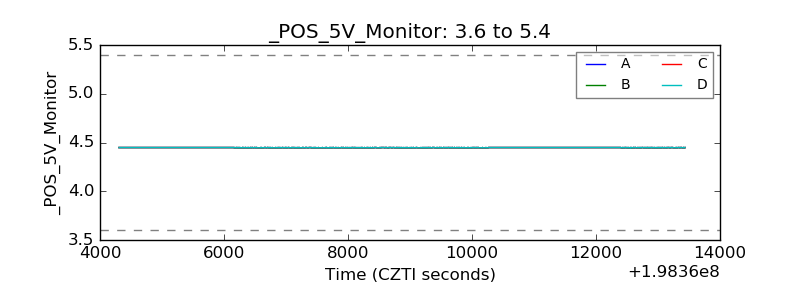 |
| Veto Counter | 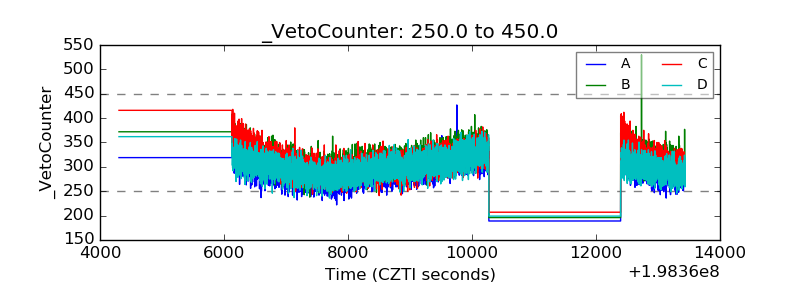 |