| Param | Original file | Final file |
|---|---|---|
| Filename | modeM0/AS1G05_238T04_9000000416_02961cztM0_level2.evt | modeM0/AS1G05_238T04_9000000416_02961cztM0_level2_common_clean.evt |
| Size (bytes) | 1,878,197,760 | 235,546,560 |
| Size | 1.7 GB | 224.6 MB |
| Events in quadrant A | 11,871,851 | 1,342,759 |
| Events in quadrant B | 13,227,273 | 1,338,545 |
| Events in quadrant C | 15,415,971 | 1,349,210 |
| Events in quadrant D | 14,616,095 | 1,321,185 |
| Mode M0 | |||
|---|---|---|---|
| Quadrant | BADHDUFLAG | Total packets | Discarded packets |
| A | 0 | 55142 | 8 |
| B | 0 | 58349 | 7 |
| C | 0 | 64789 | 7 |
| D | 0 | 62791 | 7 |
| Mode SS | |||
|---|---|---|---|
| Quadrant | BADHDUFLAG | Total packets | Discarded packets |
| A | 0 | 532 | 0 |
| B | 0 | 532 | 0 |
| C | 0 | 532 | 0 |
| D | 0 | 532 | 0 |
| Mode M9 | |||
|---|---|---|---|
| Quadrant | BADHDUFLAG | Total packets | Discarded packets |
| A | 0 | 128 | 0 |
| B | 0 | 128 | 0 |
| C | 0 | 128 | 0 |
| D | 0 | 128 | 0 |
| Quadrant | Total seconds | Saturated seconds | Saturation percentage |
|---|---|---|---|
| A | 25912 | 218 | 0.841309% |
| B | 25912 | 474 | 1.829268% |
| C | 25912 | 805 | 3.106669% |
| D | 25913 | 606 | 2.338595% |
Noise dominated data is calculated using 1-second bins in cleaned event files. If a bin has >2000 counts, and if more than 50% of those come from <1% of pixels, then it is considered to be noise-dominated and hence unusable.
| Quadrant | # 1 sec bins | Bins with >0 counts | Bins with >2000 counts | High rate bins dominated by noise | Noise dominated (total time) | Noise dominated (detector-on time) | Marked lightcurve |
|---|---|---|---|---|---|---|---|
| A | 38753 | 25918 | 151 | 151 | 0.39% | 0.58% | 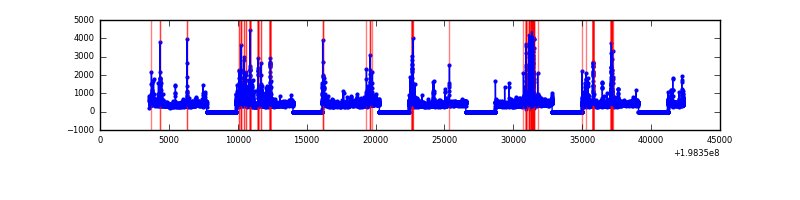 |
| B | 38753 | 25918 | 357 | 357 | 0.92% | 1.38% | 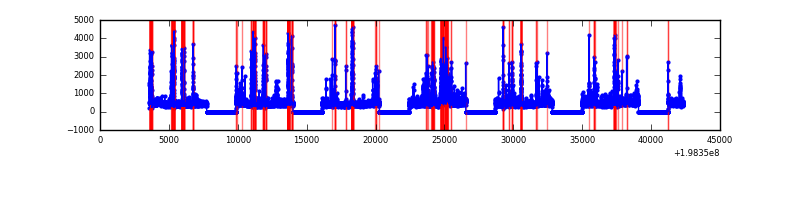 |
| C | 38753 | 25918 | 759 | 759 | 1.96% | 2.93% | 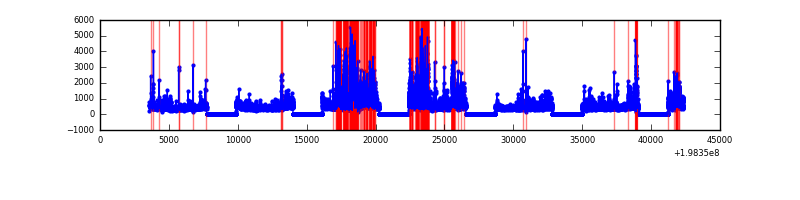 |
| D | 38754 | 25919 | 489 | 489 | 1.26% | 1.89% | 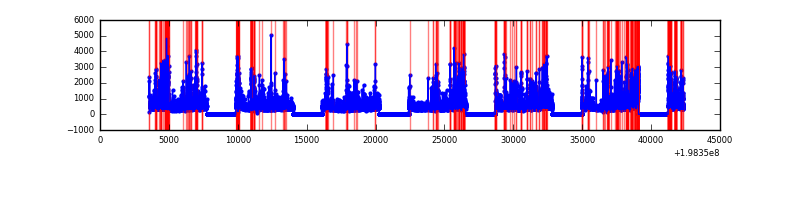 |
Top three noisy pixels from each quadrant. If the there are fewer than three noisy pixels in the level2.evt file, extra rows are filled as -1
| Pixel properties | Quadrant properties | ||||||
|---|---|---|---|---|---|---|---|
| Quadrant | DetID | PixID | Counts | Sigma | Mean | Median | Sigma |
| A | 0 | 50 | 678231 | 1244.33 | 2662 | 2600 | 543.0 |
| A | 0 | 31 | 463513 | 848.88 | 2662 | 2600 | 543.0 |
| A | 8 | 15 | 126634 | 228.44 | 2662 | 2600 | 543.0 |
| B | 5 | 70 | 866735 | 1665.26 | 2709 | 2643 | 518.9 |
| B | 2 | 249 | 864246 | 1660.47 | 2709 | 2643 | 518.9 |
| B | 3 | 27 | 237427 | 452.47 | 2709 | 2643 | 518.9 |
| C | 1 | 192 | 4240638 | 7048.82 | 2578 | 2589 | 601.2 |
| C | 6 | 80 | 506176 | 837.58 | 2578 | 2589 | 601.2 |
| C | 0 | 219 | 185283 | 303.86 | 2578 | 2589 | 601.2 |
| D | 12 | 1 | 1393219 | 2214.64 | 2557 | 2499 | 628.0 |
| D | 1 | 31 | 614189 | 974.08 | 2557 | 2499 | 628.0 |
| D | 2 | 209 | 399056 | 631.49 | 2557 | 2499 | 628.0 |
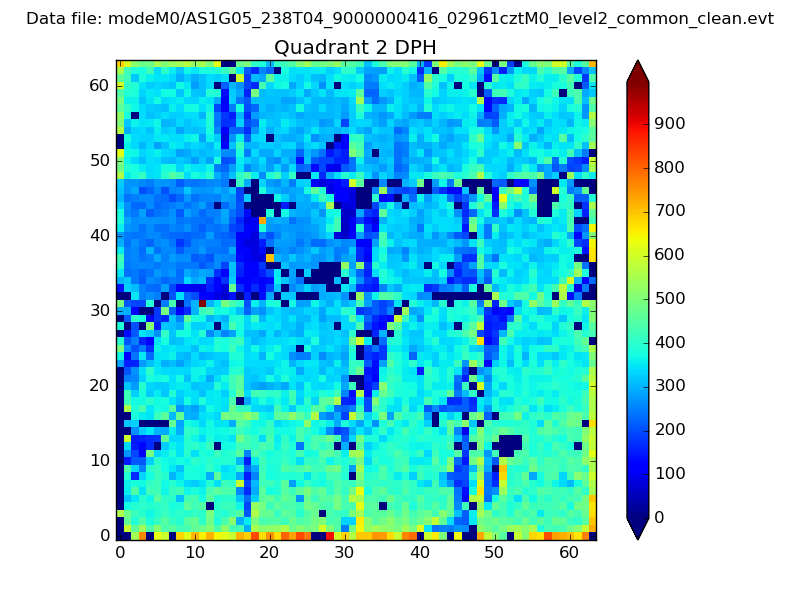
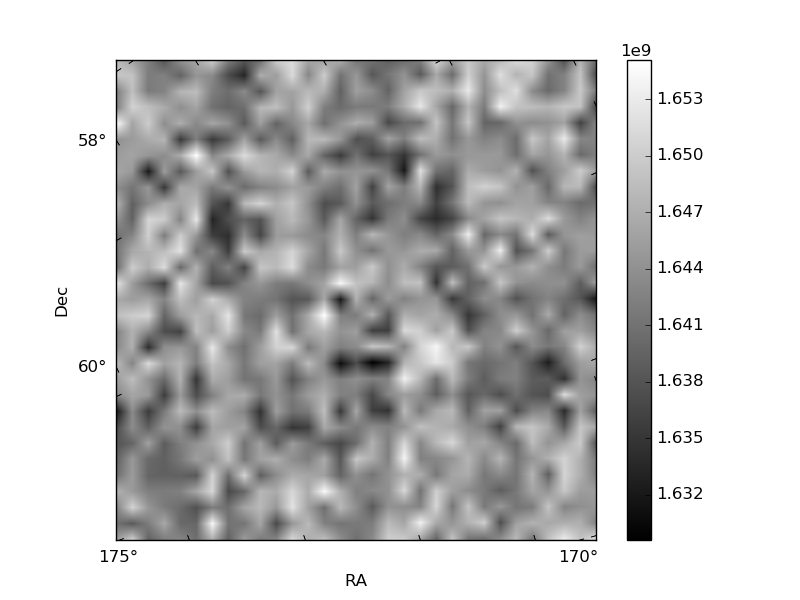
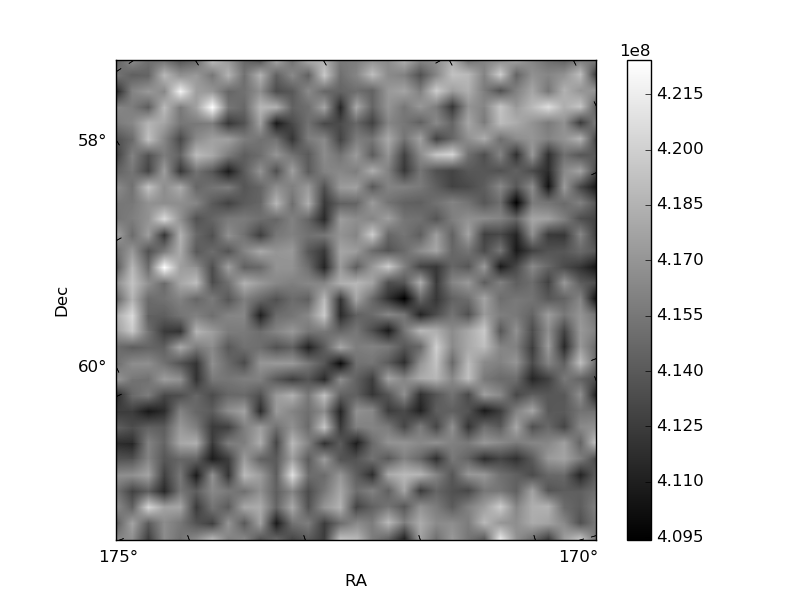
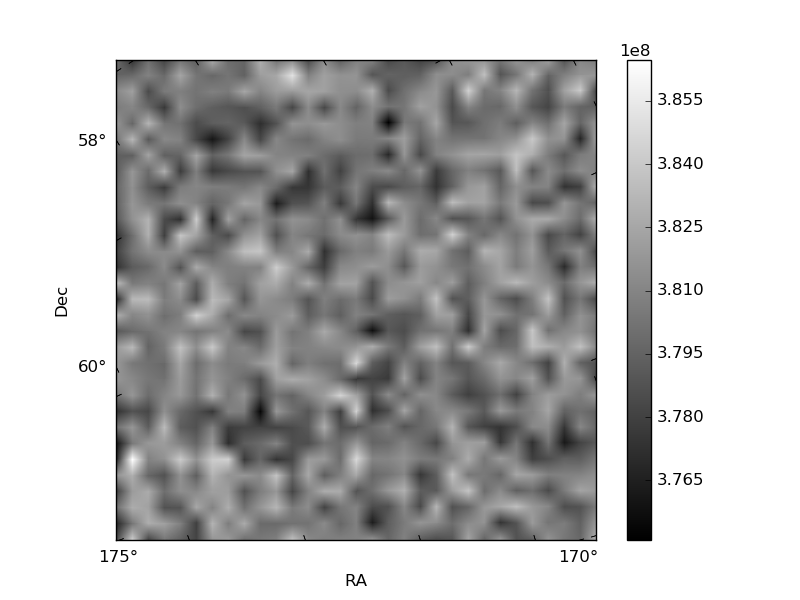
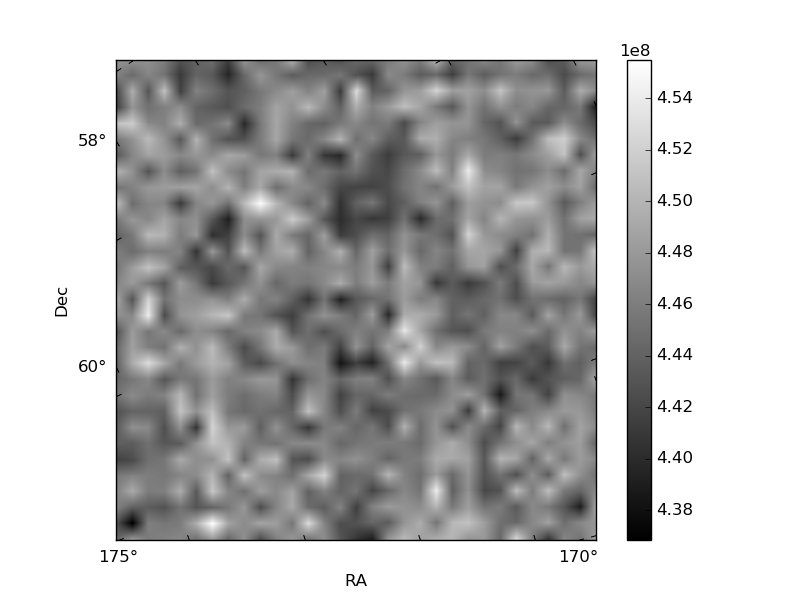
Histogram calculated using DETX and DETY for each event in the final _common_clean file
| Quadrant A | 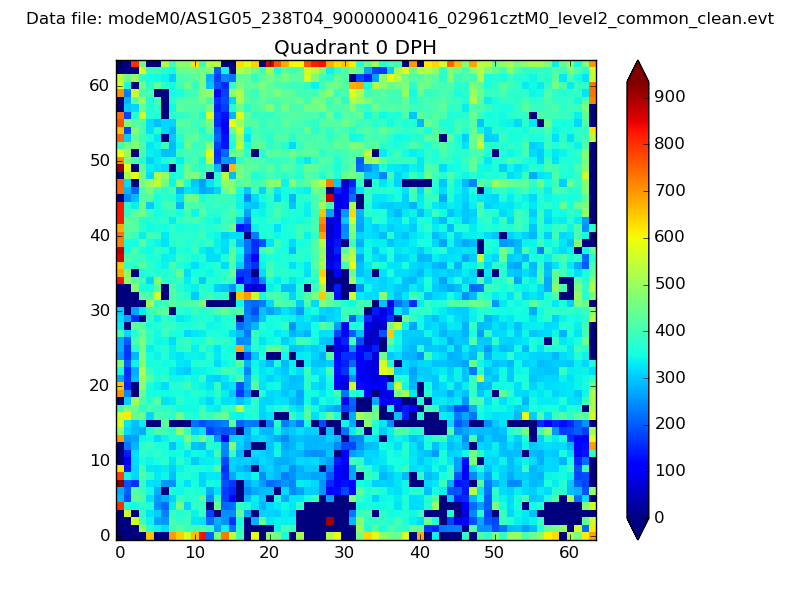 |
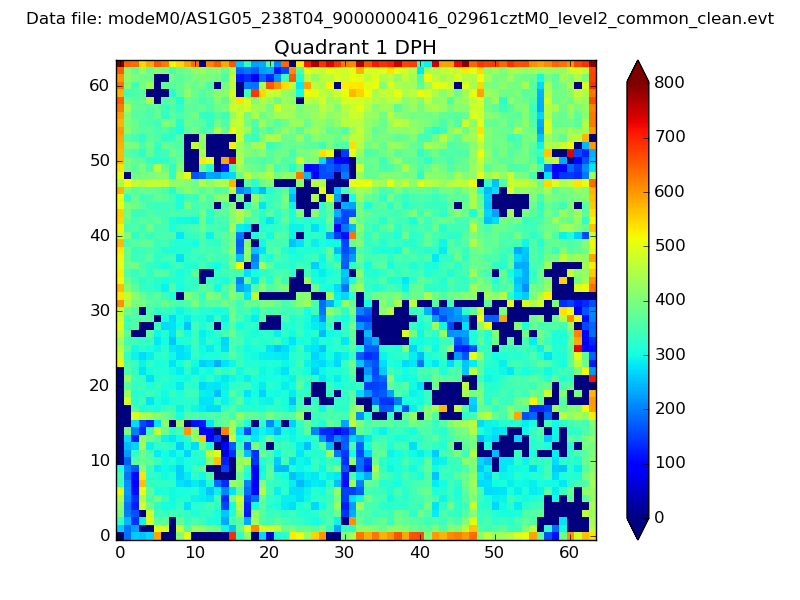 |
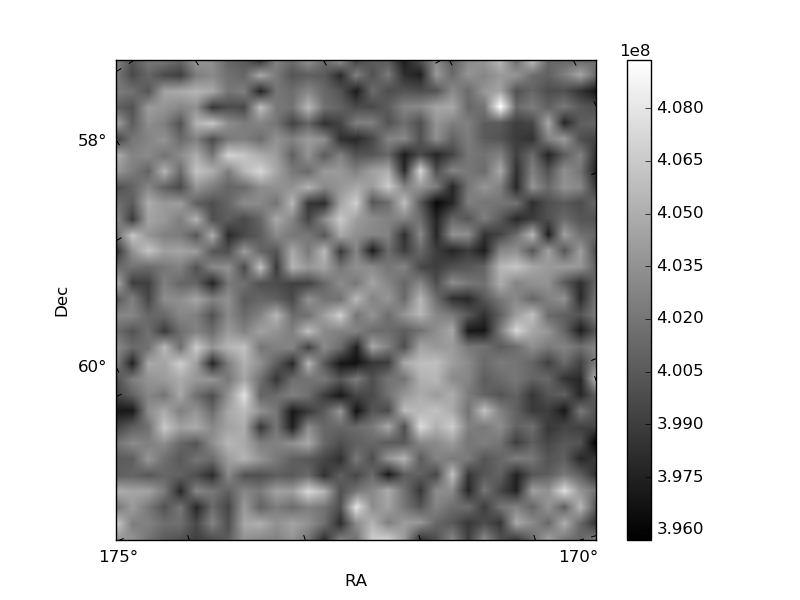
Quadrant B |
|---|---|---|---|
| Quadrant D | 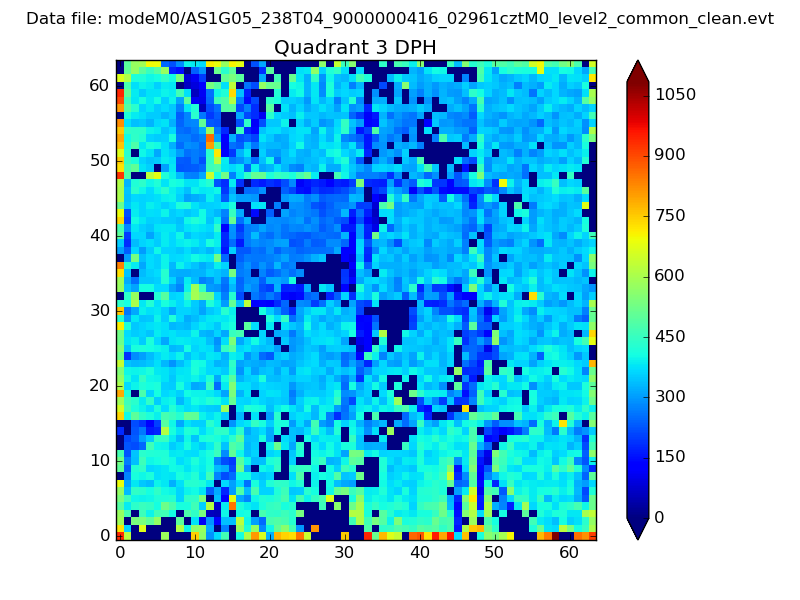 |
 |
Quadrant C |
| Plot type | Count rate plots | Images |
|---|---|---|
| Comparison with Poisson distribution Blue bars denote a histogram of data divided into 1 sec bins. Red curve is a Poisson curve with rate = median count rate of data. |
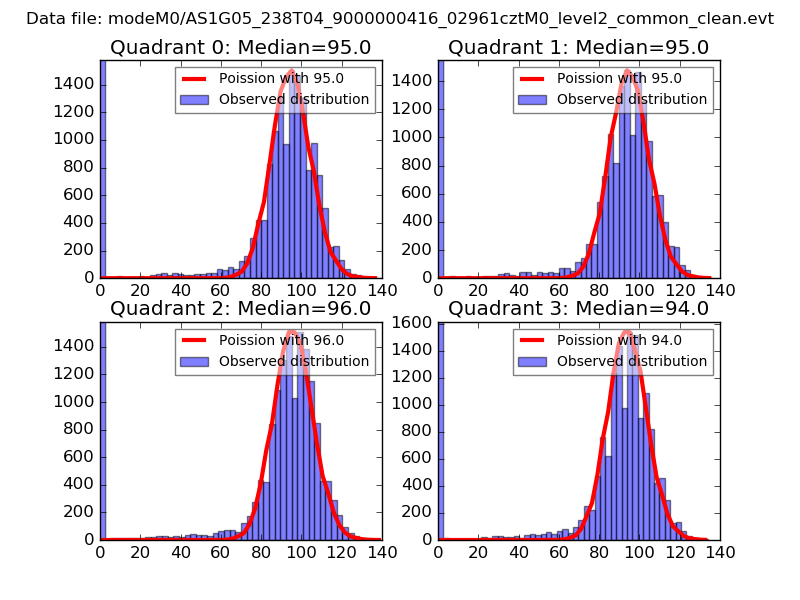 |
 |
| Quadrant-wise count rates Data is divided into 100 sec bins |
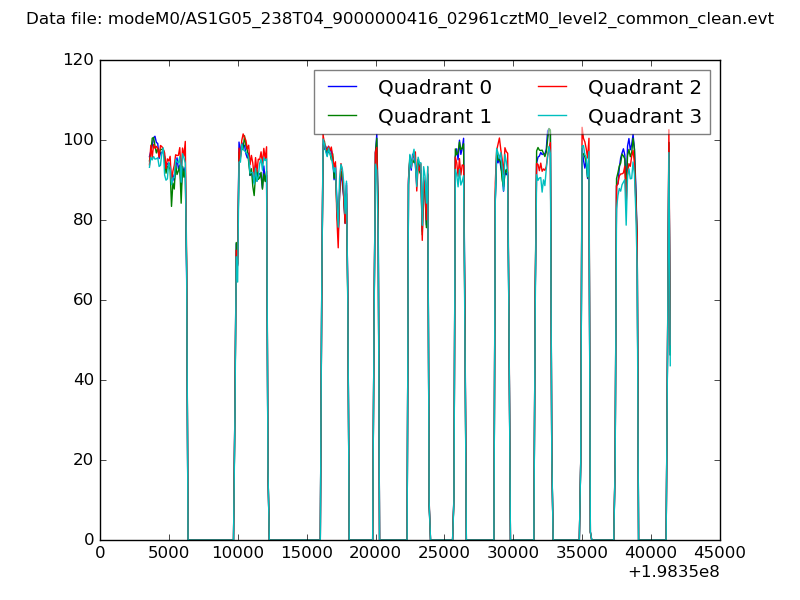 |
|
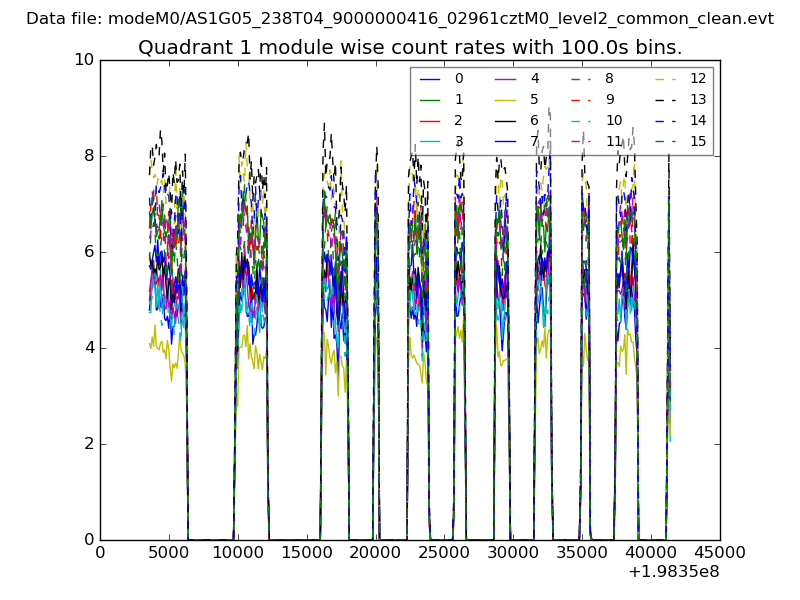
| Module-wise count rates for Quadrant A Data is divided into 100 sec bins |
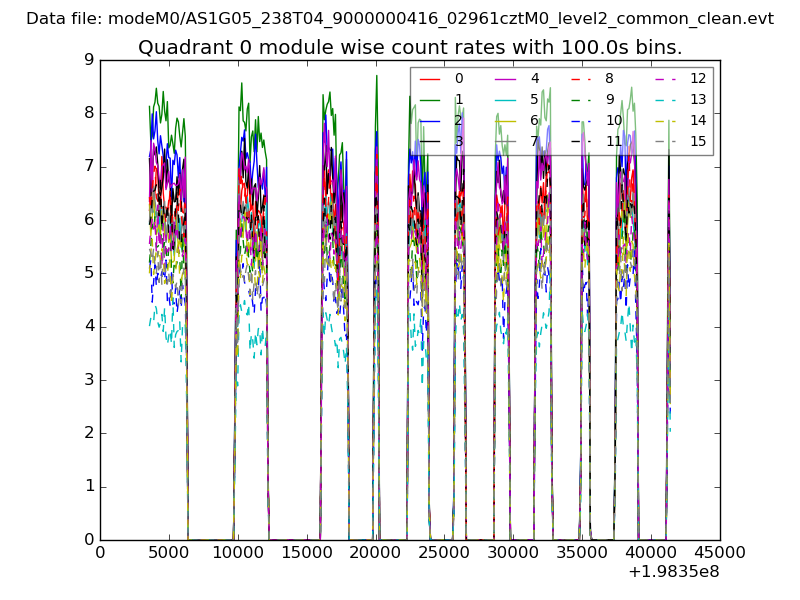 |
 |
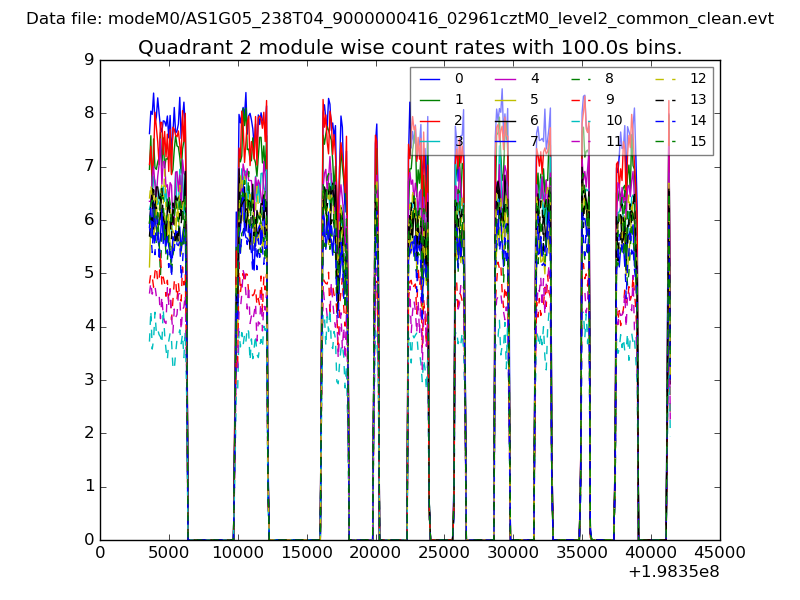
| Module-wise count rates for Quadrant B Data is divided into 100 sec bins |
 |
 |
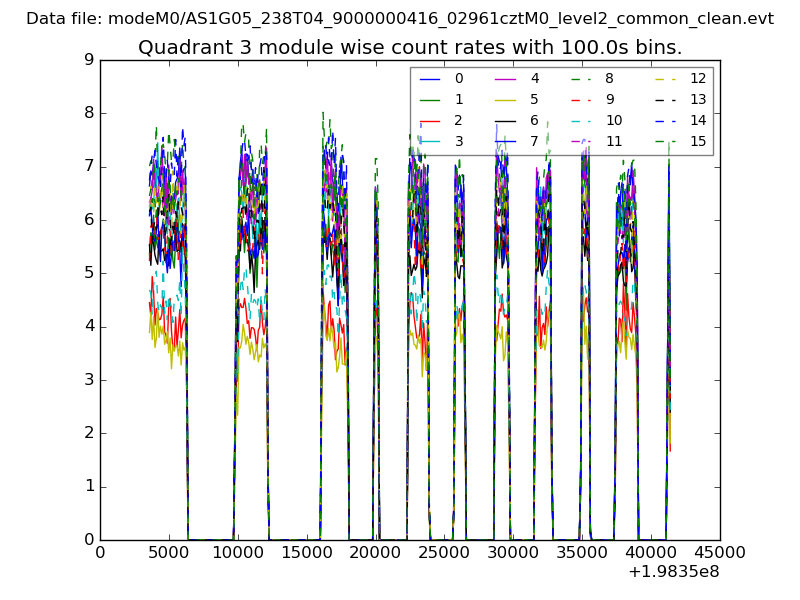
| Module-wise count rates for Quadrant C Data is divided into 100 sec bins |
 |
 |
| Module-wise count rates for Quadrant D Data is divided into 100 sec bins |
 |
 |
| Parameter | Plot |
|---|---|
| CZT HV Monitor | 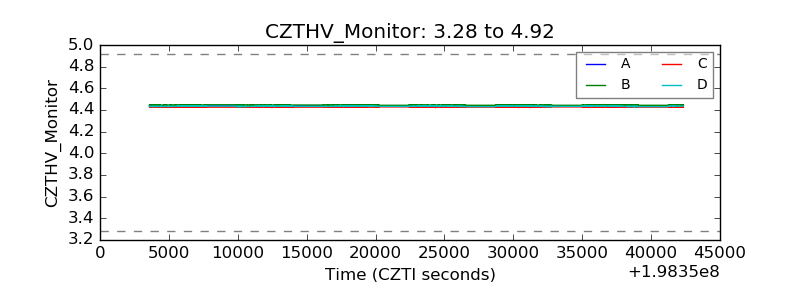 |
| D_VDD |  |
| Temperature 1 | 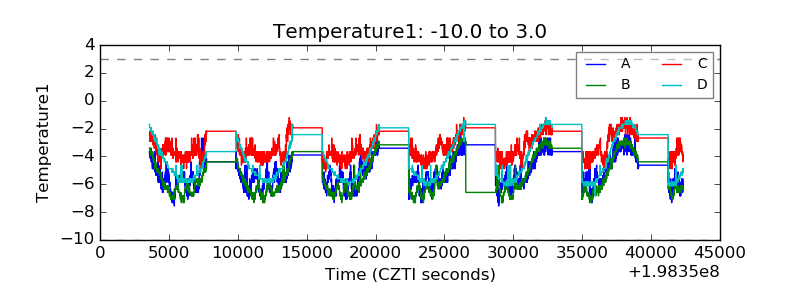 |
| Veto HV Monitor | 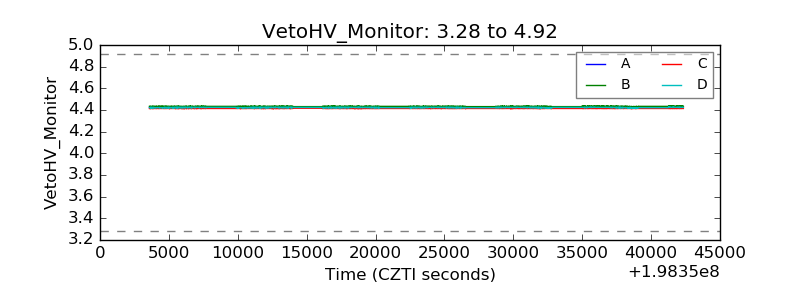 |
| Veto LLD | 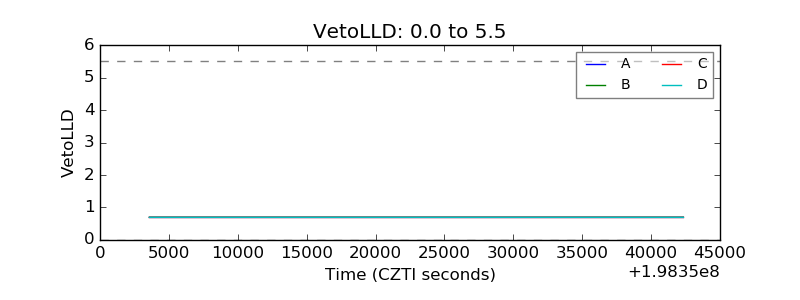 |
| Alpha Counter | 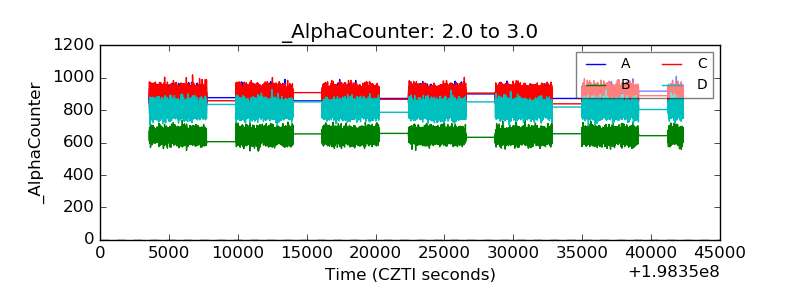 |
| _CPM_Rate | 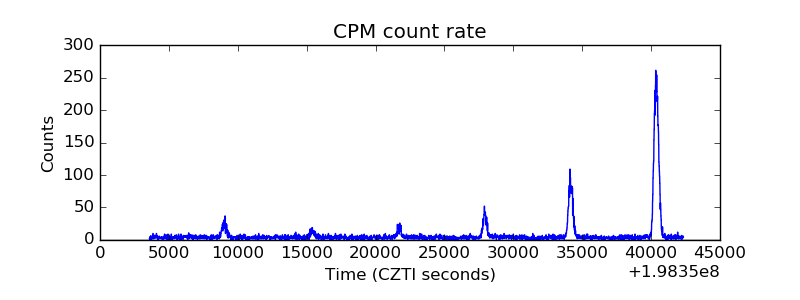 |
| CZT Counter | 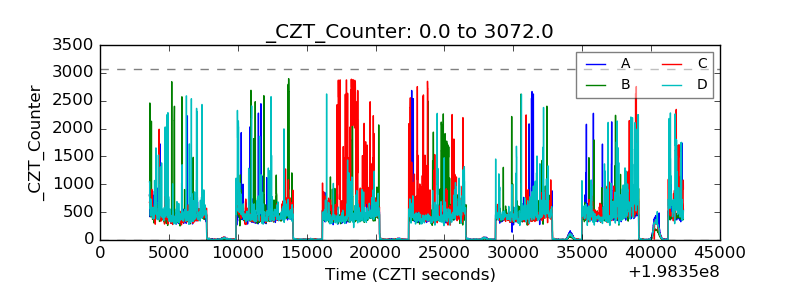 |
| +2.5 Volts monitor |  |
| +5 Volts monitor |  |
| Veto Counter | 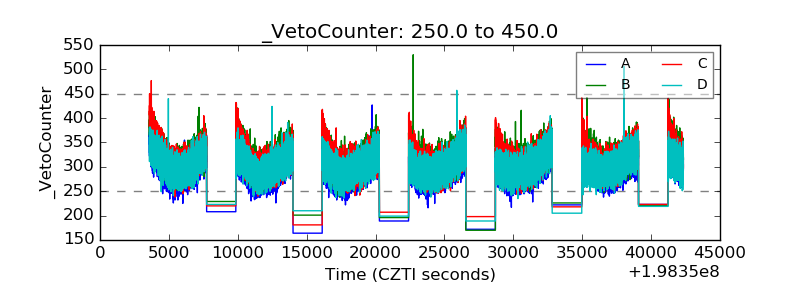 |