| Param | Original file | Final file |
|---|---|---|
| Filename | modeM0/AS1G05_238T04_9000000416_02964cztM0_level2.evt | modeM0/AS1G05_238T04_9000000416_02964cztM0_level2_quad_clean.evt |
| Size (bytes) | 369,953,280 | 43,735,680 |
| Size | 352.8 MB | 41.7 MB |
| Events in quadrant A | 2,469,680 | 245,000 |
| Events in quadrant B | 2,715,162 | 241,454 |
| Events in quadrant C | 2,412,516 | 240,186 |
| Events in quadrant D | 3,250,139 | 230,203 |
| Mode M0 | |||
|---|---|---|---|
| Quadrant | BADHDUFLAG | Total packets | Discarded packets |
| A | 0 | 10955 | 3 |
| B | 0 | 11575 | 2 |
| C | 0 | 10848 | 2 |
| D | 0 | 13320 | 2 |
| Mode SS | |||
|---|---|---|---|
| Quadrant | BADHDUFLAG | Total packets | Discarded packets |
| A | 0 | 106 | 0 |
| B | 0 | 106 | 0 |
| C | 0 | 106 | 0 |
| D | 0 | 106 | 0 |
| Mode M9 | |||
|---|---|---|---|
| Quadrant | BADHDUFLAG | Total packets | Discarded packets |
| A | 0 | 30 | 0 |
| B | 0 | 30 | 0 |
| C | 0 | 30 | 0 |
| D | 0 | 31 | 0 |
| Quadrant | Total seconds | Saturated seconds | Saturation percentage |
|---|---|---|---|
| A | 5240 | 21 | 0.400763% |
| B | 5240 | 56 | 1.068702% |
| C | 5240 | 6 | 0.114504% |
| D | 5240 | 124 | 2.366412% |
Noise dominated data is calculated using 1-second bins in cleaned event files. If a bin has >2000 counts, and if more than 50% of those come from <1% of pixels, then it is considered to be noise-dominated and hence unusable.
| Quadrant | # 1 sec bins | Bins with >0 counts | Bins with >2000 counts | High rate bins dominated by noise | Noise dominated (total time) | Noise dominated (detector-on time) | Marked lightcurve |
|---|---|---|---|---|---|---|---|
| A | 7395 | 5241 | 8 | 8 | 0.11% | 0.15% | 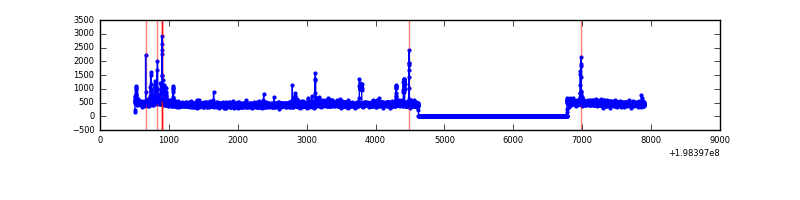 |
| B | 7395 | 5241 | 37 | 37 | 0.50% | 0.71% | 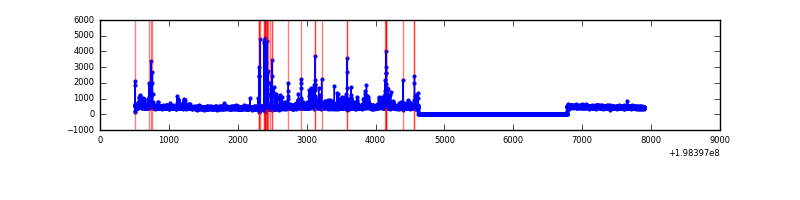 |
| C | 7395 | 5241 | 4 | 4 | 0.05% | 0.08% | 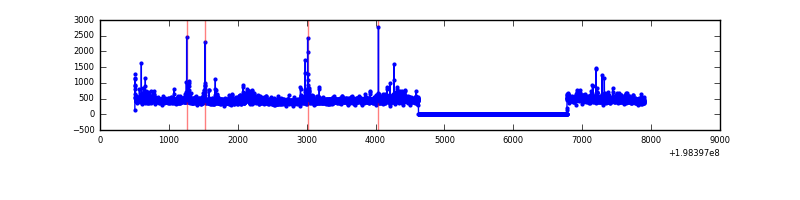 |
| D | 7395 | 5241 | 83 | 83 | 1.12% | 1.58% | 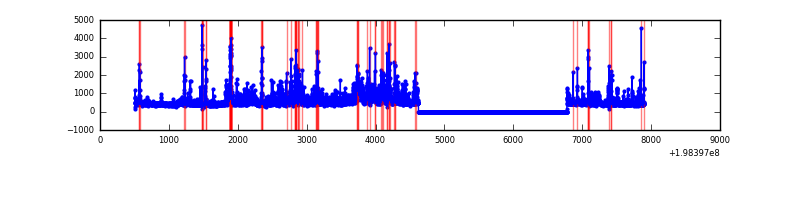 |
Top three noisy pixels from each quadrant. If the there are fewer than three noisy pixels in the level2.evt file, extra rows are filled as -1
| Pixel properties | Quadrant properties | ||||||
|---|---|---|---|---|---|---|---|
| Quadrant | DetID | PixID | Counts | Sigma | Mean | Median | Sigma |
| A | 0 | 50 | 97483 | 815.84 | 582 | 570 | 118.8 |
| A | 8 | 15 | 41659 | 345.89 | 582 | 570 | 118.8 |
| A | 7 | 144 | 37915 | 314.38 | 582 | 570 | 118.8 |
| B | 14 | 50 | 103725 | 907.73 | 587 | 573 | 113.6 |
| B | 3 | 27 | 89159 | 779.55 | 587 | 573 | 113.6 |
| B | 15 | 85 | 49233 | 428.2 | 587 | 573 | 113.6 |
| C | 1 | 192 | 82562 | 626.16 | 559 | 560 | 131.0 |
| C | 6 | 80 | 53058 | 400.87 | 559 | 560 | 131.0 |
| C | 0 | 219 | 34959 | 262.67 | 559 | 560 | 131.0 |
| D | 1 | 239 | 188567 | 1431.49 | 552 | 538 | 131.4 |
| D | 12 | 1 | 180394 | 1369.27 | 552 | 538 | 131.4 |
| D | 2 | 136 | 159074 | 1206.96 | 552 | 538 | 131.4 |
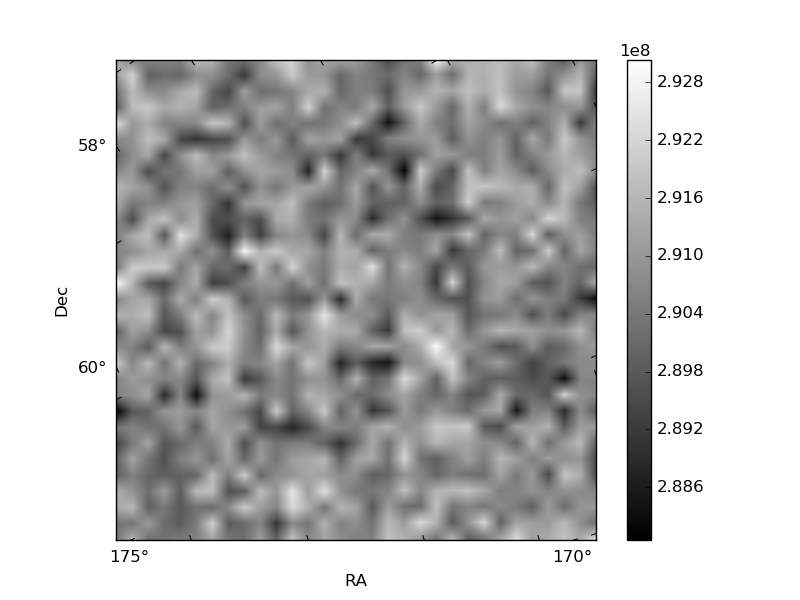
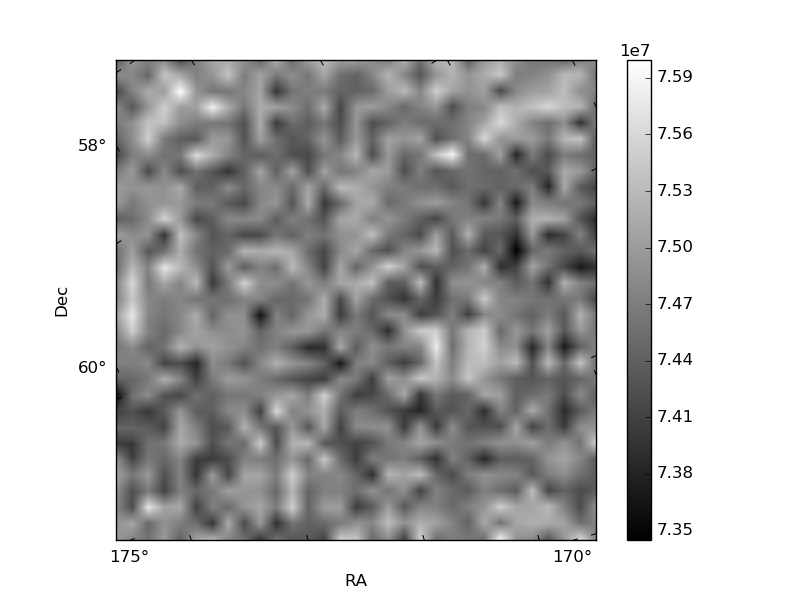
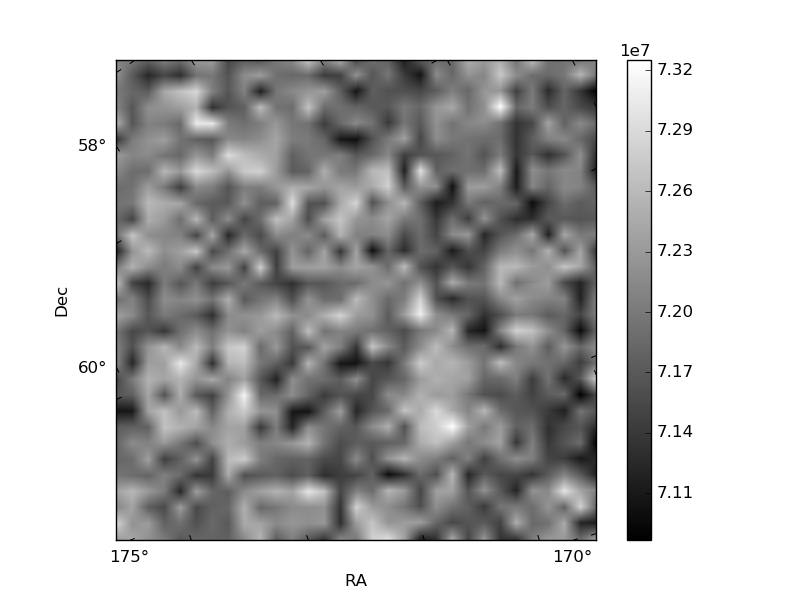
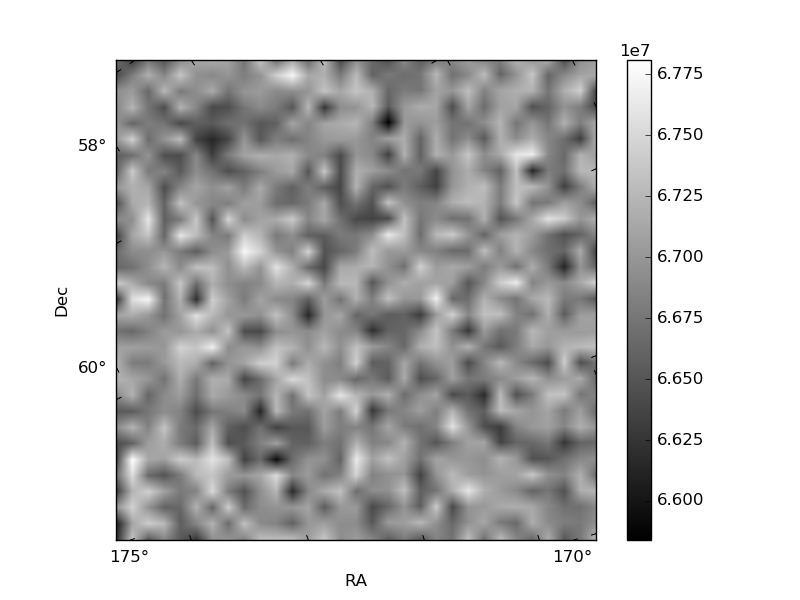
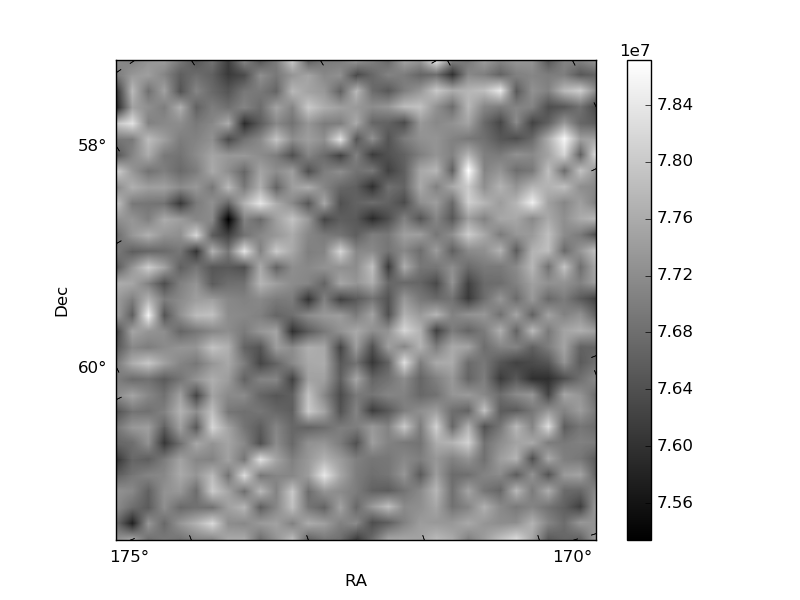
Histogram calculated using DETX and DETY for each event in the final _common_clean file
| Quadrant A | 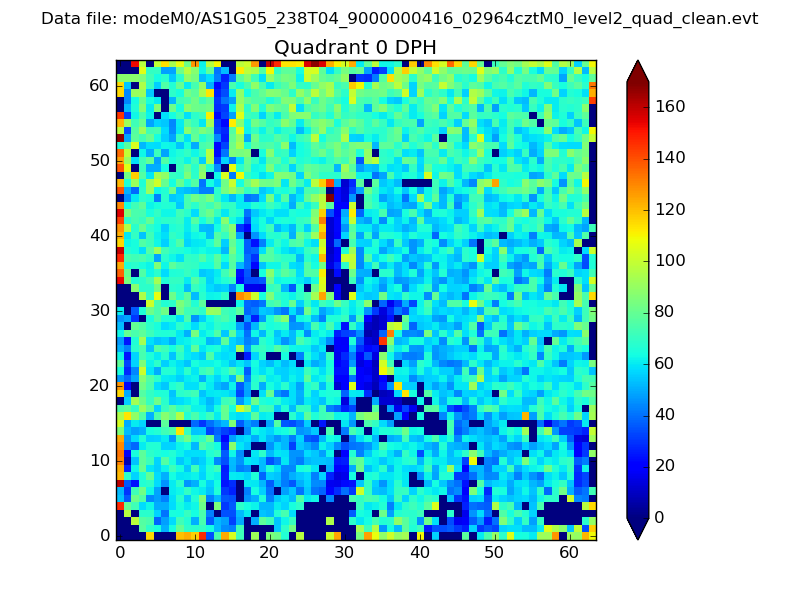 |
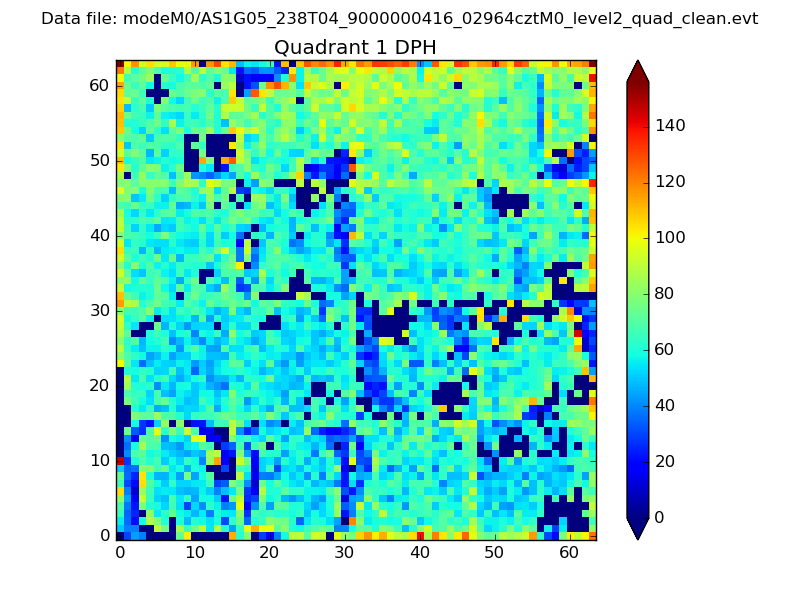 |
Quadrant B |
|---|---|---|---|
| Quadrant D | 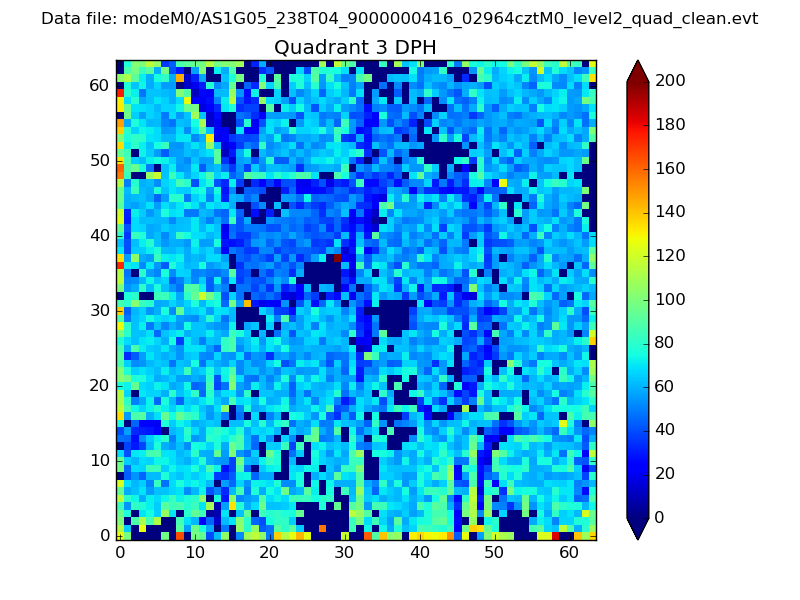 |
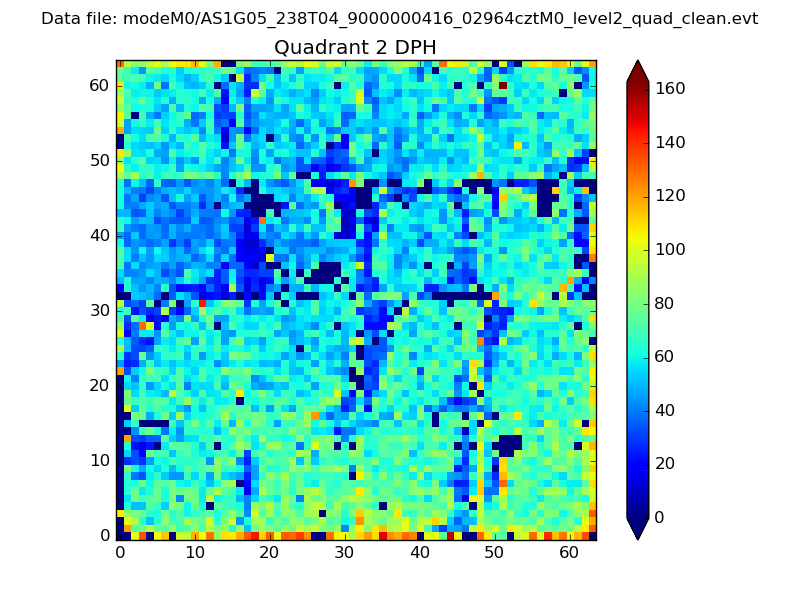 |
Quadrant C |
| Plot type | Count rate plots | Images |
|---|---|---|
| Comparison with Poisson distribution Blue bars denote a histogram of data divided into 1 sec bins. Red curve is a Poisson curve with rate = median count rate of data. |
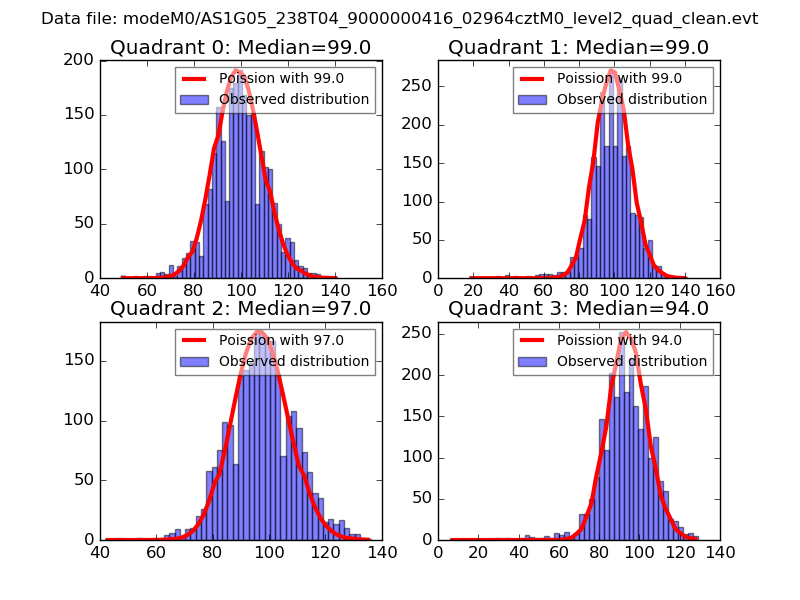 |
 |
| Quadrant-wise count rates Data is divided into 100 sec bins |
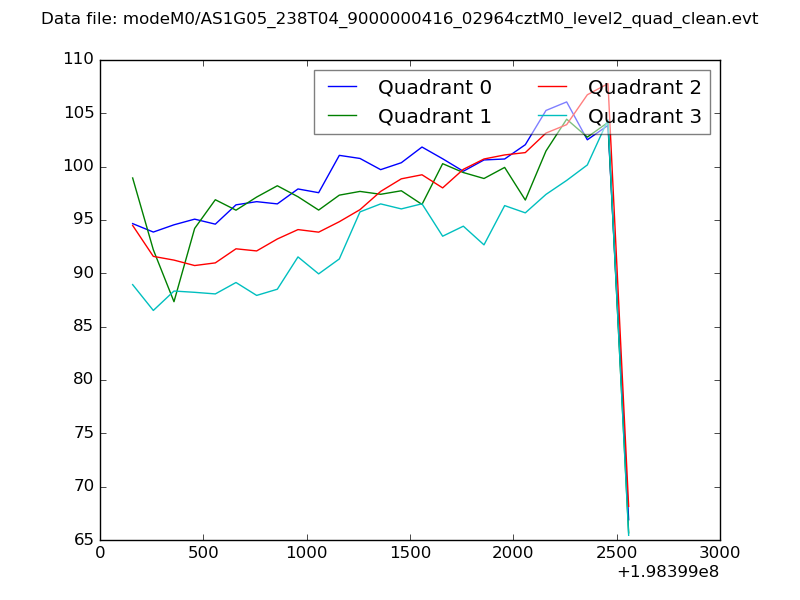 |
|
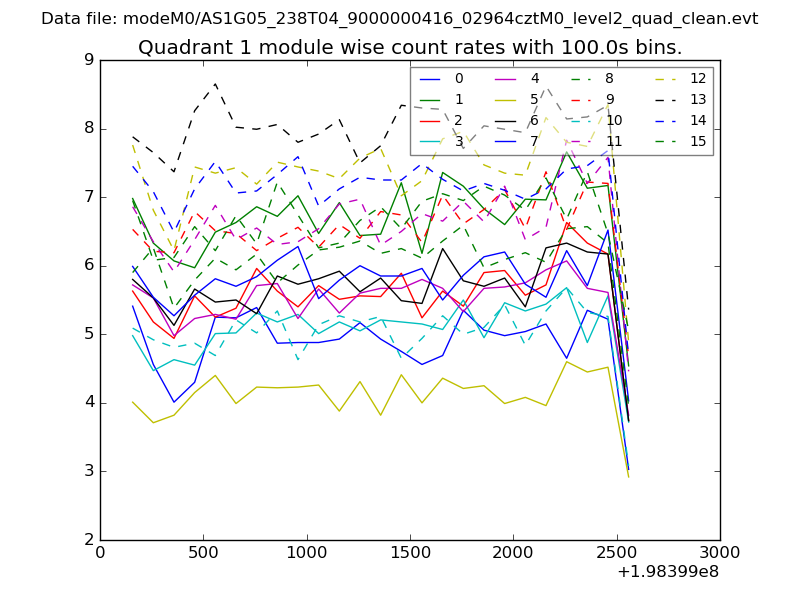
| Module-wise count rates for Quadrant A Data is divided into 100 sec bins |
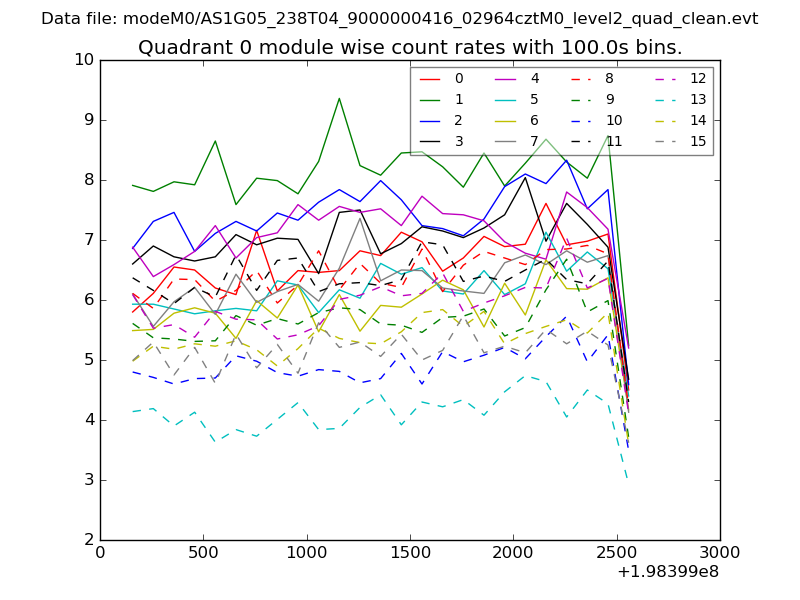 |
 |
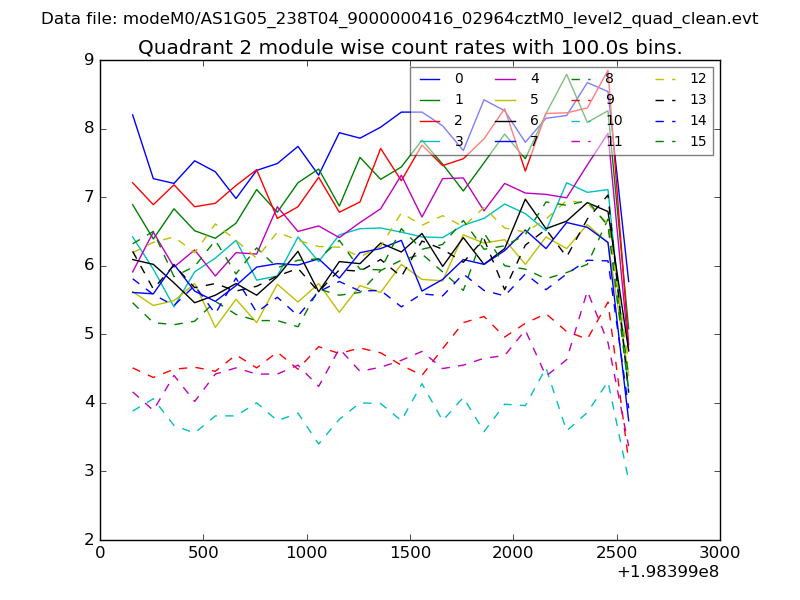
| Module-wise count rates for Quadrant B Data is divided into 100 sec bins |
 |
 |
| Module-wise count rates for Quadrant C Data is divided into 100 sec bins |
 |
 |
| Module-wise count rates for Quadrant D Data is divided into 100 sec bins |
 |
 |
| Parameter | Plot |
|---|---|
| CZT HV Monitor | 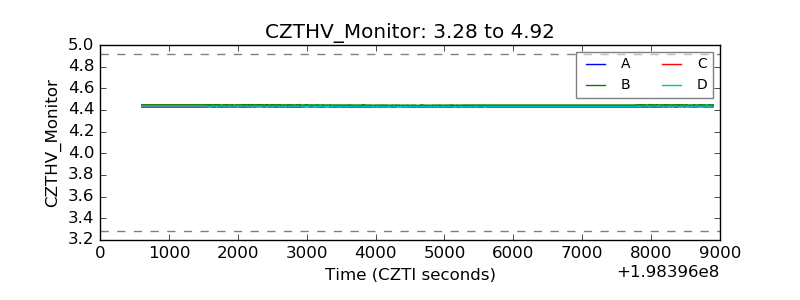 |
| D_VDD | 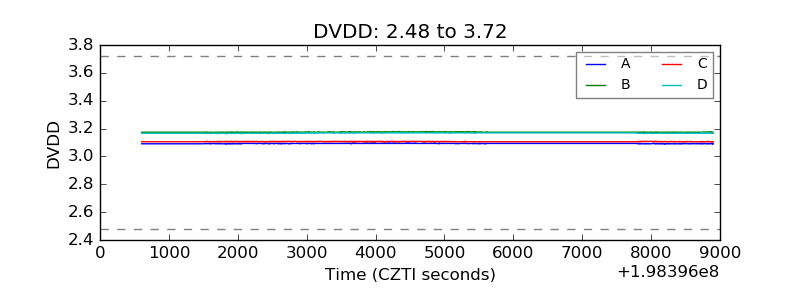 |
| Temperature 1 | 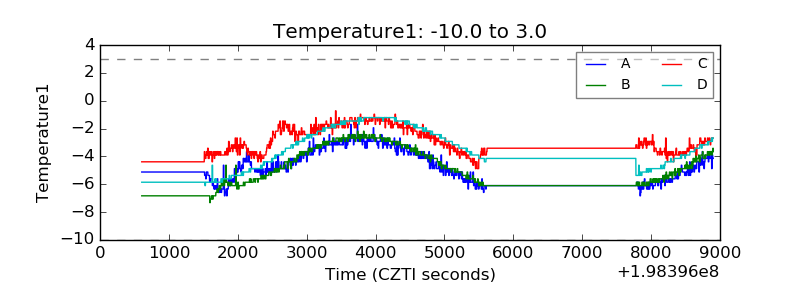 |
| Veto HV Monitor | 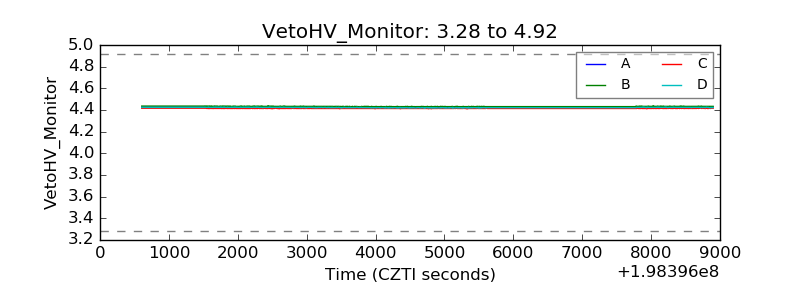 |
| Veto LLD | 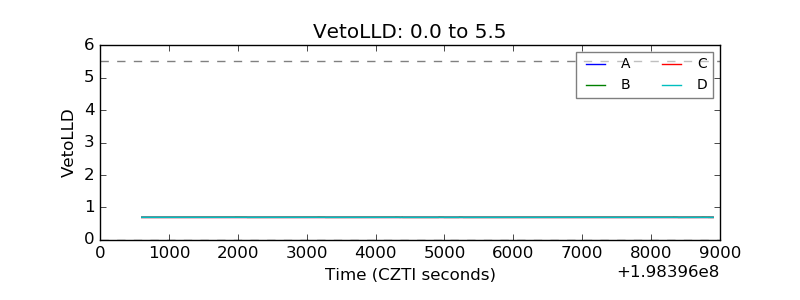 |
| Alpha Counter | 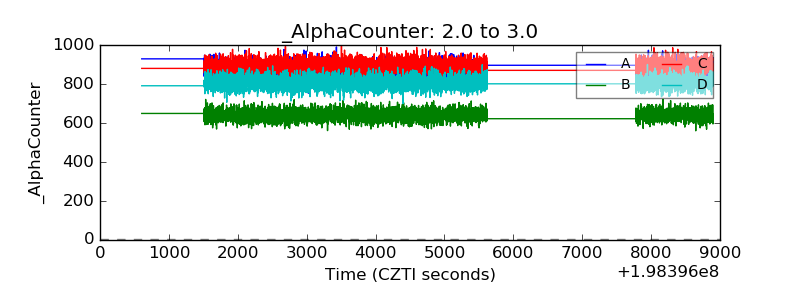 |
| _CPM_Rate | 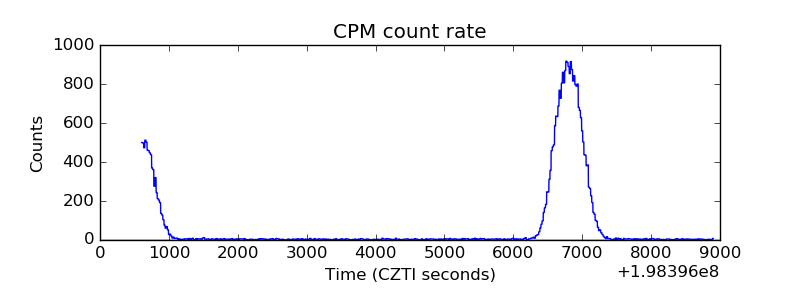 |
| CZT Counter | 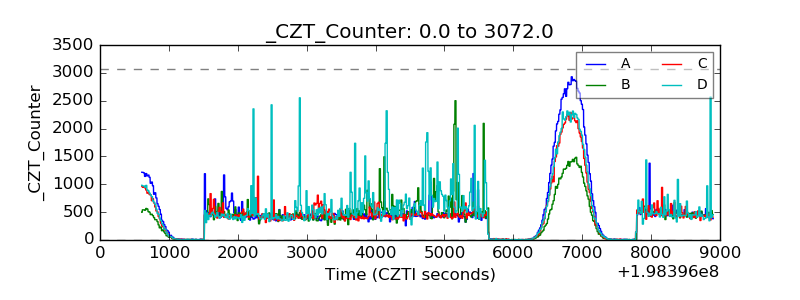 |
| +2.5 Volts monitor |  |
| +5 Volts monitor |  |
| _ROLL_ROT | 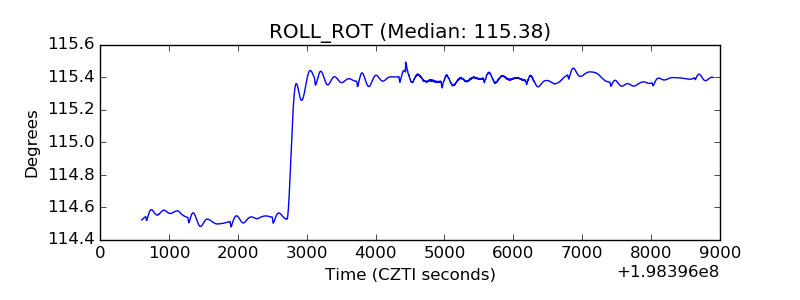 |
| _Roll_DEC | 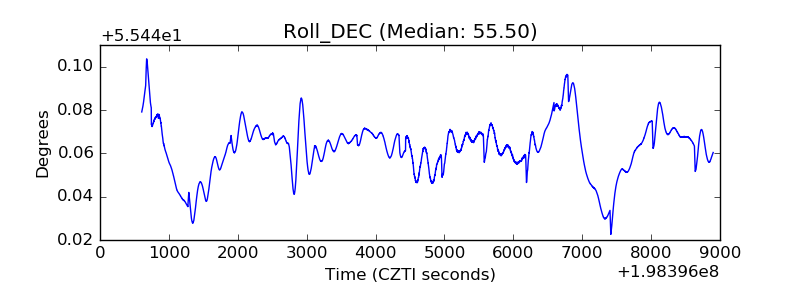 |
| _Roll_RA | 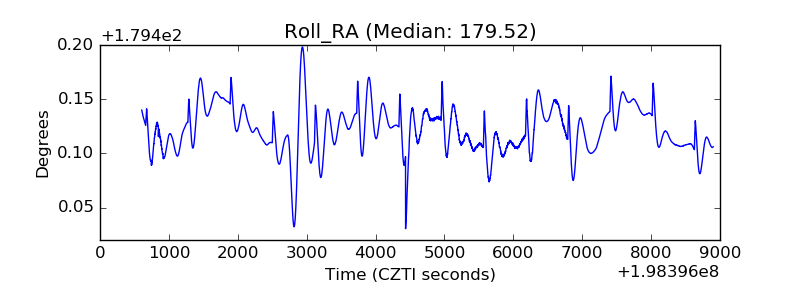 |
| Veto Counter | 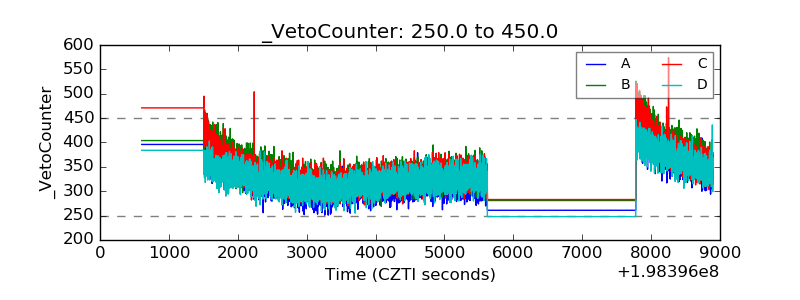 |