| Param | Original file | Final file |
|---|---|---|
| Filename | modeM0/AS1G05_238T04_9000000416_02965cztM0_level2.evt | modeM0/AS1G05_238T04_9000000416_02965cztM0_level2_quad_clean.evt |
| Size (bytes) | 398,433,600 | 55,713,600 |
| Size | 380.0 MB | 53.1 MB |
| Events in quadrant A | 2,440,915 | 339,319 |
| Events in quadrant B | 3,222,624 | 332,160 |
| Events in quadrant C | 2,860,149 | 326,687 |
| Events in quadrant D | 3,182,414 | 317,376 |
| Mode M0 | |||
|---|---|---|---|
| Quadrant | BADHDUFLAG | Total packets | Discarded packets |
| A | 0 | 10789 | 3 |
| B | 0 | 13015 | 2 |
| C | 0 | 11962 | 2 |
| D | 0 | 13053 | 2 |
| Mode SS | |||
|---|---|---|---|
| Quadrant | BADHDUFLAG | Total packets | Discarded packets |
| A | 0 | 108 | 0 |
| B | 0 | 108 | 0 |
| C | 0 | 108 | 0 |
| D | 0 | 108 | 0 |
| Mode M9 | |||
|---|---|---|---|
| Quadrant | BADHDUFLAG | Total packets | Discarded packets |
| A | 0 | 40 | 0 |
| B | 0 | 40 | 0 |
| C | 0 | 40 | 0 |
| D | 0 | 41 | 0 |
| Quadrant | Total seconds | Saturated seconds | Saturation percentage |
|---|---|---|---|
| A | 5299 | 13 | 0.245329% |
| B | 5299 | 140 | 2.642008% |
| C | 5299 | 51 | 0.962446% |
| D | 5299 | 152 | 2.868466% |
Noise dominated data is calculated using 1-second bins in cleaned event files. If a bin has >2000 counts, and if more than 50% of those come from <1% of pixels, then it is considered to be noise-dominated and hence unusable.
| Quadrant | # 1 sec bins | Bins with >0 counts | Bins with >2000 counts | High rate bins dominated by noise | Noise dominated (total time) | Noise dominated (detector-on time) | Marked lightcurve |
|---|---|---|---|---|---|---|---|
| A | 7454 | 5300 | 1 | 1 | 0.01% | 0.02% | 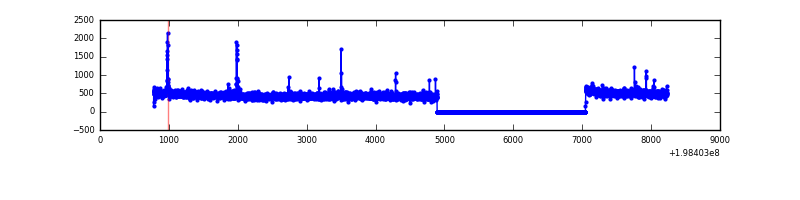 |
| B | 7454 | 5300 | 122 | 122 | 1.64% | 2.30% | 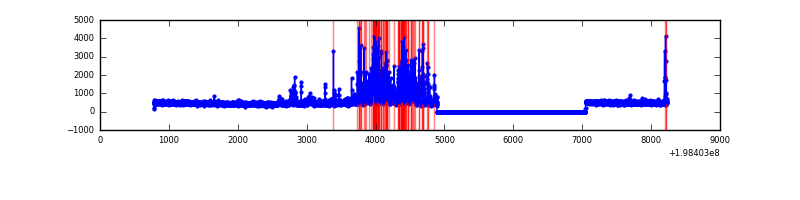 |
| C | 7454 | 5300 | 48 | 48 | 0.64% | 0.91% | 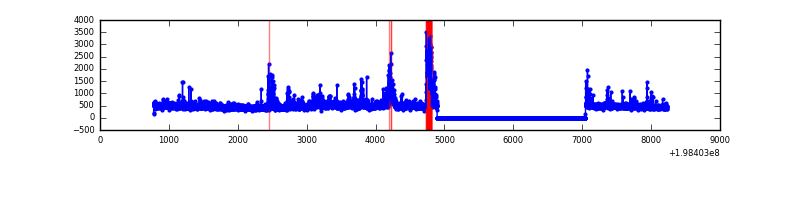 |
| D | 7454 | 5300 | 117 | 117 | 1.57% | 2.21% | 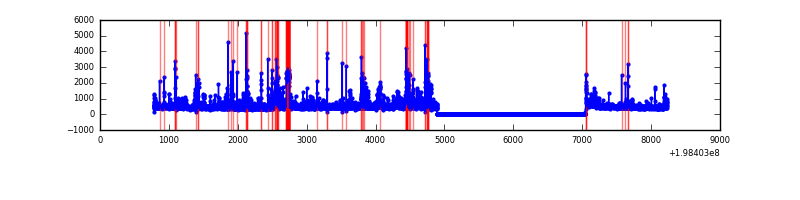 |
Top three noisy pixels from each quadrant. If the there are fewer than three noisy pixels in the level2.evt file, extra rows are filled as -1
| Pixel properties | Quadrant properties | ||||||
|---|---|---|---|---|---|---|---|
| Quadrant | DetID | PixID | Counts | Sigma | Mean | Median | Sigma |
| A | 8 | 15 | 43134 | 346.72 | 605 | 590 | 122.7 |
| A | 0 | 31 | 39510 | 317.18 | 605 | 590 | 122.7 |
| A | 0 | 50 | 8954 | 68.16 | 605 | 590 | 122.7 |
| B | 3 | 175 | 668026 | 5758.38 | 607 | 594 | 115.9 |
| B | 0 | 219 | 58677 | 501.12 | 607 | 594 | 115.9 |
| B | 14 | 50 | 42048 | 357.65 | 607 | 594 | 115.9 |
| C | 1 | 192 | 289759 | 2132.05 | 580 | 583 | 135.6 |
| C | 14 | 223 | 133326 | 978.69 | 580 | 583 | 135.6 |
| C | 6 | 80 | 63515 | 463.99 | 580 | 583 | 135.6 |
| D | 12 | 1 | 148081 | 1094.03 | 574 | 561 | 134.8 |
| D | 1 | 31 | 123279 | 910.1 | 574 | 561 | 134.8 |
| D | 1 | 239 | 107396 | 792.31 | 574 | 561 | 134.8 |
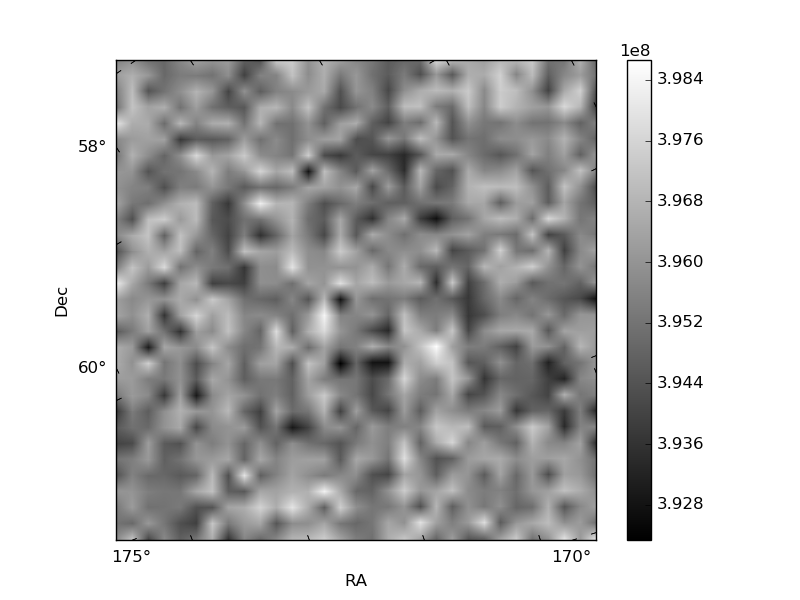
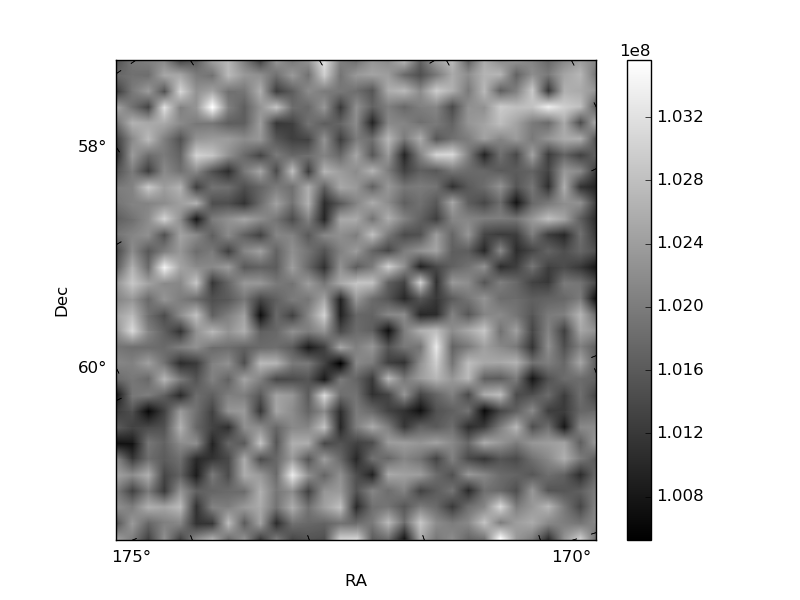
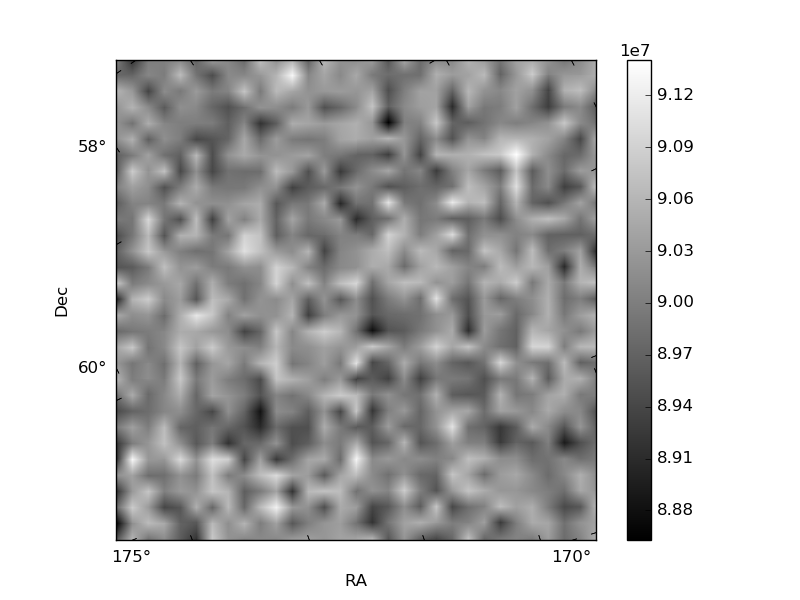
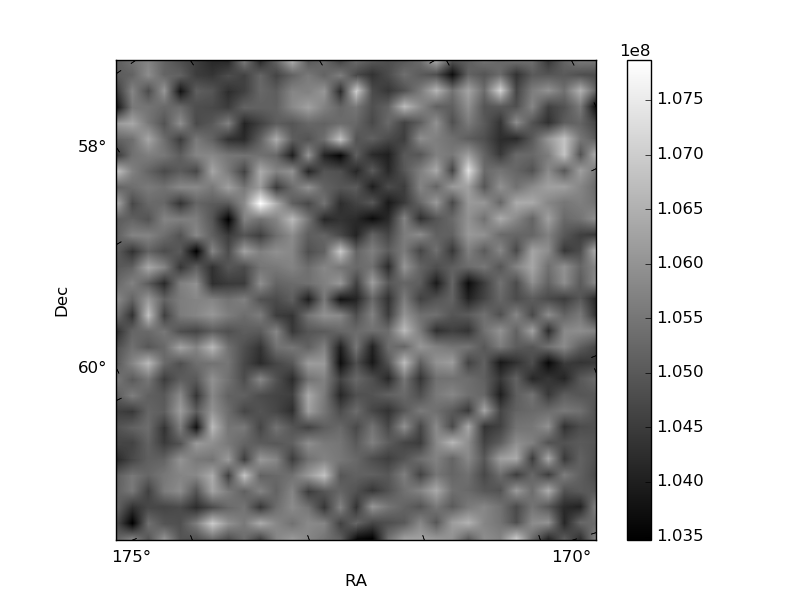
Histogram calculated using DETX and DETY for each event in the final _common_clean file
| Quadrant A | 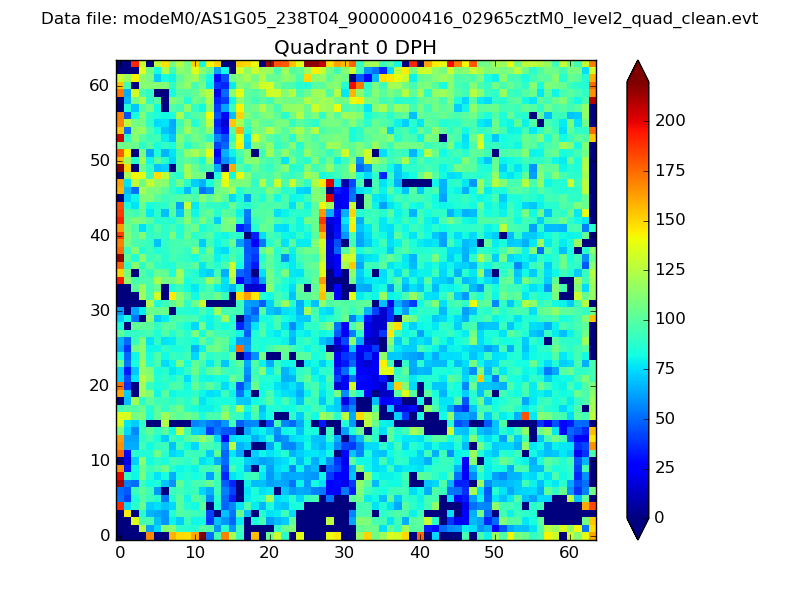 |
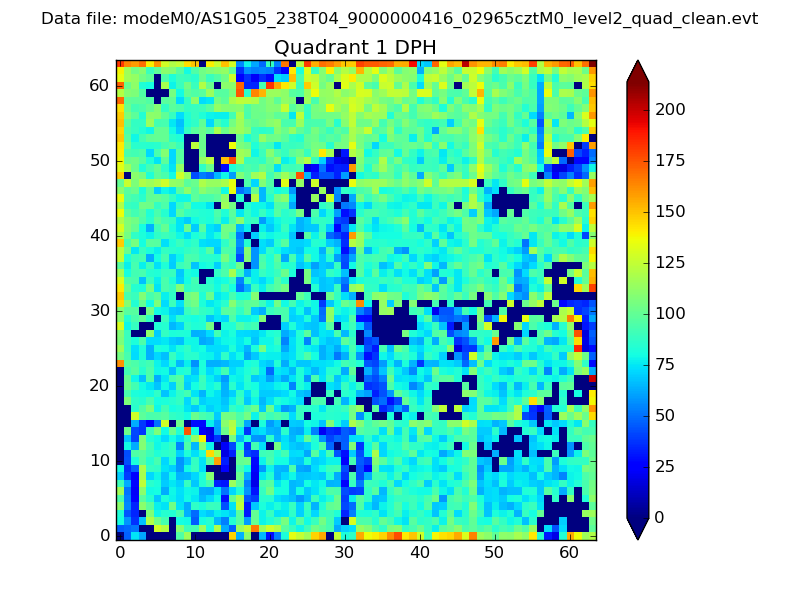 |
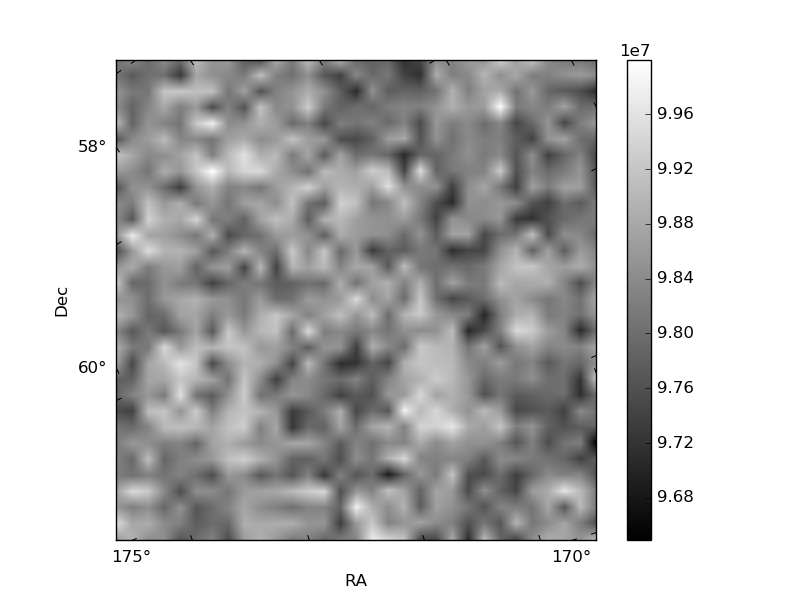
Quadrant B |
|---|---|---|---|
| Quadrant D | 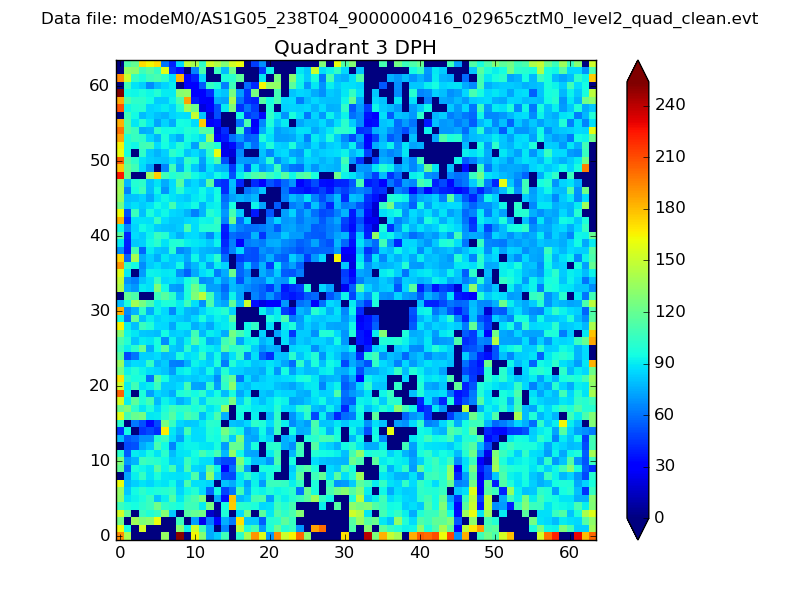 |
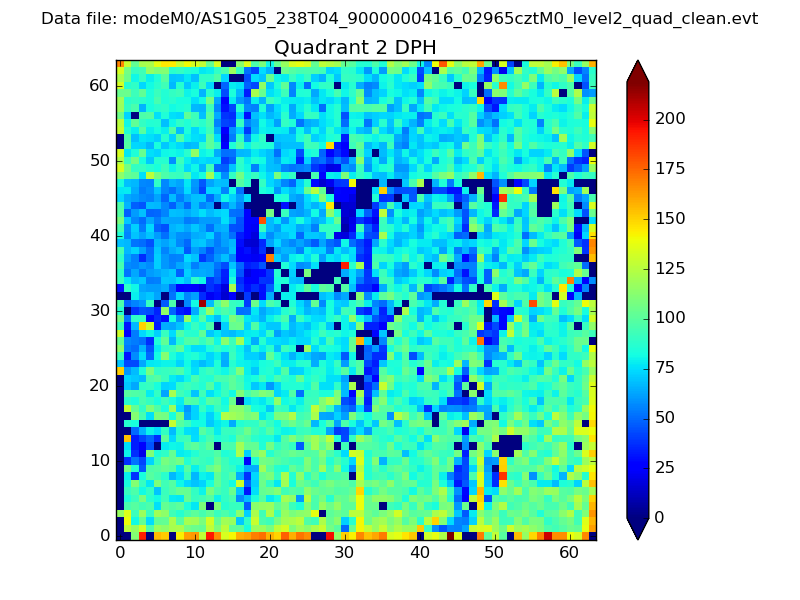 |
Quadrant C |
| Plot type | Count rate plots | Images |
|---|---|---|
| Comparison with Poisson distribution Blue bars denote a histogram of data divided into 1 sec bins. Red curve is a Poisson curve with rate = median count rate of data. |
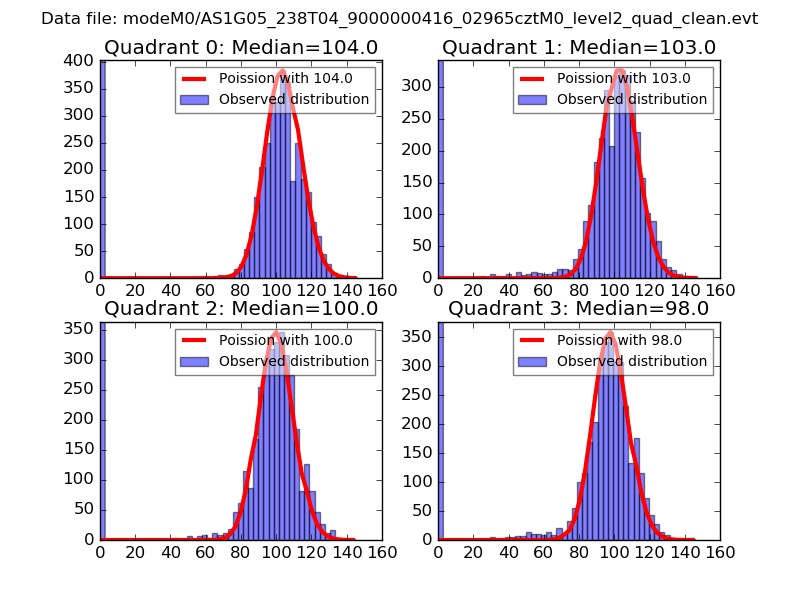 |
 |
| Quadrant-wise count rates Data is divided into 100 sec bins |
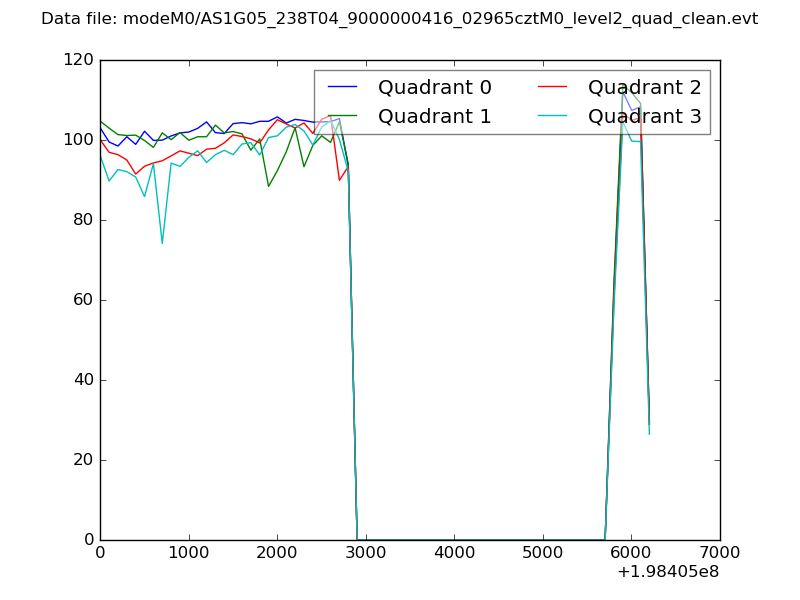 |
|
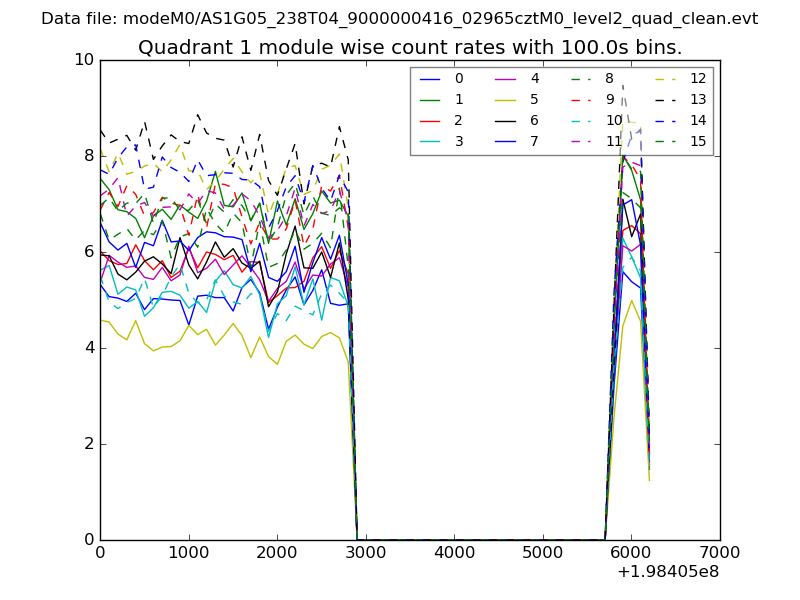
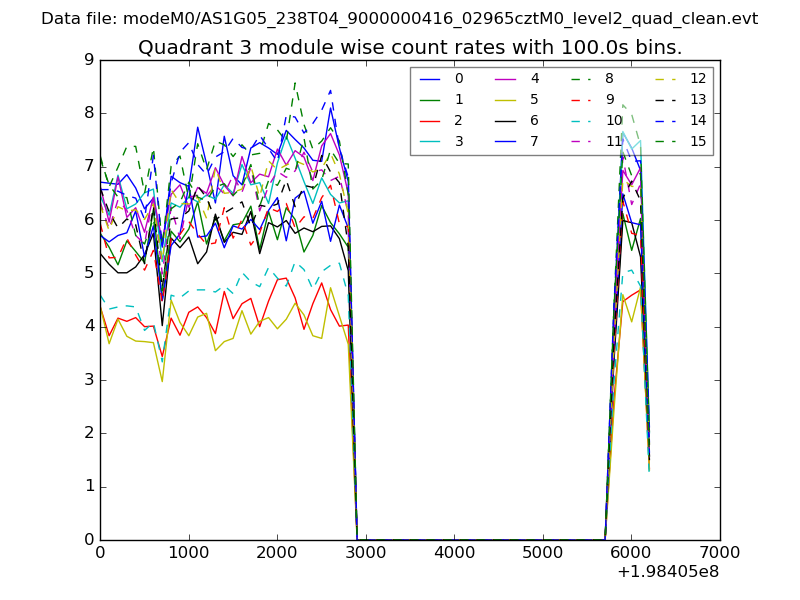
| Module-wise count rates for Quadrant A Data is divided into 100 sec bins |
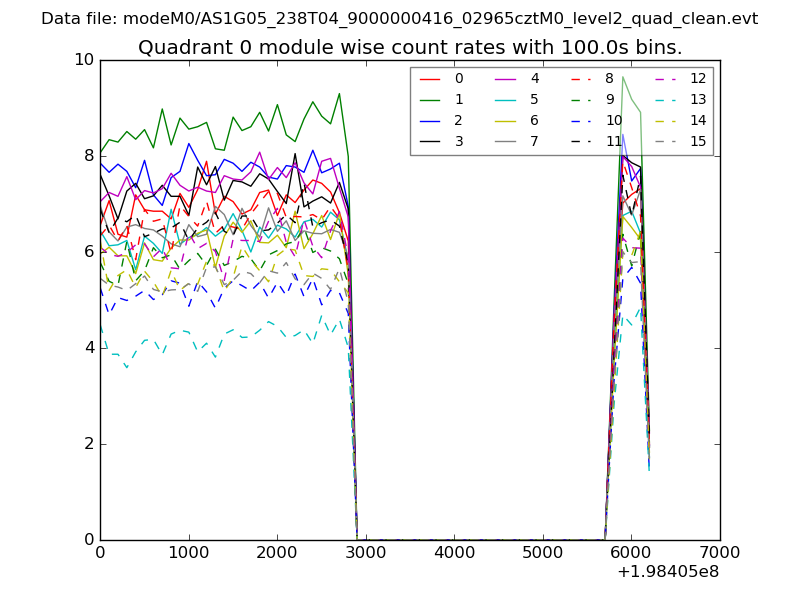 |
 |
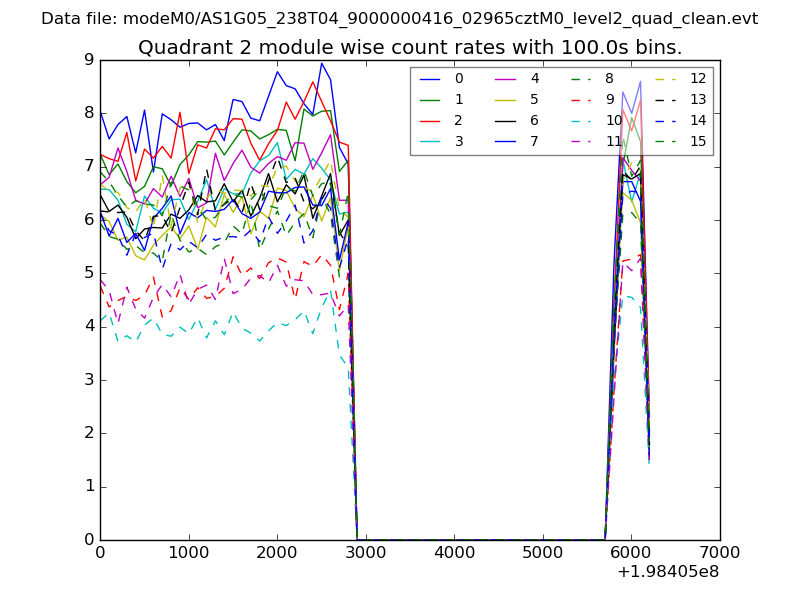
| Module-wise count rates for Quadrant B Data is divided into 100 sec bins |
 |
 |
| Module-wise count rates for Quadrant C Data is divided into 100 sec bins |
 |
 |
| Module-wise count rates for Quadrant D Data is divided into 100 sec bins |
 |
 |
| Parameter | Plot |
|---|---|
| CZT HV Monitor | 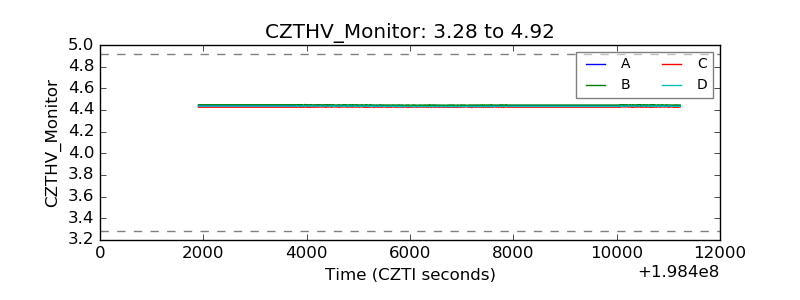 |
| D_VDD | 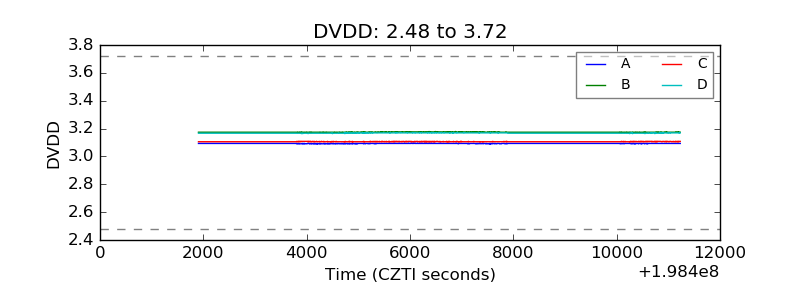 |
| Temperature 1 | 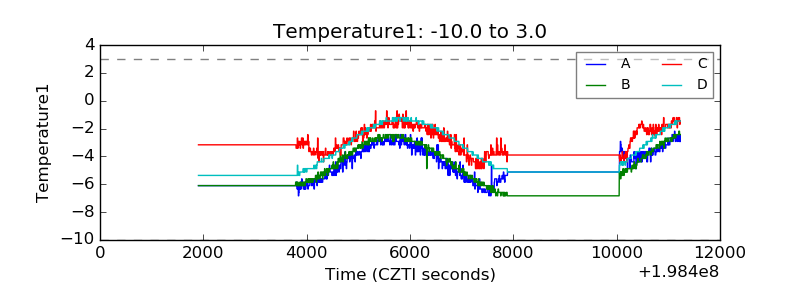 |
| Veto HV Monitor | 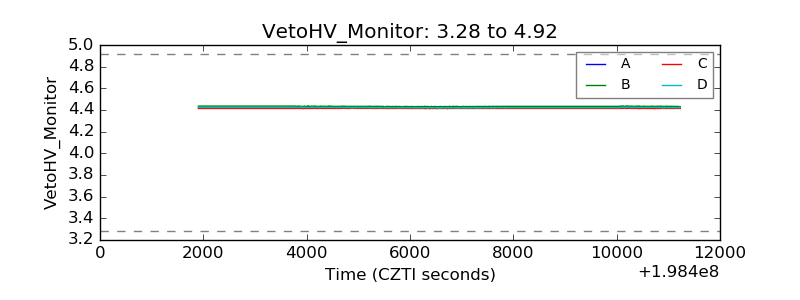 |
| Veto LLD | 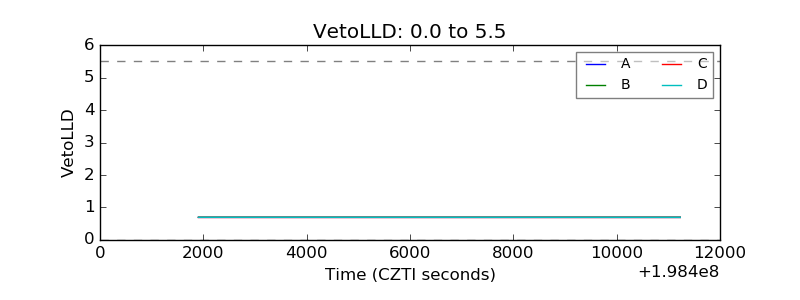 |
| Alpha Counter | 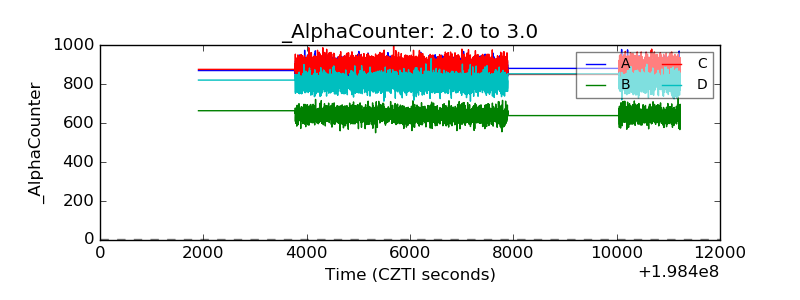 |
| _CPM_Rate | 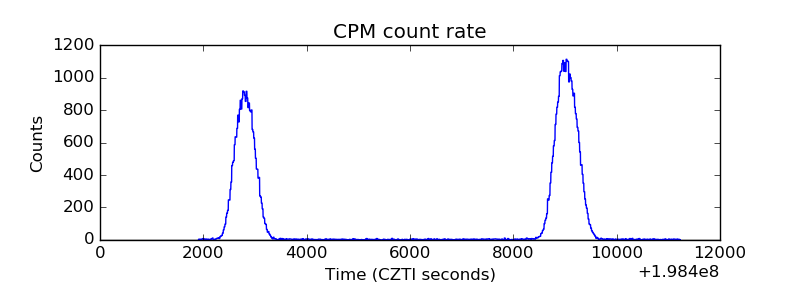 |
| CZT Counter | 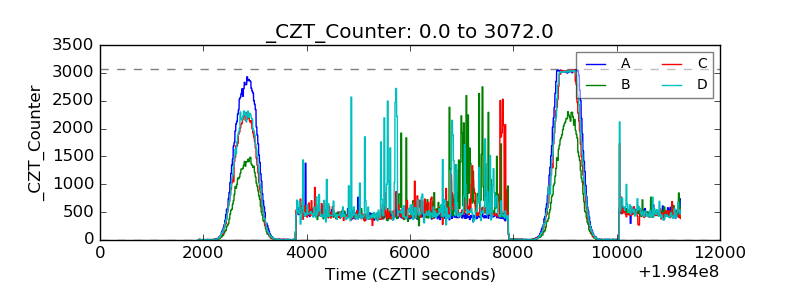 |
| +2.5 Volts monitor |  |
| +5 Volts monitor | 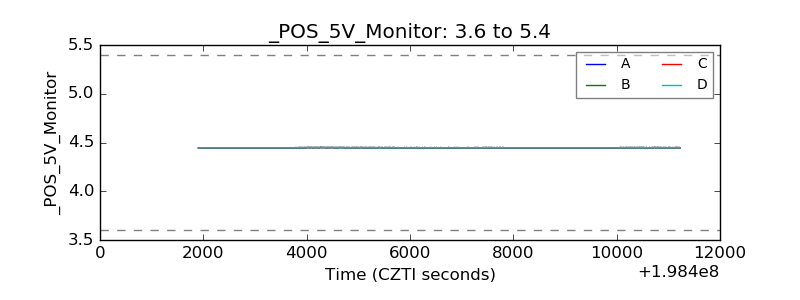 |
| _ROLL_ROT | 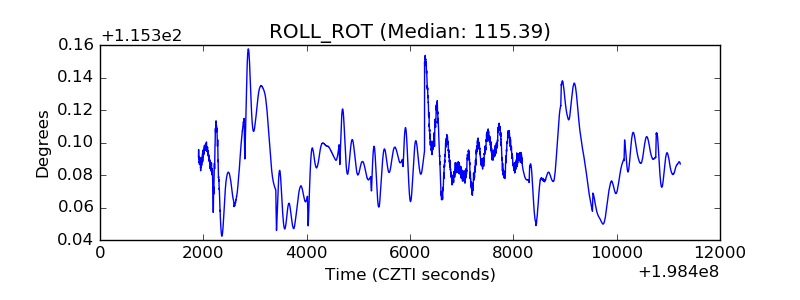 |
| _Roll_DEC | 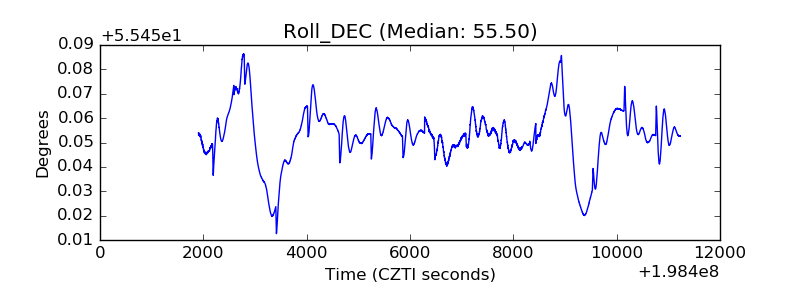 |
| _Roll_RA | 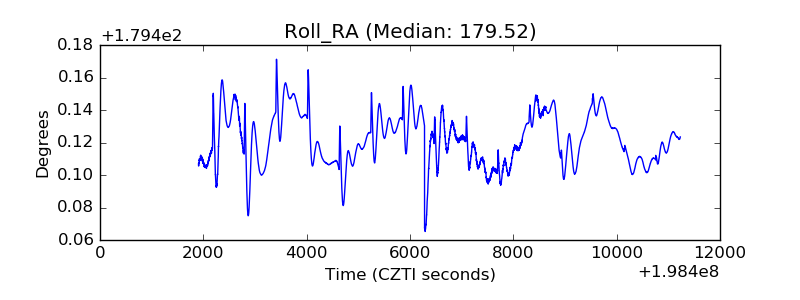 |
| Veto Counter | 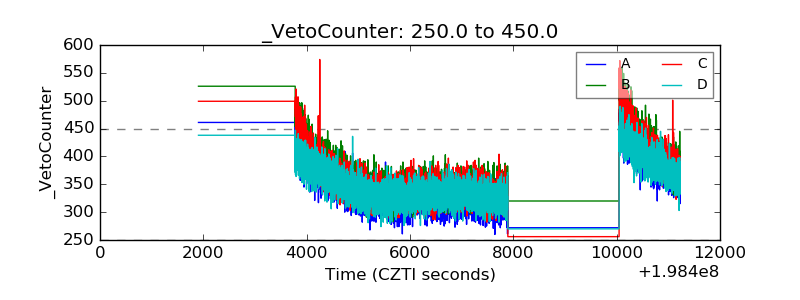 |