| Param | Original file | Final file |
|---|---|---|
| Filename | modeM0/AS1G05_238T04_9000000416_02971cztM0_level2.evt | modeM0/AS1G05_238T04_9000000416_02971cztM0_level2_quad_clean.evt |
| Size (bytes) | 347,290,560 | 55,103,040 |
| Size | 331.2 MB | 52.6 MB |
| Events in quadrant A | 2,507,177 | 330,916 |
| Events in quadrant B | 2,239,113 | 330,558 |
| Events in quadrant C | 2,108,118 | 337,361 |
| Events in quadrant D | 3,329,252 | 325,401 |
| Mode M0 | |||
|---|---|---|---|
| Quadrant | BADHDUFLAG | Total packets | Discarded packets |
| A | 0 | 10753 | 3 |
| B | 0 | 10395 | 2 |
| C | 0 | 10105 | 2 |
| D | 0 | 13260 | 2 |
| Mode SS | |||
|---|---|---|---|
| Quadrant | BADHDUFLAG | Total packets | Discarded packets |
| A | 0 | 102 | 0 |
| B | 0 | 102 | 0 |
| C | 0 | 102 | 0 |
| D | 0 | 102 | 0 |
| Mode M9 | |||
|---|---|---|---|
| Quadrant | BADHDUFLAG | Total packets | Discarded packets |
| A | 0 | 30 | 0 |
| B | 0 | 30 | 0 |
| C | 0 | 30 | 0 |
| D | 0 | 31 | 0 |
| Quadrant | Total seconds | Saturated seconds | Saturation percentage |
|---|---|---|---|
| A | 4897 | 36 | 0.735144% |
| B | 4897 | 32 | 0.653461% |
| C | 4897 | 20 | 0.408413% |
| D | 4897 | 117 | 2.389218% |
Noise dominated data is calculated using 1-second bins in cleaned event files. If a bin has >2000 counts, and if more than 50% of those come from <1% of pixels, then it is considered to be noise-dominated and hence unusable.
| Quadrant | # 1 sec bins | Bins with >0 counts | Bins with >2000 counts | High rate bins dominated by noise | Noise dominated (total time) | Noise dominated (detector-on time) | Marked lightcurve |
|---|---|---|---|---|---|---|---|
| A | 7053 | 4898 | 25 | 25 | 0.35% | 0.51% | 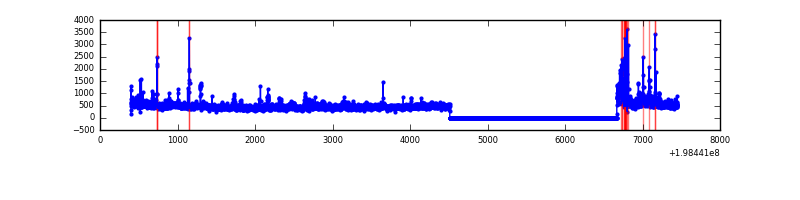 |
| B | 7053 | 4898 | 20 | 20 | 0.28% | 0.41% | 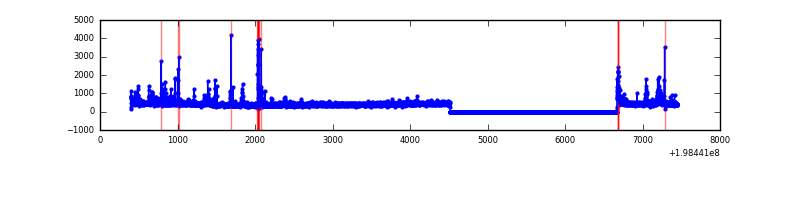 |
| C | 7053 | 4898 | 17 | 17 | 0.24% | 0.35% | 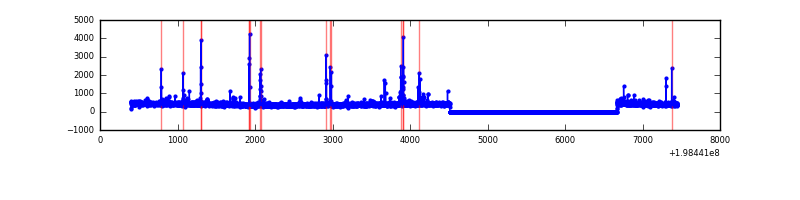 |
| D | 7053 | 4898 | 111 | 111 | 1.57% | 2.27% | 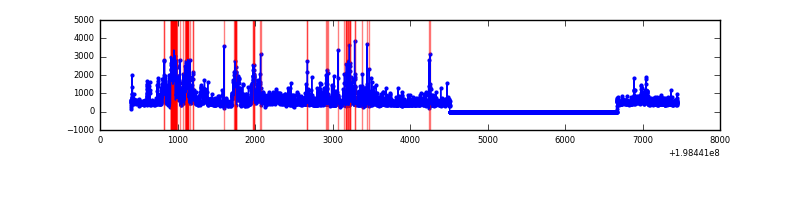 |
Top three noisy pixels from each quadrant. If the there are fewer than three noisy pixels in the level2.evt file, extra rows are filled as -1
| Pixel properties | Quadrant properties | ||||||
|---|---|---|---|---|---|---|---|
| Quadrant | DetID | PixID | Counts | Sigma | Mean | Median | Sigma |
| A | 13 | 9 | 356095 | 3459.82 | 499 | 487 | 102.8 |
| A | 8 | 15 | 140876 | 1365.89 | 499 | 487 | 102.8 |
| A | 0 | 31 | 21520 | 204.64 | 499 | 487 | 102.8 |
| B | 2 | 249 | 75576 | 757.74 | 511 | 498 | 99.1 |
| B | 0 | 219 | 60748 | 608.09 | 511 | 498 | 99.1 |
| B | 4 | 81 | 37407 | 372.51 | 511 | 498 | 99.1 |
| C | 6 | 80 | 85644 | 723.43 | 497 | 499 | 117.7 |
| C | 10 | 31 | 23225 | 193.09 | 497 | 499 | 117.7 |
| C | 15 | 208 | 12631 | 103.08 | 497 | 499 | 117.7 |
| D | 13 | 114 | 695997 | 5961.68 | 485 | 473 | 116.7 |
| D | 15 | 35 | 202858 | 1734.74 | 485 | 473 | 116.7 |
| D | 9 | 35 | 82763 | 705.35 | 485 | 473 | 116.7 |
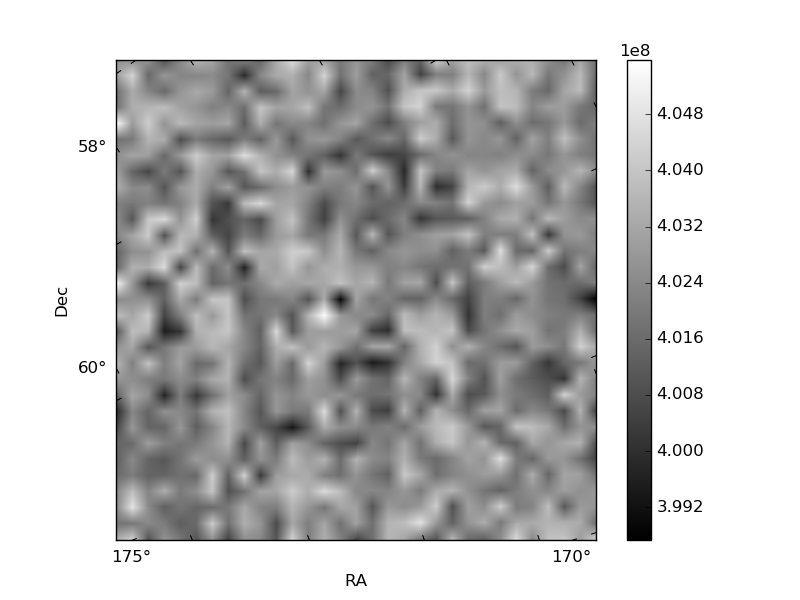
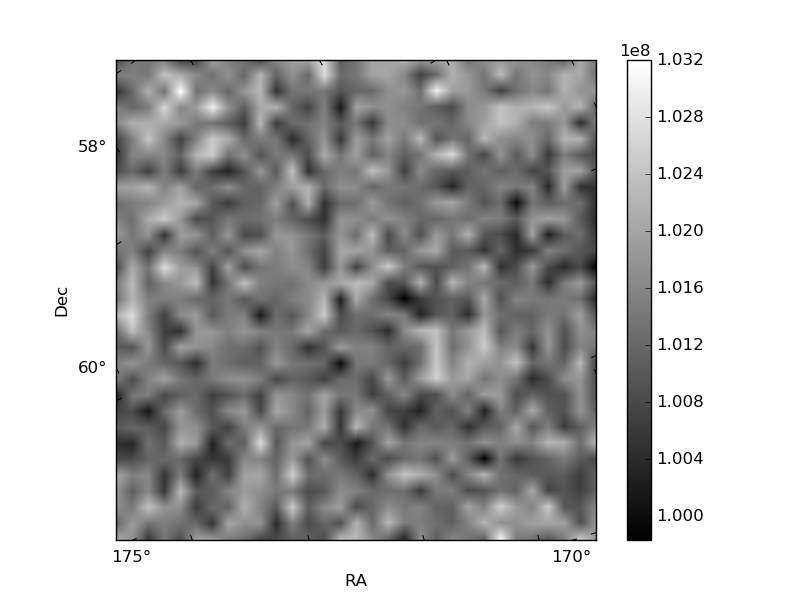
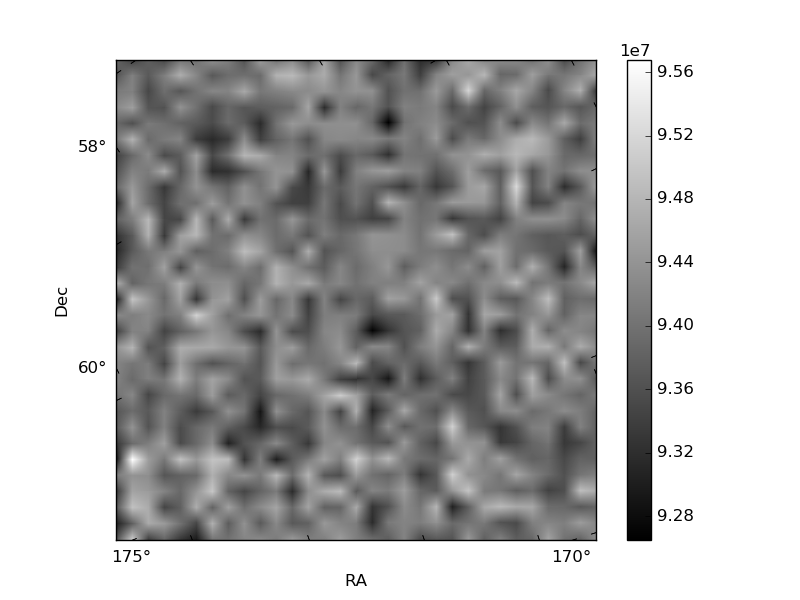
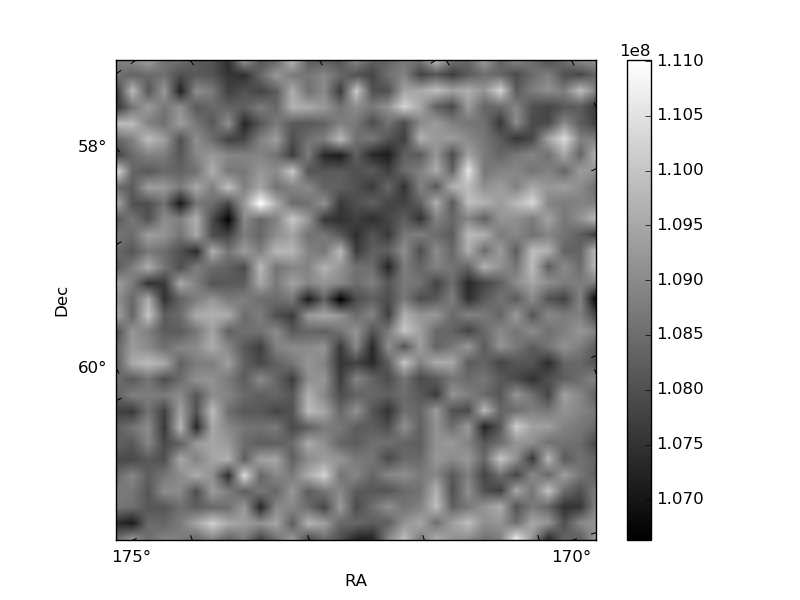
Histogram calculated using DETX and DETY for each event in the final _common_clean file
| Quadrant A | 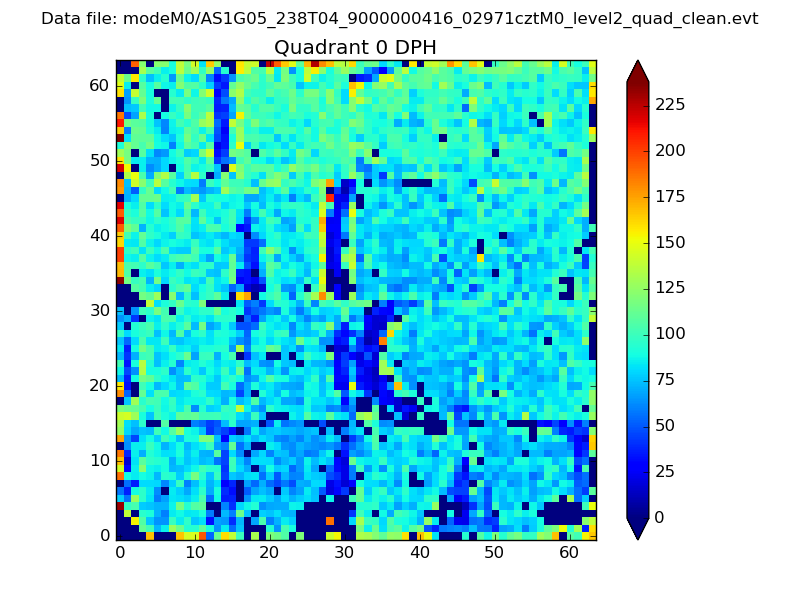 |
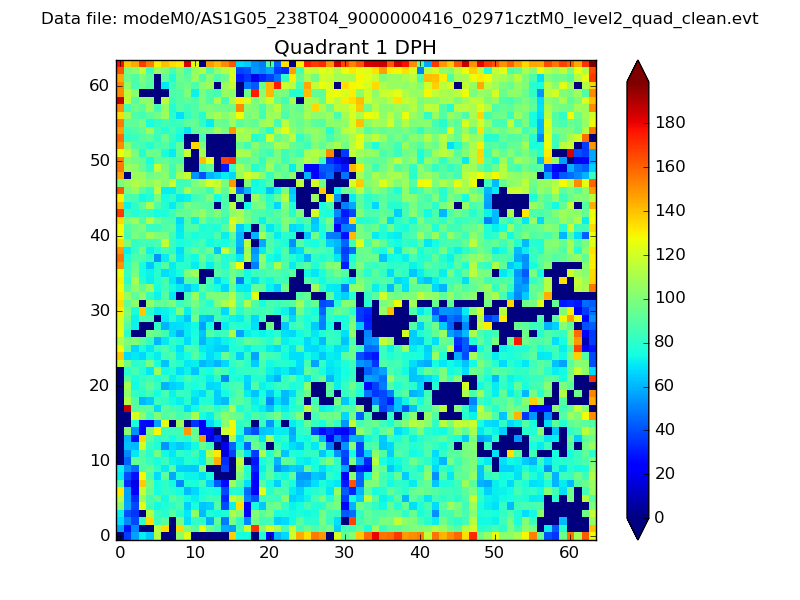 |
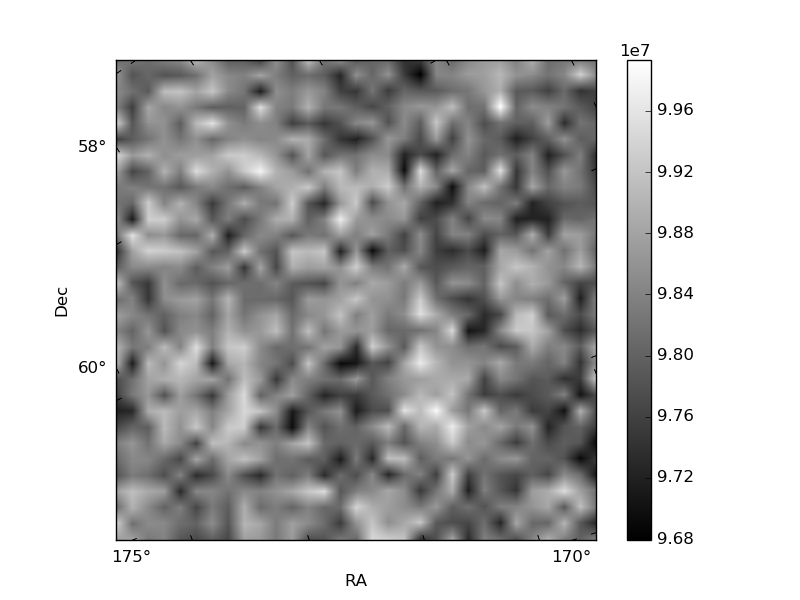
Quadrant B |
|---|---|---|---|
| Quadrant D | 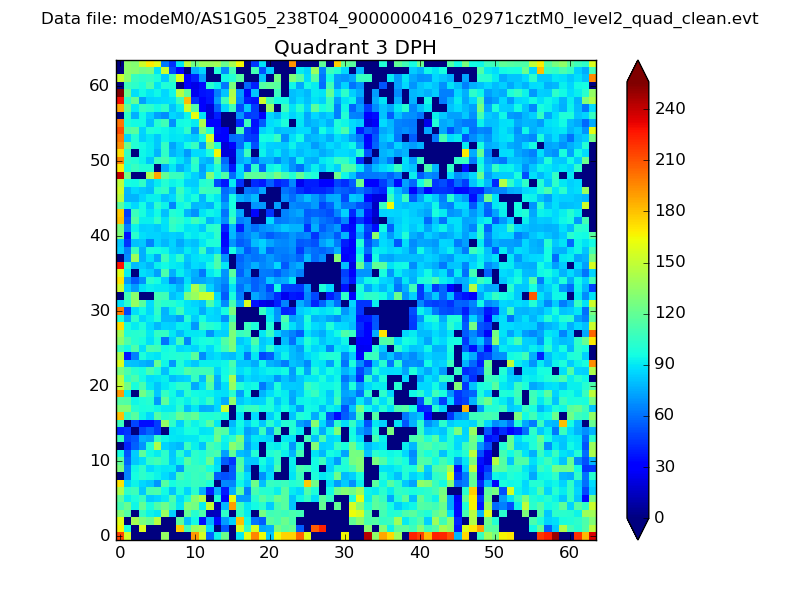 |
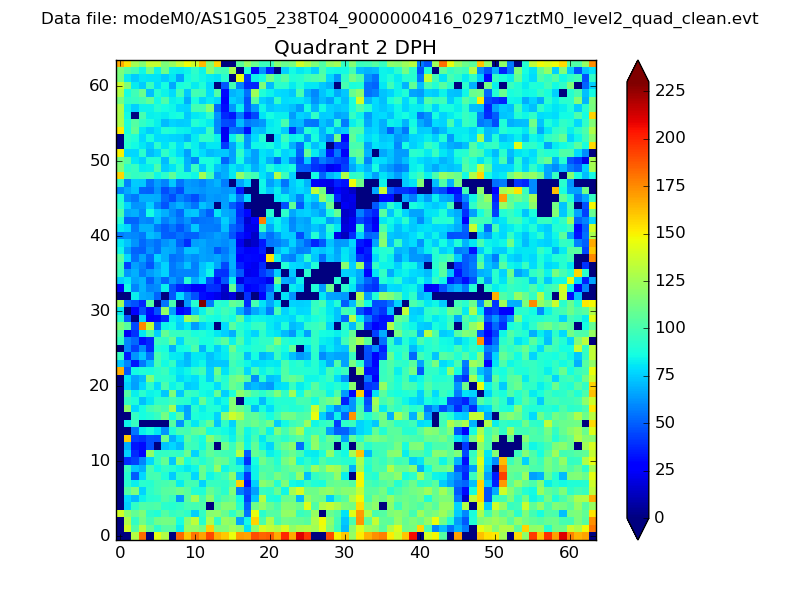 |
Quadrant C |
| Plot type | Count rate plots | Images |
|---|---|---|
| Comparison with Poisson distribution Blue bars denote a histogram of data divided into 1 sec bins. Red curve is a Poisson curve with rate = median count rate of data. |
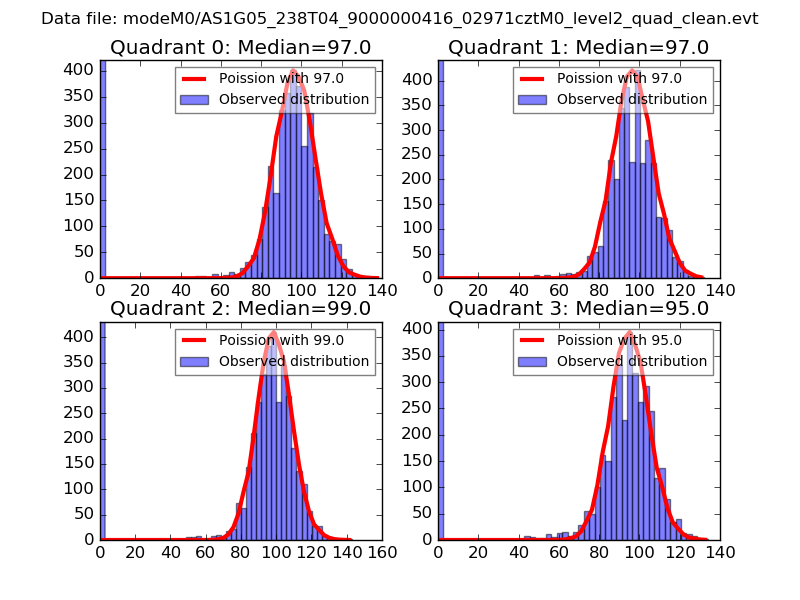 |
 |
| Quadrant-wise count rates Data is divided into 100 sec bins |
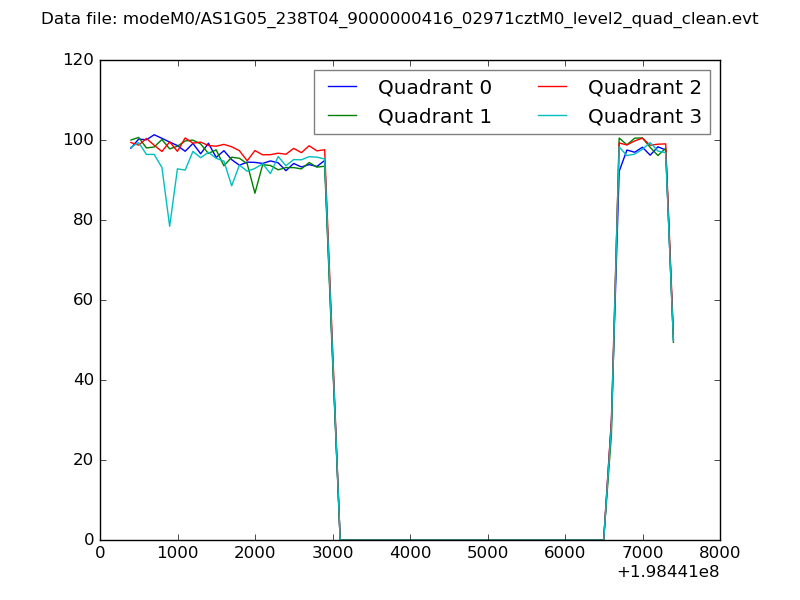 |
|
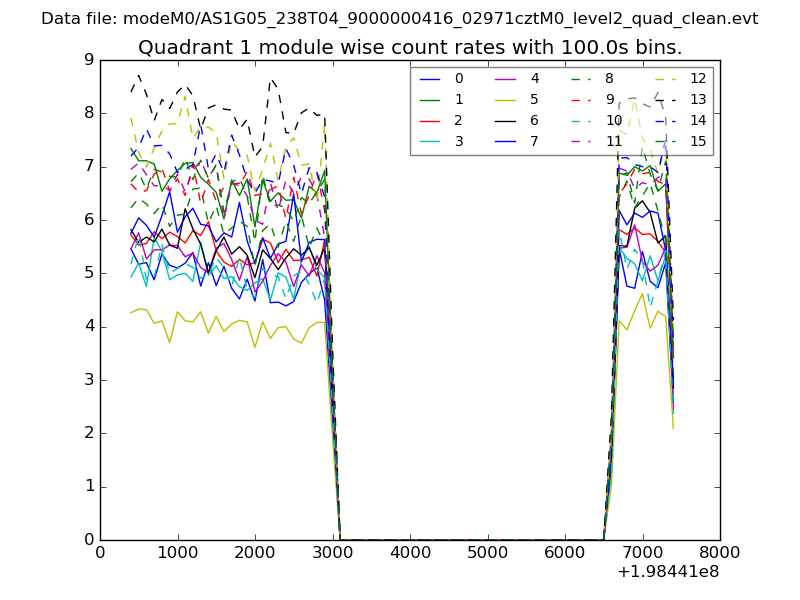
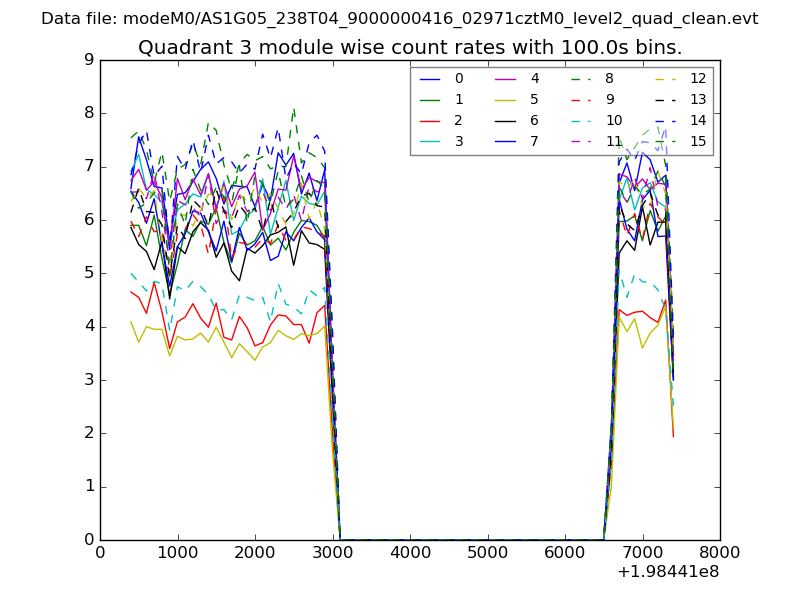
| Module-wise count rates for Quadrant A Data is divided into 100 sec bins |
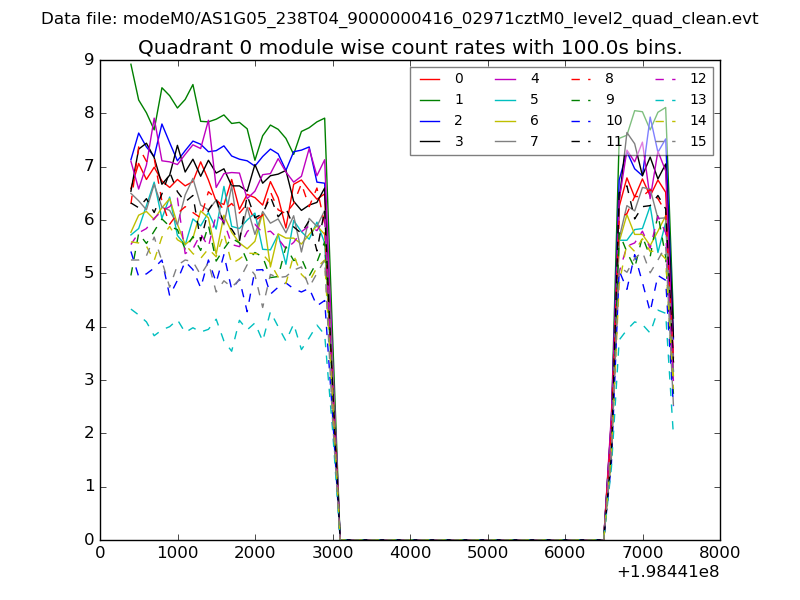 |
 |
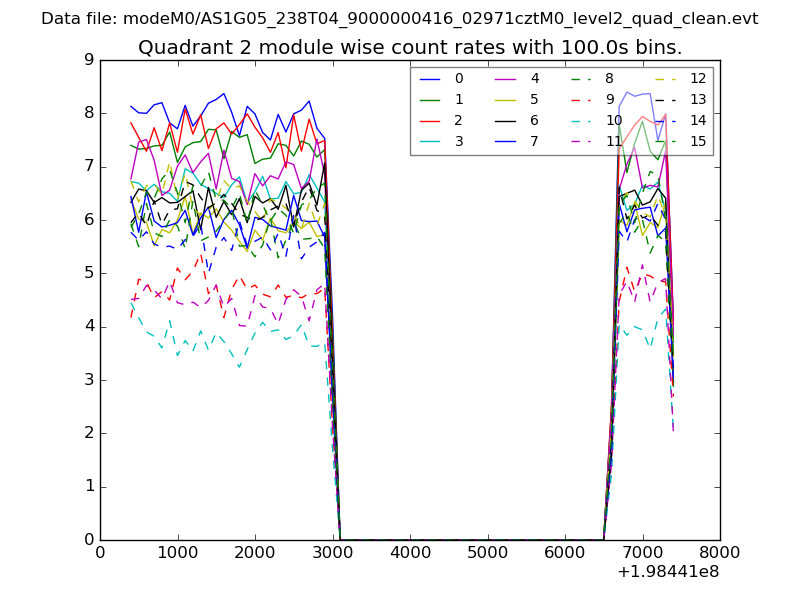
| Module-wise count rates for Quadrant B Data is divided into 100 sec bins |
 |
 |
| Module-wise count rates for Quadrant C Data is divided into 100 sec bins |
 |
 |
| Module-wise count rates for Quadrant D Data is divided into 100 sec bins |
 |
 |
| Parameter | Plot |
|---|---|
| CZT HV Monitor | 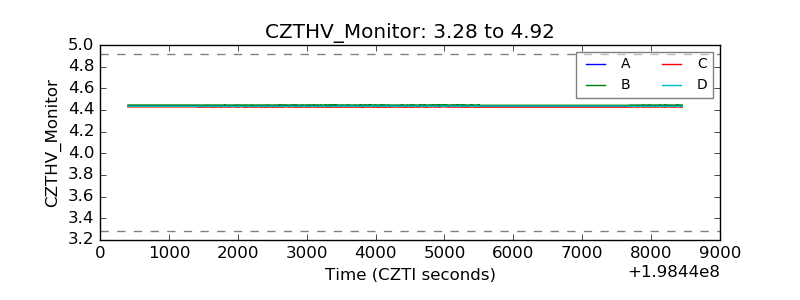 |
| D_VDD | 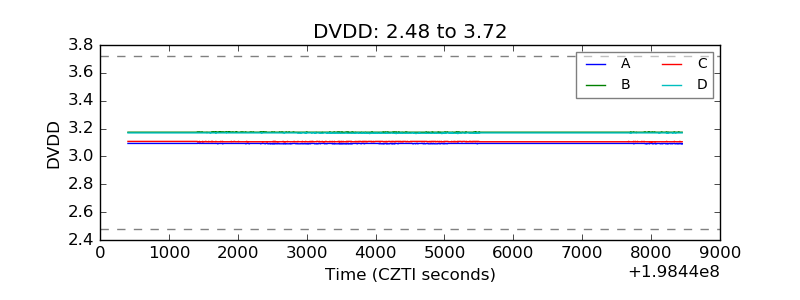 |
| Temperature 1 | 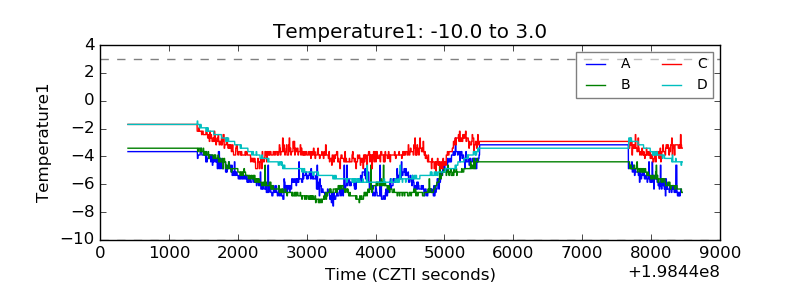 |
| Veto HV Monitor | 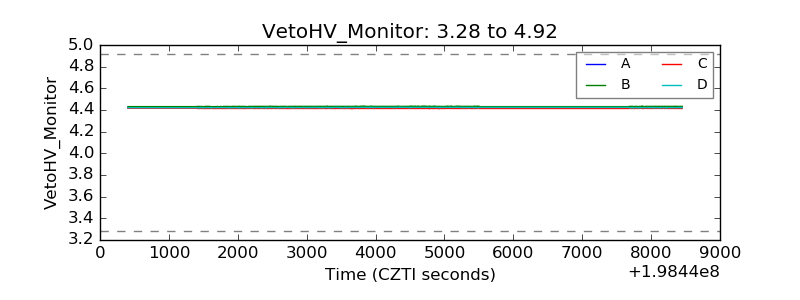 |
| Veto LLD | 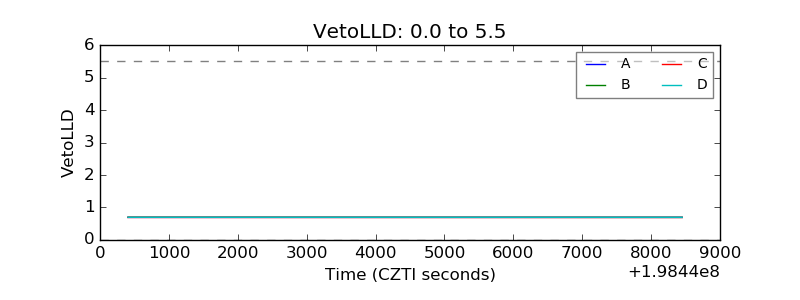 |
| Alpha Counter | 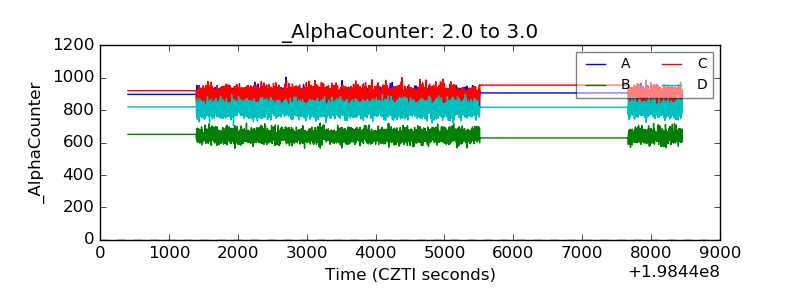 |
| _CPM_Rate | 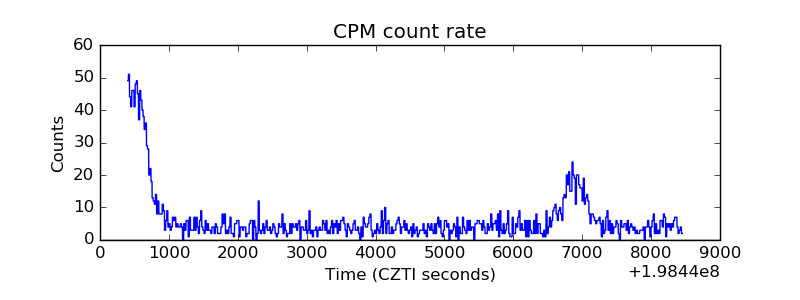 |
| CZT Counter | 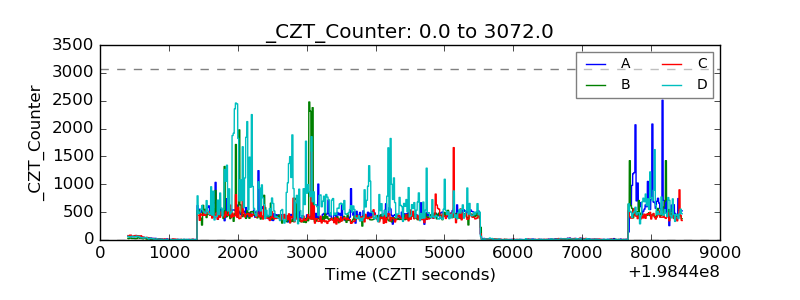 |
| +2.5 Volts monitor |  |
| +5 Volts monitor |  |
| _ROLL_ROT | 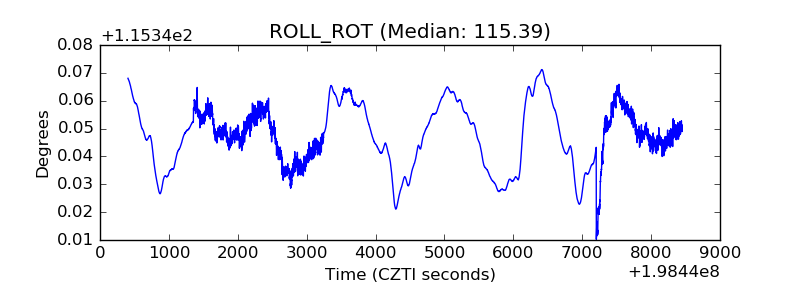 |
| _Roll_DEC | 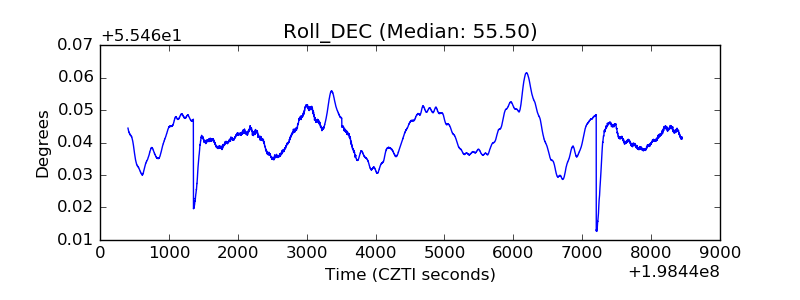 |
| _Roll_RA | 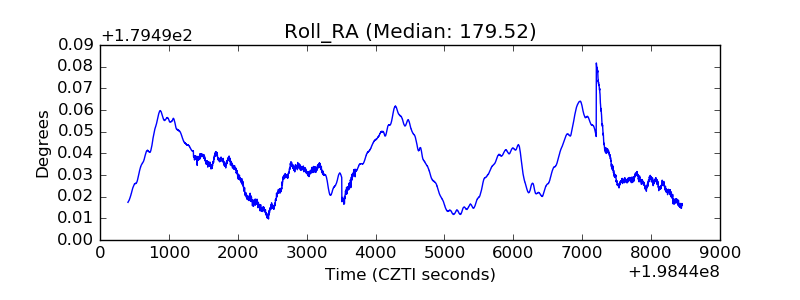 |
| Veto Counter | 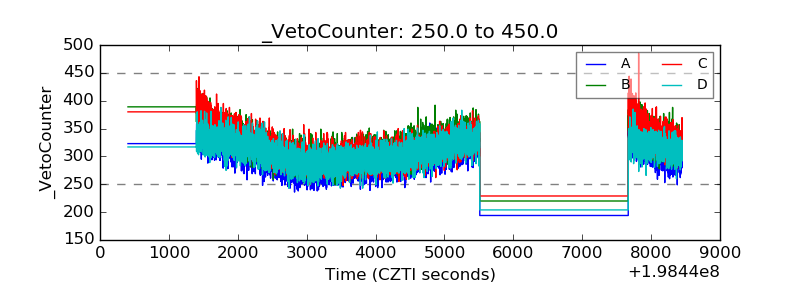 |