| Param | Original file | Final file |
|---|---|---|
| Filename | modeM0/AS1G05_238T04_9000000416_02972cztM0_level2.evt | modeM0/AS1G05_238T04_9000000416_02972cztM0_level2_quad_clean.evt |
| Size (bytes) | 342,613,440 | 51,586,560 |
| Size | 326.7 MB | 49.2 MB |
| Events in quadrant A | 2,776,873 | 299,059 |
| Events in quadrant B | 2,252,312 | 301,407 |
| Events in quadrant C | 2,080,403 | 308,979 |
| Events in quadrant D | 2,924,289 | 299,968 |
| Mode M0 | |||
|---|---|---|---|
| Quadrant | BADHDUFLAG | Total packets | Discarded packets |
| A | 0 | 11775 | 3 |
| B | 0 | 10547 | 2 |
| C | 0 | 10195 | 2 |
| D | 0 | 12236 | 2 |
| Mode SS | |||
|---|---|---|---|
| Quadrant | BADHDUFLAG | Total packets | Discarded packets |
| A | 0 | 102 | 0 |
| B | 0 | 102 | 0 |
| C | 0 | 102 | 0 |
| D | 0 | 102 | 0 |
| Mode M9 | |||
|---|---|---|---|
| Quadrant | BADHDUFLAG | Total packets | Discarded packets |
| A | 0 | 33 | 0 |
| B | 0 | 33 | 0 |
| C | 0 | 33 | 0 |
| D | 0 | 34 | 0 |
| Quadrant | Total seconds | Saturated seconds | Saturation percentage |
|---|---|---|---|
| A | 5025 | 44 | 0.875622% |
| B | 5025 | 21 | 0.417910% |
| C | 5025 | 5 | 0.099502% |
| D | 5025 | 26 | 0.517413% |
Noise dominated data is calculated using 1-second bins in cleaned event files. If a bin has >2000 counts, and if more than 50% of those come from <1% of pixels, then it is considered to be noise-dominated and hence unusable.
| Quadrant | # 1 sec bins | Bins with >0 counts | Bins with >2000 counts | High rate bins dominated by noise | Noise dominated (total time) | Noise dominated (detector-on time) | Marked lightcurve |
|---|---|---|---|---|---|---|---|
| A | 7181 | 5026 | 32 | 32 | 0.45% | 0.64% | 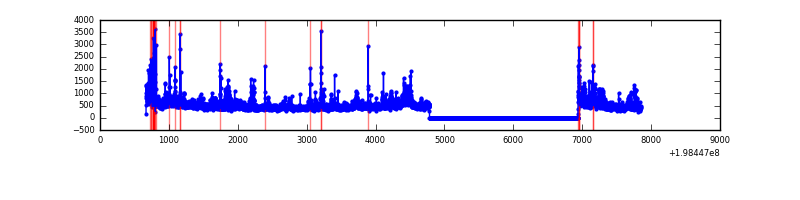 |
| B | 7181 | 5026 | 11 | 11 | 0.15% | 0.22% | 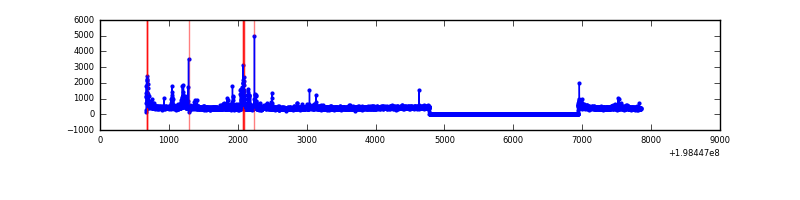 |
| C | 7181 | 5026 | 2 | 2 | 0.03% | 0.04% | 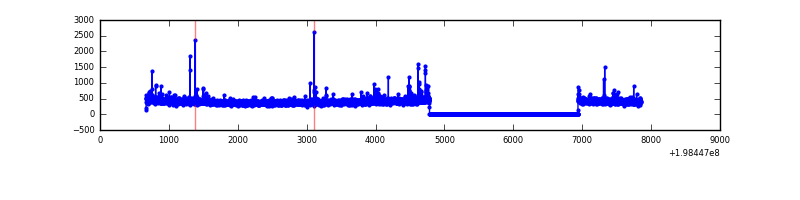 |
| D | 7181 | 5026 | 31 | 31 | 0.43% | 0.62% | 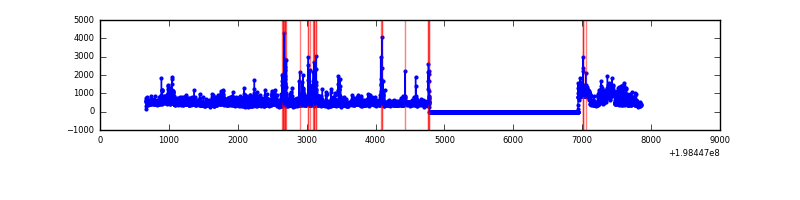 |
Top three noisy pixels from each quadrant. If the there are fewer than three noisy pixels in the level2.evt file, extra rows are filled as -1
| Pixel properties | Quadrant properties | ||||||
|---|---|---|---|---|---|---|---|
| Quadrant | DetID | PixID | Counts | Sigma | Mean | Median | Sigma |
| A | 13 | 9 | 571004 | 5479.84 | 504 | 494 | 104.1 |
| A | 8 | 15 | 95552 | 913.05 | 504 | 494 | 104.1 |
| A | 14 | 63 | 65607 | 625.42 | 504 | 494 | 104.1 |
| B | 14 | 50 | 85362 | 834.57 | 521 | 508 | 101.7 |
| B | 0 | 219 | 69111 | 674.74 | 521 | 508 | 101.7 |
| B | 2 | 249 | 52888 | 515.18 | 521 | 508 | 101.7 |
| C | 6 | 80 | 32542 | 269.6 | 504 | 505 | 118.8 |
| C | 8 | 162 | 24895 | 205.25 | 504 | 505 | 118.8 |
| C | 15 | 208 | 11397 | 91.66 | 504 | 505 | 118.8 |
| D | 13 | 114 | 430655 | 3649.92 | 494 | 482 | 117.9 |
| D | 2 | 209 | 333147 | 2822.59 | 494 | 482 | 117.9 |
| D | 13 | 239 | 55802 | 469.38 | 494 | 482 | 117.9 |
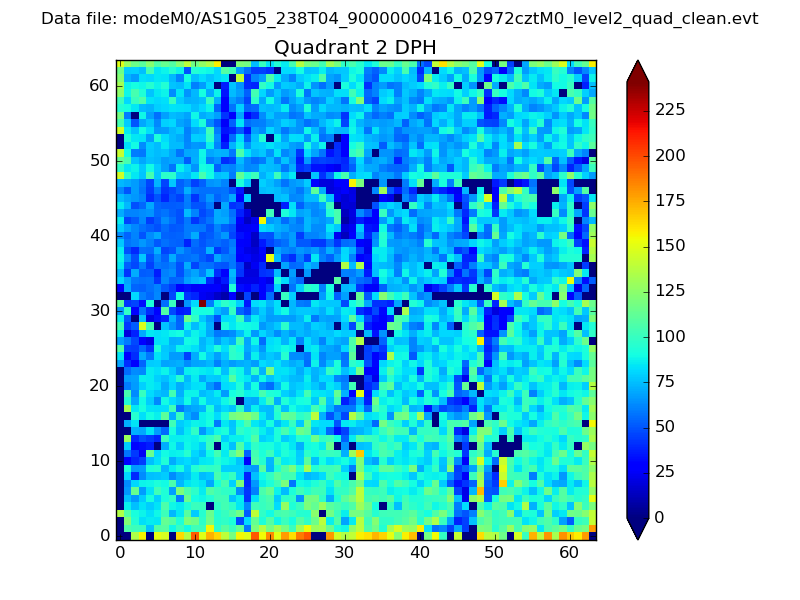
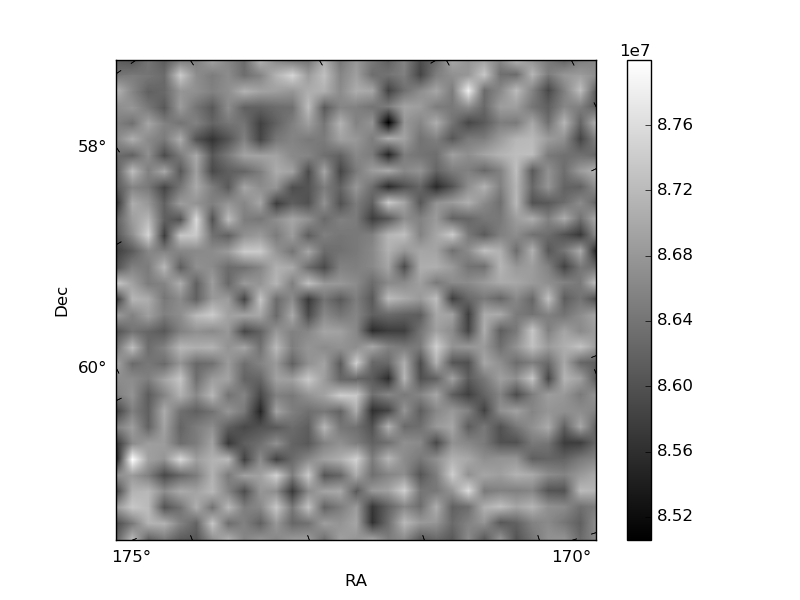
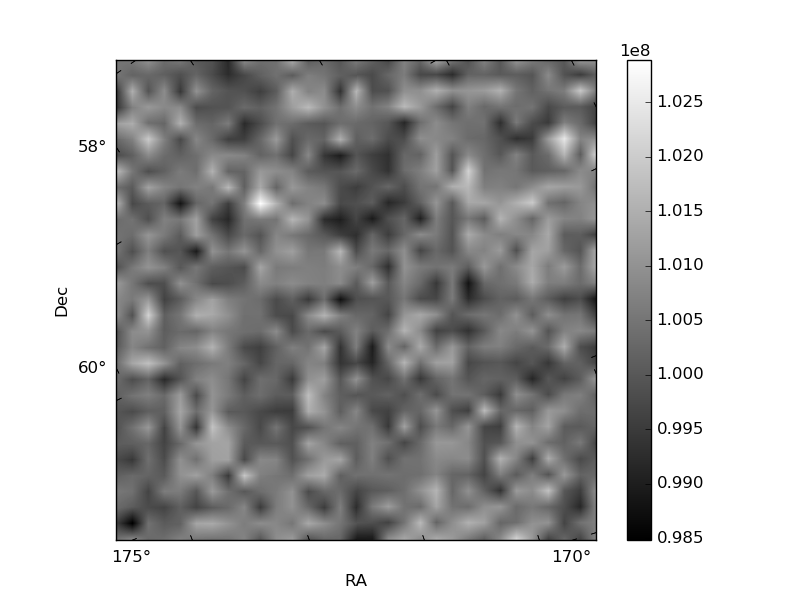
Histogram calculated using DETX and DETY for each event in the final _common_clean file
| Quadrant A | 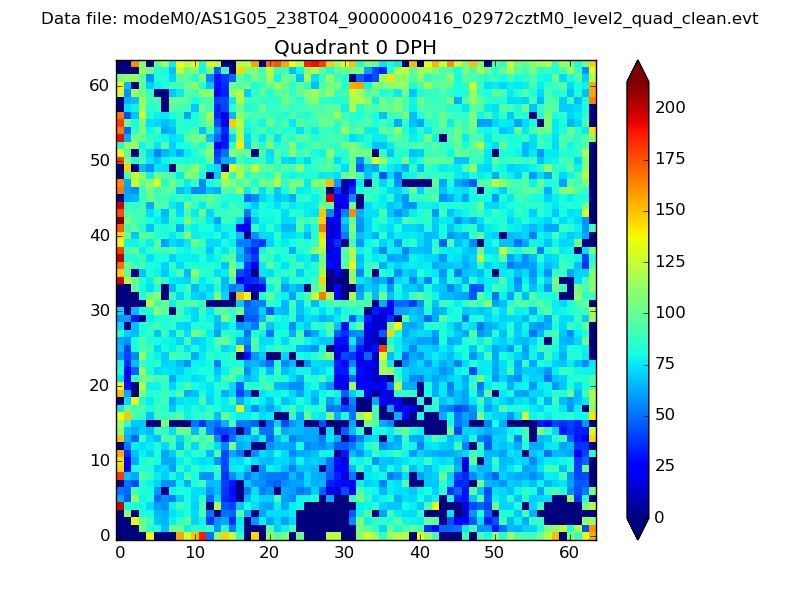 |
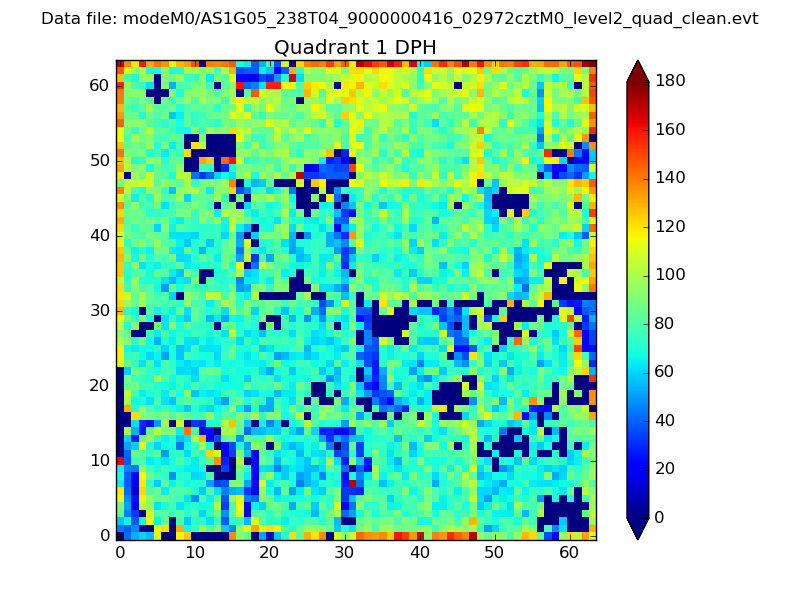 |
Quadrant B |
|---|---|---|---|
| Quadrant D | 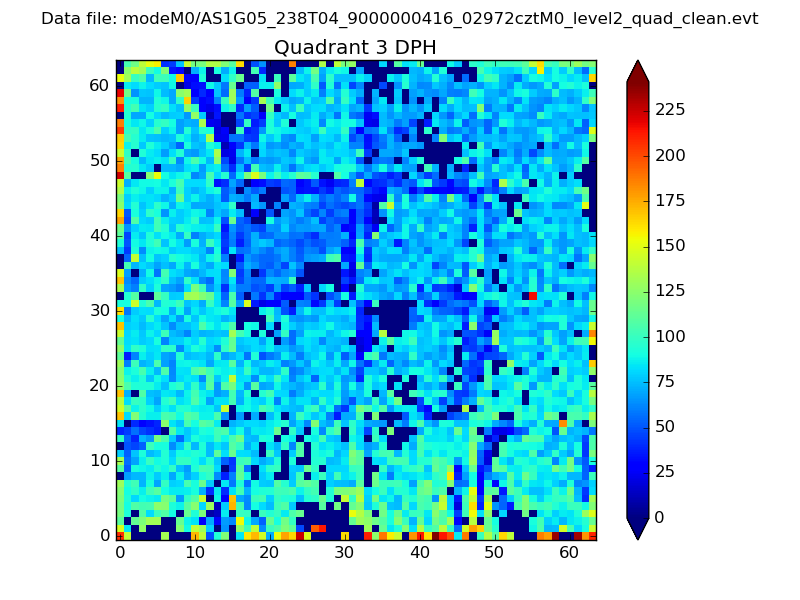 |
 |
Quadrant C |
| Plot type | Count rate plots | Images |
|---|---|---|
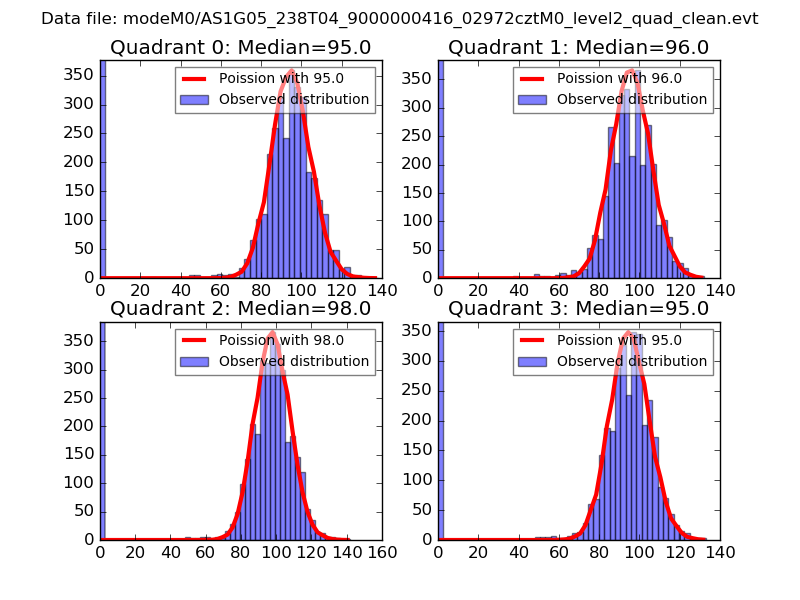
| Comparison with Poisson distribution Blue bars denote a histogram of data divided into 1 sec bins. Red curve is a Poisson curve with rate = median count rate of data. |
 |
 |
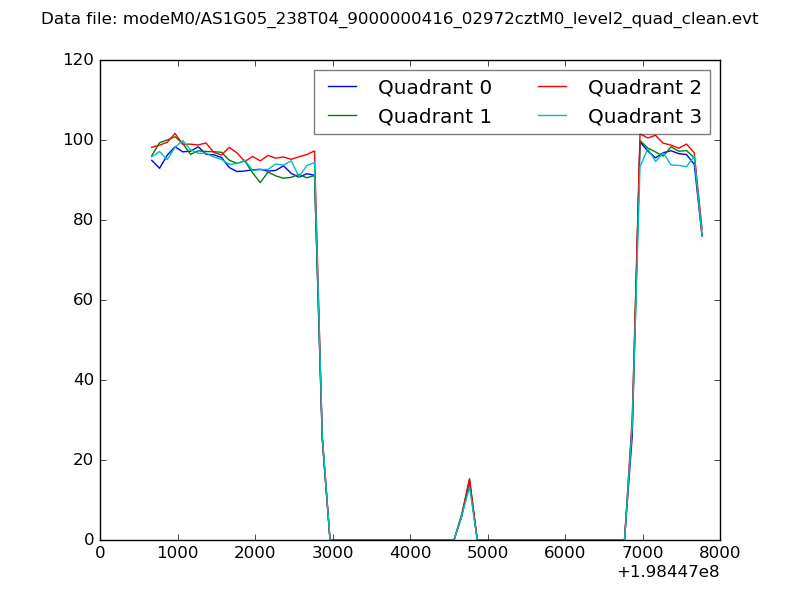
| Quadrant-wise count rates Data is divided into 100 sec bins |
 |
|
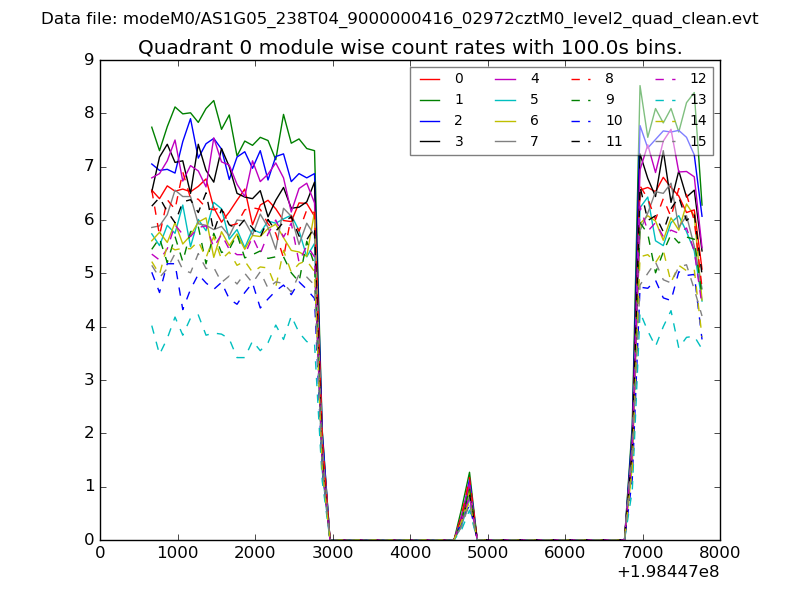
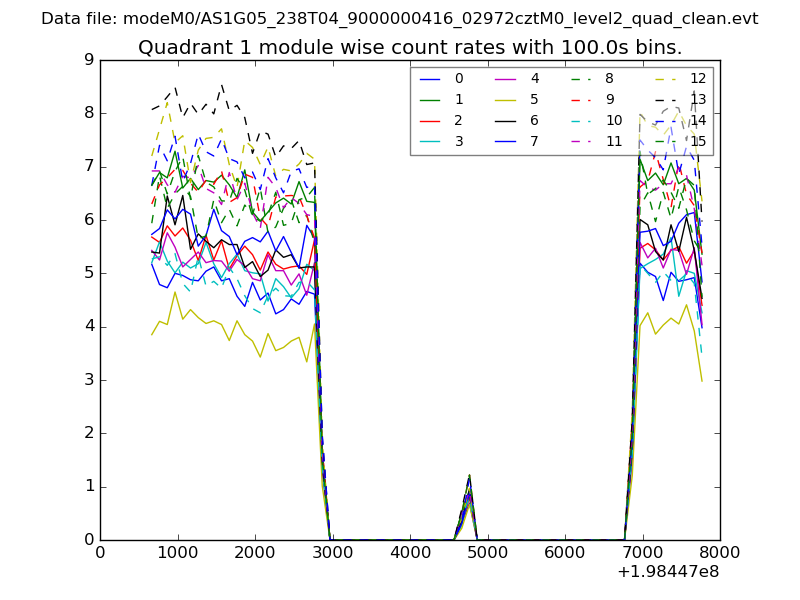
| Module-wise count rates for Quadrant A Data is divided into 100 sec bins |
 |
 |
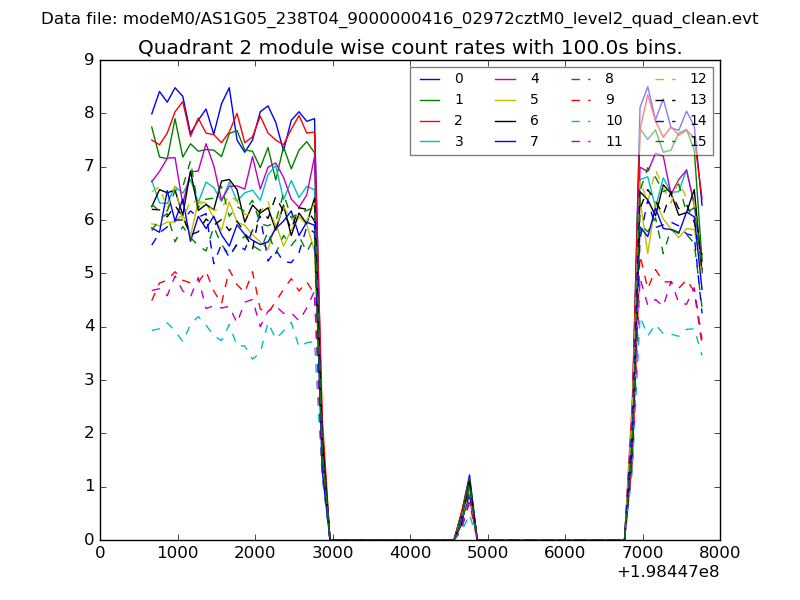
| Module-wise count rates for Quadrant B Data is divided into 100 sec bins |
 |
 |
| Module-wise count rates for Quadrant C Data is divided into 100 sec bins |
 |
 |
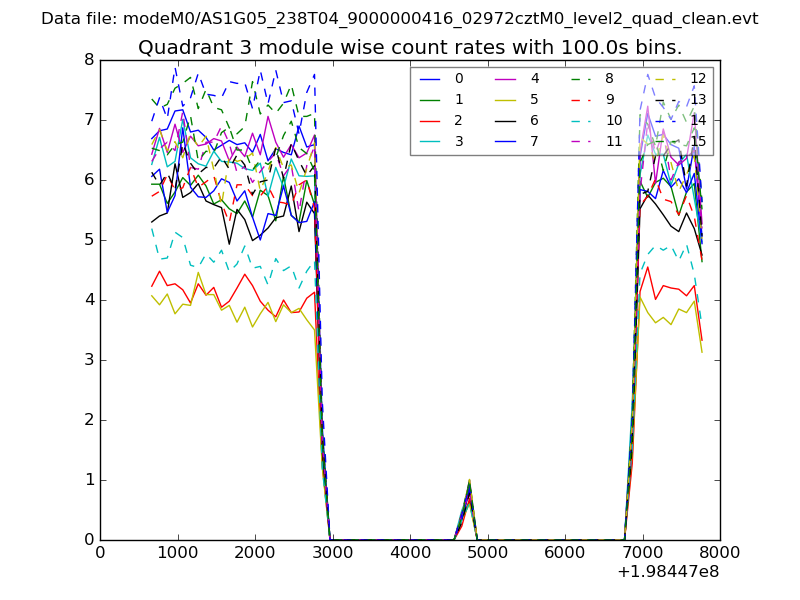
| Module-wise count rates for Quadrant D Data is divided into 100 sec bins |
 |
 |
| Parameter | Plot |
|---|---|
| CZT HV Monitor | 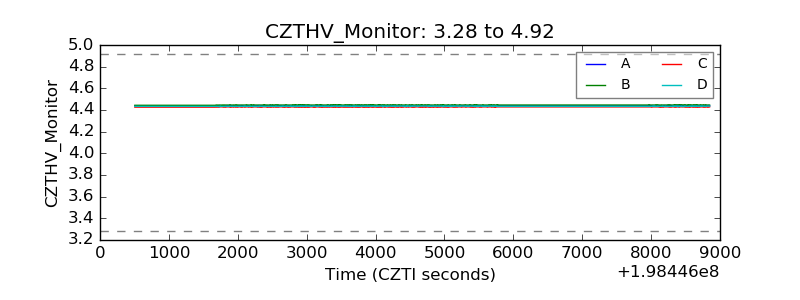 |
| D_VDD | 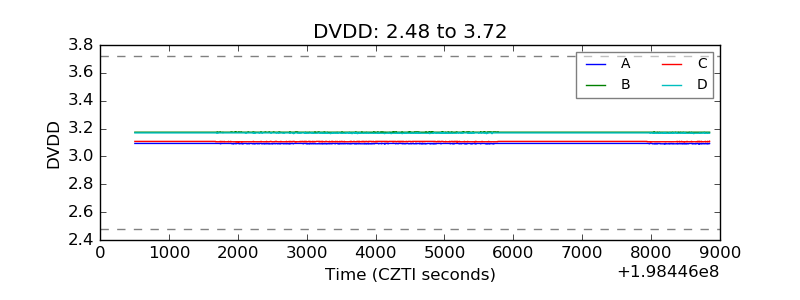 |
| Temperature 1 | 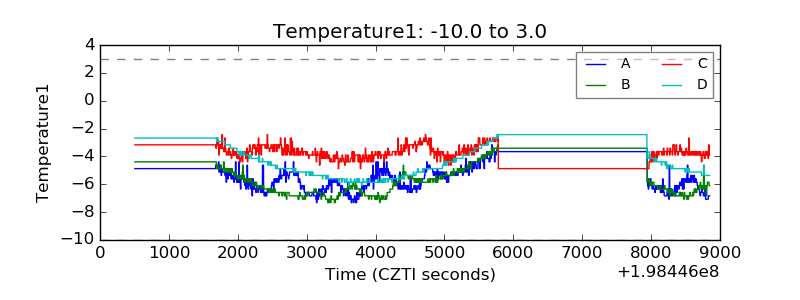 |
| Veto HV Monitor | 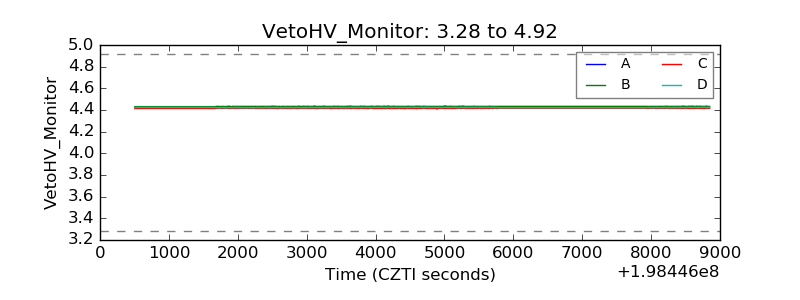 |
| Veto LLD | 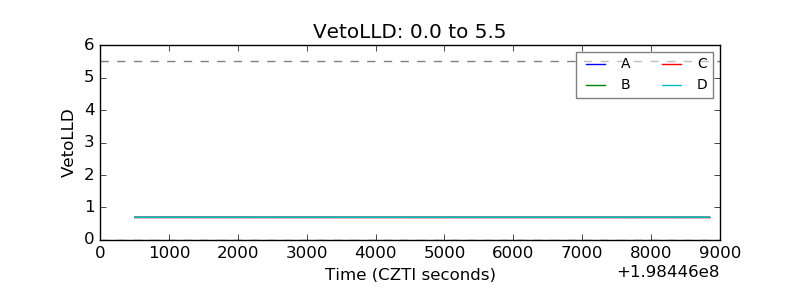 |
| Alpha Counter | 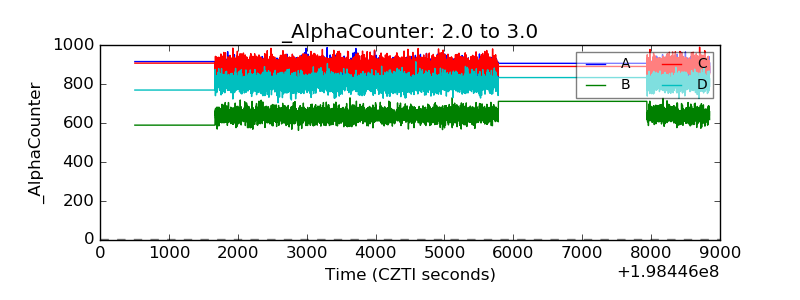 |
| _CPM_Rate | 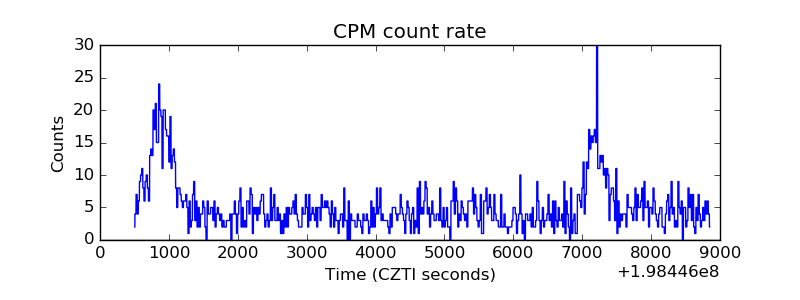 |
| CZT Counter | 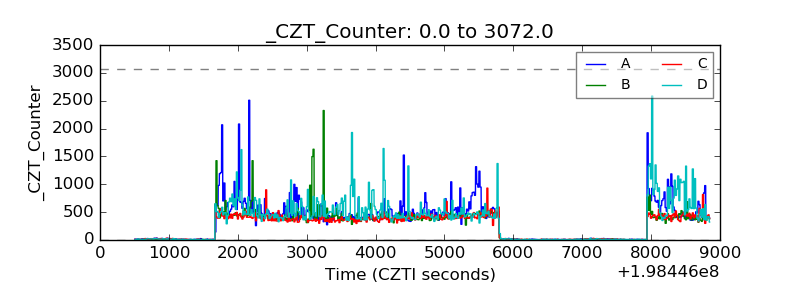 |
| +2.5 Volts monitor | 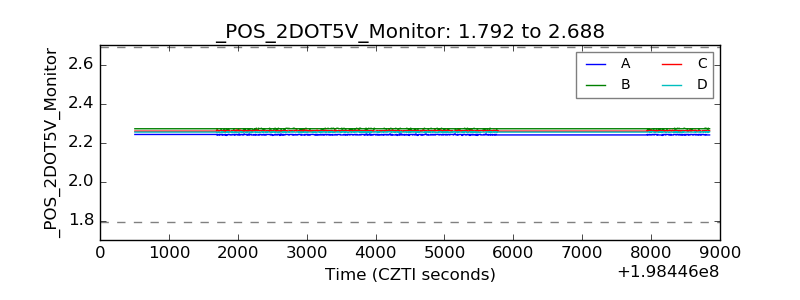 |
| +5 Volts monitor | 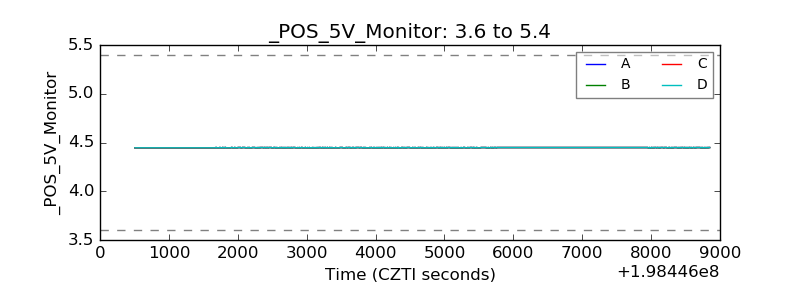 |
| _ROLL_ROT | 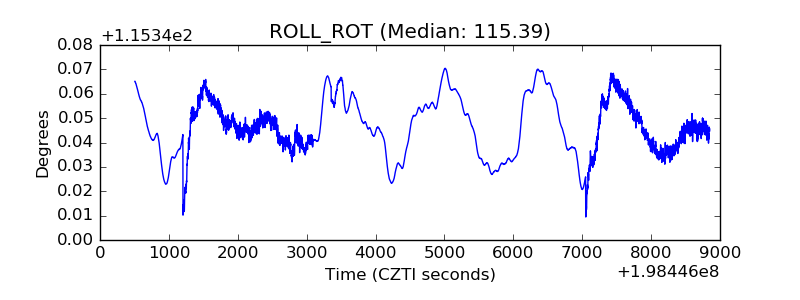 |
| _Roll_DEC | 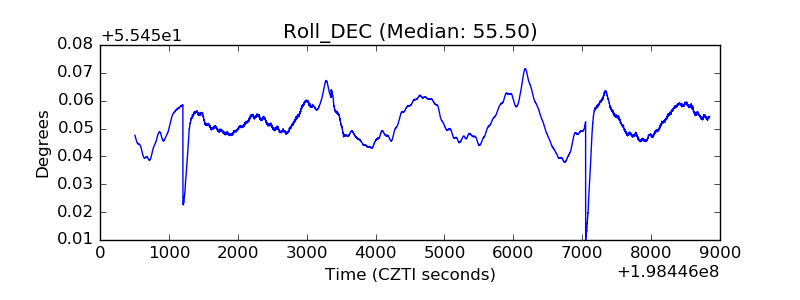 |
| _Roll_RA | 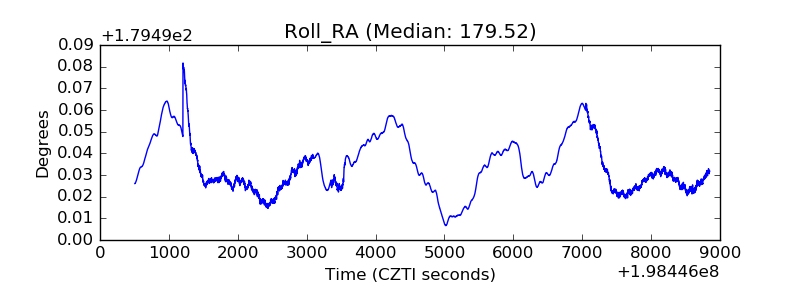 |
| Veto Counter | 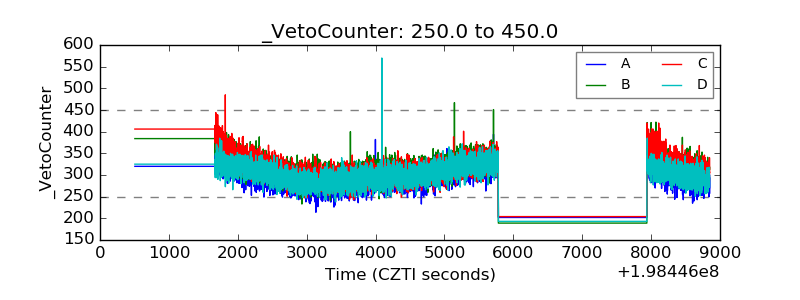 |