| Param | Original file | Final file |
|---|---|---|
| Filename | modeM0/AS1G05_238T04_9000000416_02973cztM0_level2.evt | modeM0/AS1G05_238T04_9000000416_02973cztM0_level2_common_clean.evt |
| Size (bytes) | 376,153,920 | 54,768,960 |
| Size | 358.7 MB | 52.2 MB |
| Events in quadrant A | 3,252,126 | 317,522 |
| Events in quadrant B | 2,383,593 | 323,095 |
| Events in quadrant C | 2,268,676 | 330,051 |
| Events in quadrant D | 3,128,468 | 319,286 |
| Mode M0 | |||
|---|---|---|---|
| Quadrant | BADHDUFLAG | Total packets | Discarded packets |
| A | 0 | 13384 | 3 |
| B | 0 | 11172 | 2 |
| C | 0 | 10816 | 2 |
| D | 0 | 13265 | 2 |
| Mode SS | |||
|---|---|---|---|
| Quadrant | BADHDUFLAG | Total packets | Discarded packets |
| A | 0 | 106 | 0 |
| B | 0 | 106 | 0 |
| C | 0 | 106 | 0 |
| D | 0 | 106 | 0 |
| Mode M9 | |||
|---|---|---|---|
| Quadrant | BADHDUFLAG | Total packets | Discarded packets |
| A | 0 | 34 | 0 |
| B | 0 | 34 | 0 |
| C | 0 | 34 | 0 |
| D | 0 | 35 | 0 |
| Quadrant | Total seconds | Saturated seconds | Saturation percentage |
|---|---|---|---|
| A | 5279 | 105 | 1.989013% |
| B | 5279 | 41 | 0.776662% |
| C | 5279 | 15 | 0.284145% |
| D | 5279 | 37 | 0.700890% |
Noise dominated data is calculated using 1-second bins in cleaned event files. If a bin has >2000 counts, and if more than 50% of those come from <1% of pixels, then it is considered to be noise-dominated and hence unusable.
| Quadrant | # 1 sec bins | Bins with >0 counts | Bins with >2000 counts | High rate bins dominated by noise | Noise dominated (total time) | Noise dominated (detector-on time) | Marked lightcurve |
|---|---|---|---|---|---|---|---|
| A | 7405 | 5280 | 100 | 100 | 1.35% | 1.89% | 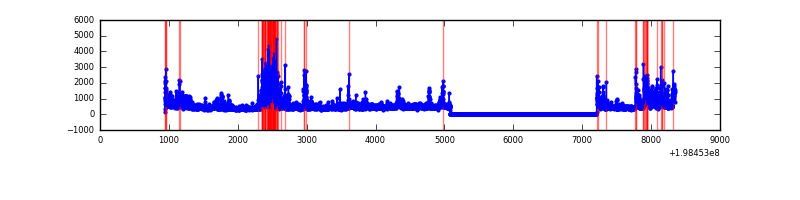 |
| B | 7405 | 5280 | 24 | 24 | 0.32% | 0.45% | 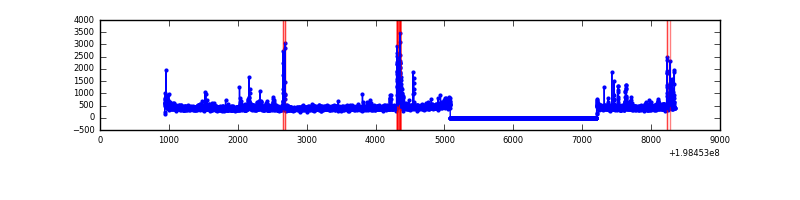 |
| C | 7405 | 5280 | 8 | 8 | 0.11% | 0.15% | 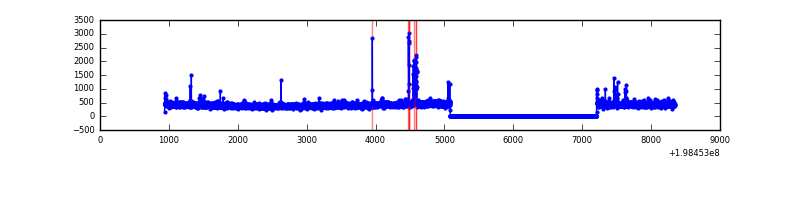 |
| D | 7405 | 5280 | 36 | 36 | 0.49% | 0.68% | 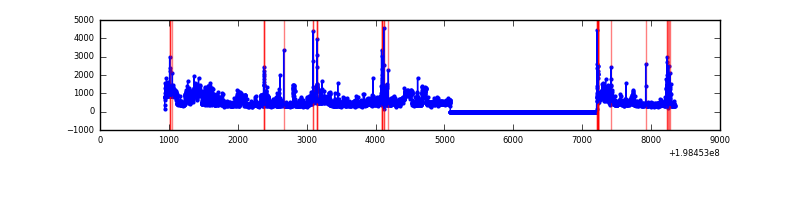 |
Top three noisy pixels from each quadrant. If the there are fewer than three noisy pixels in the level2.evt file, extra rows are filled as -1
| Pixel properties | Quadrant properties | ||||||
|---|---|---|---|---|---|---|---|
| Quadrant | DetID | PixID | Counts | Sigma | Mean | Median | Sigma |
| A | 13 | 9 | 998140 | 9236.63 | 528 | 517 | 108.0 |
| A | 14 | 63 | 68888 | 633.02 | 528 | 517 | 108.0 |
| A | 0 | 31 | 65703 | 603.53 | 528 | 517 | 108.0 |
| B | 0 | 219 | 83256 | 771.65 | 547 | 534 | 107.2 |
| B | 3 | 27 | 71809 | 664.87 | 547 | 534 | 107.2 |
| B | 5 | 70 | 56319 | 520.38 | 547 | 534 | 107.2 |
| C | 15 | 208 | 70819 | 565.12 | 527 | 530 | 124.4 |
| C | 1 | 192 | 47204 | 375.25 | 527 | 530 | 124.4 |
| C | 1 | 16 | 35360 | 280.03 | 527 | 530 | 124.4 |
| D | 2 | 209 | 558268 | 4512.13 | 515 | 502 | 123.6 |
| D | 13 | 114 | 336699 | 2719.72 | 515 | 502 | 123.6 |
| D | 14 | 81 | 81721 | 657.03 | 515 | 502 | 123.6 |
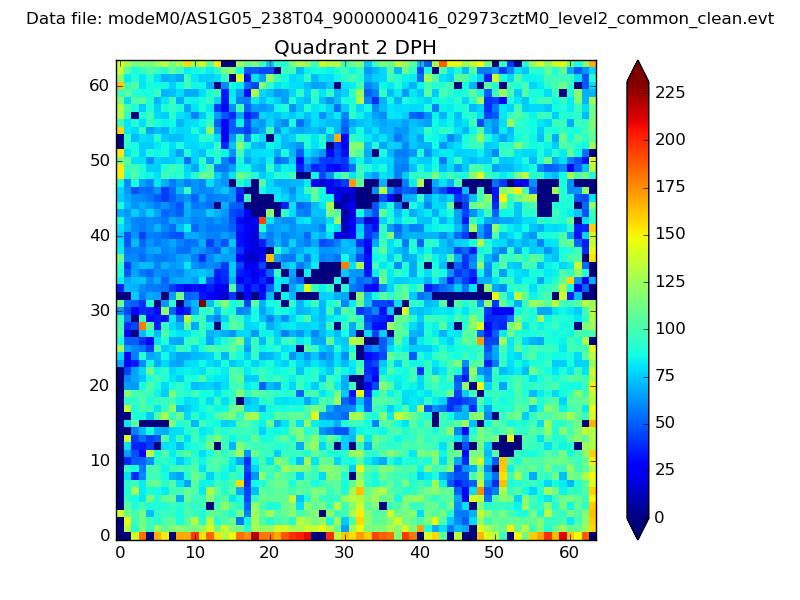
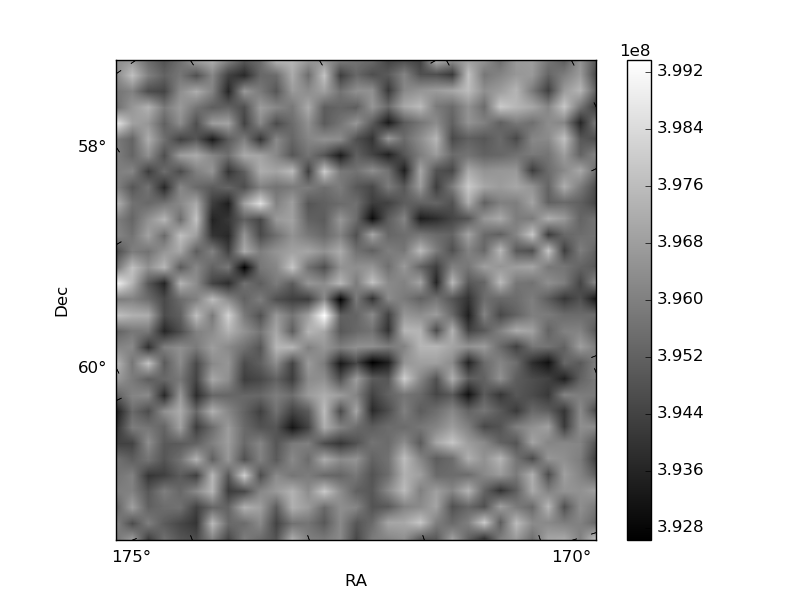
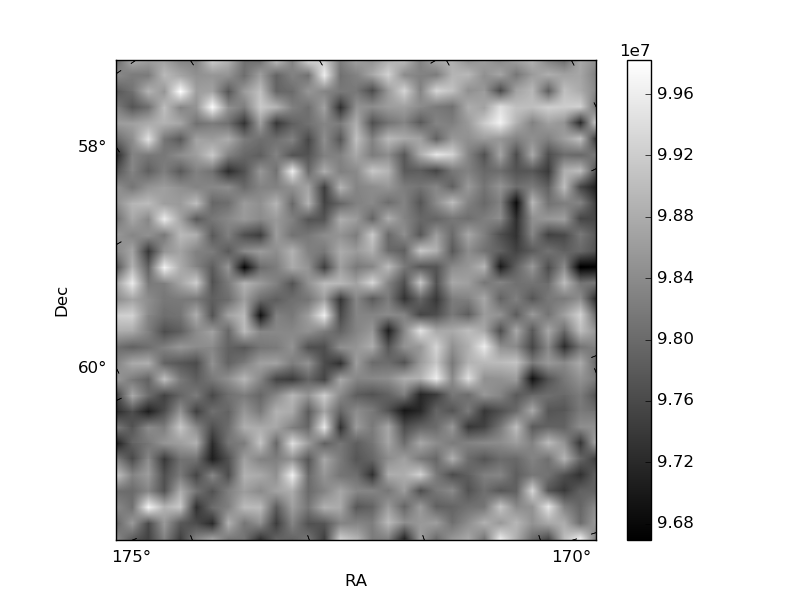
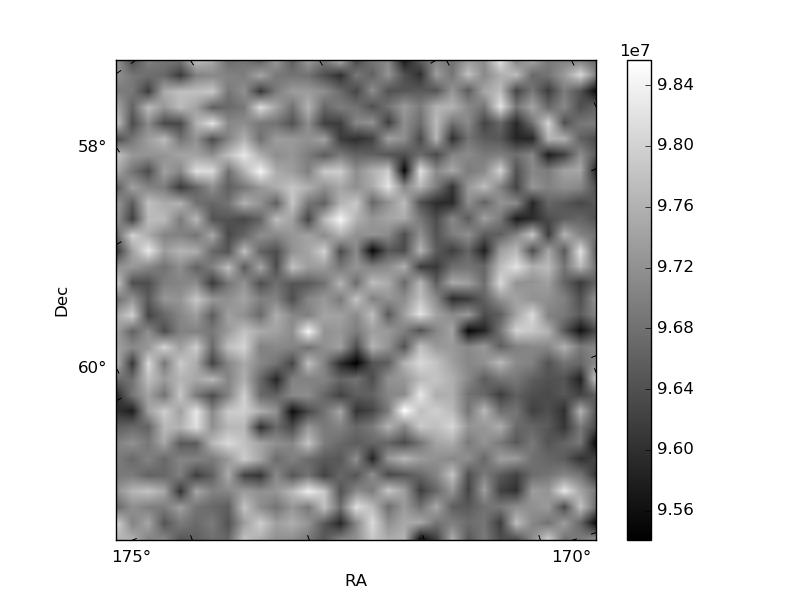
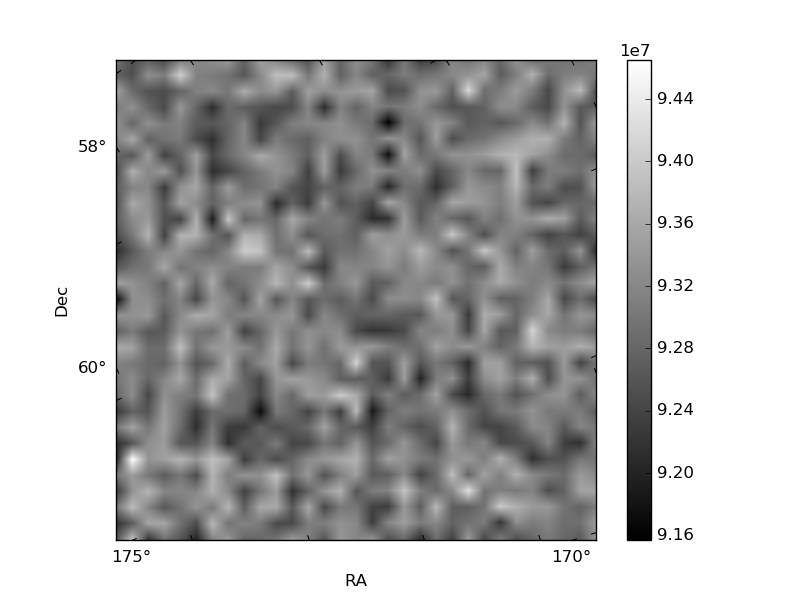
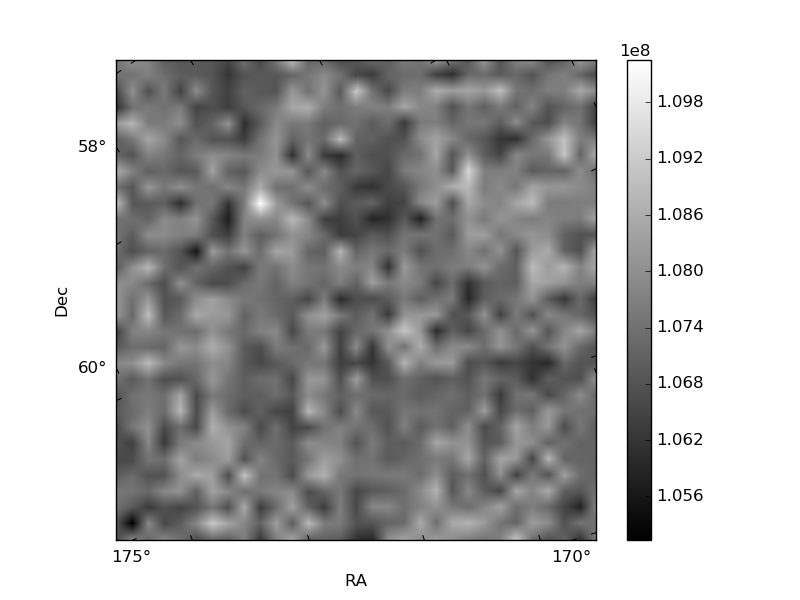
Histogram calculated using DETX and DETY for each event in the final _common_clean file
| Quadrant A | 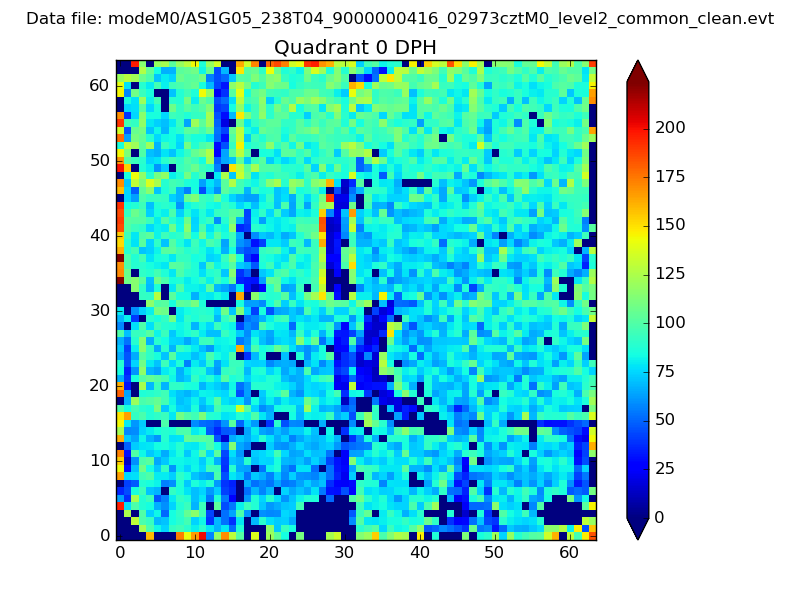 |
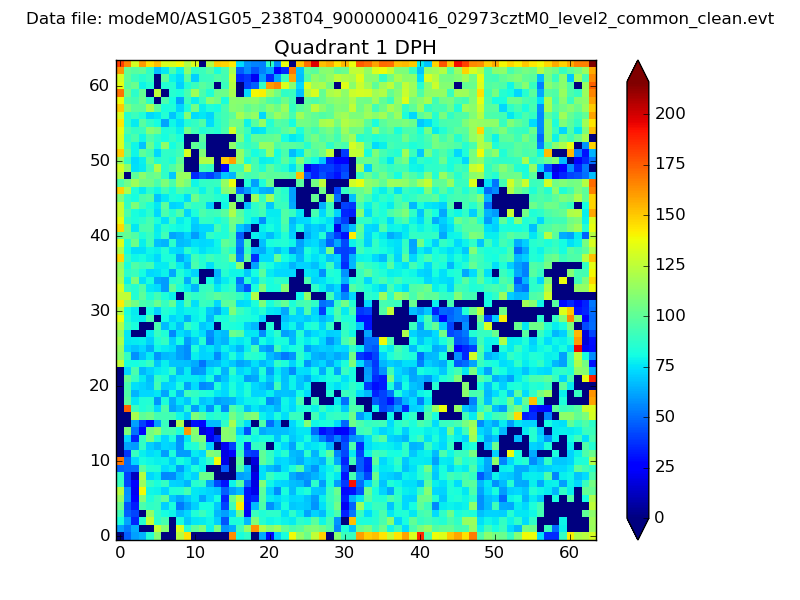 |
Quadrant B |
|---|---|---|---|
| Quadrant D | 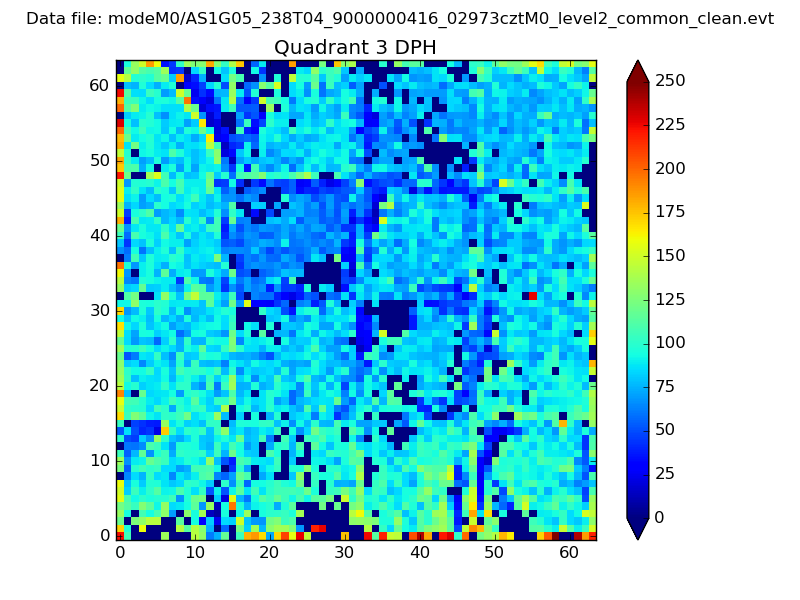 |
 |
Quadrant C |
| Plot type | Count rate plots | Images |
|---|---|---|
| Comparison with Poisson distribution Blue bars denote a histogram of data divided into 1 sec bins. Red curve is a Poisson curve with rate = median count rate of data. |
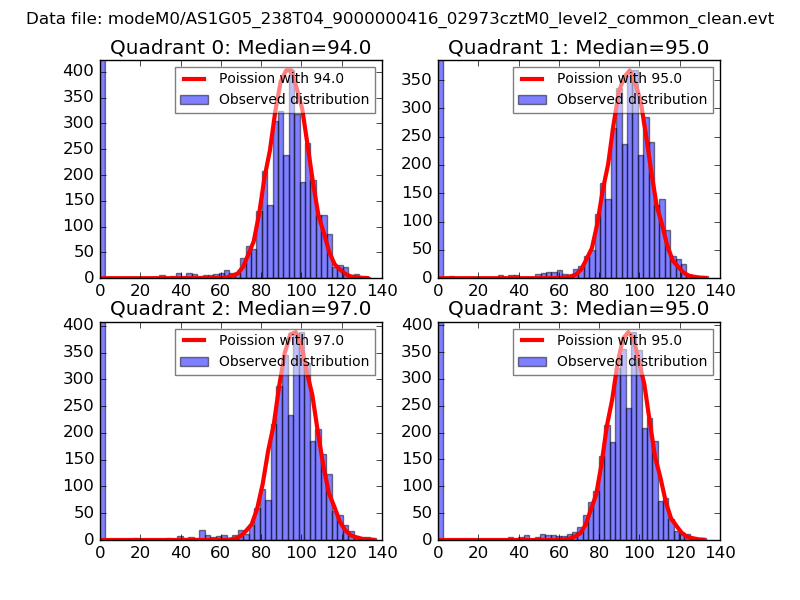 |
 |
| Quadrant-wise count rates Data is divided into 100 sec bins |
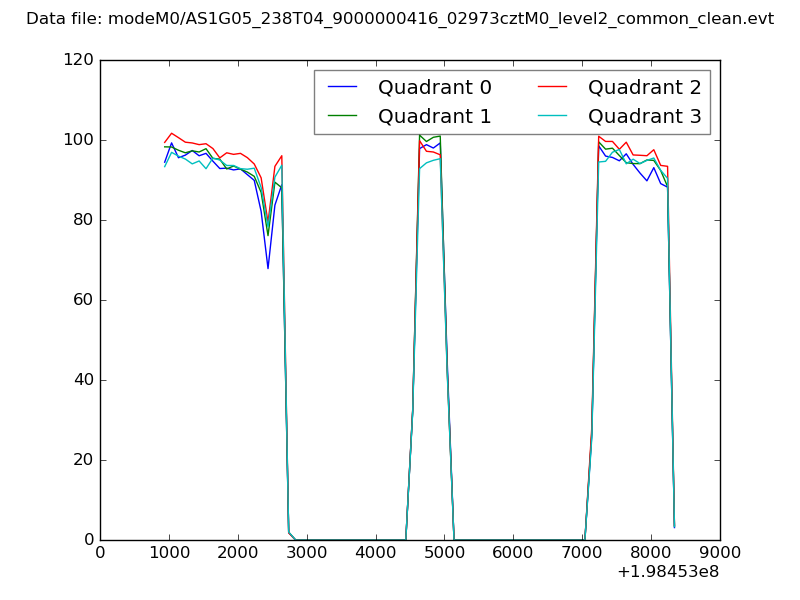 |
|
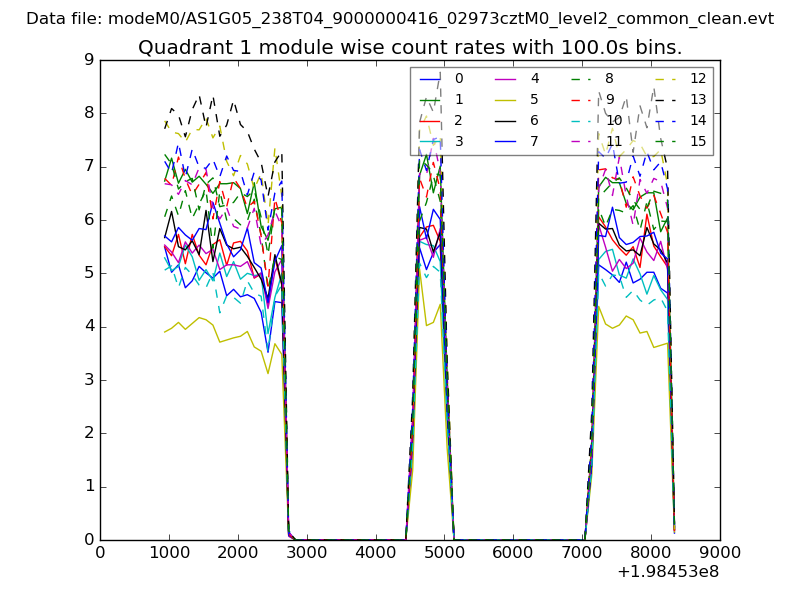
| Module-wise count rates for Quadrant A Data is divided into 100 sec bins |
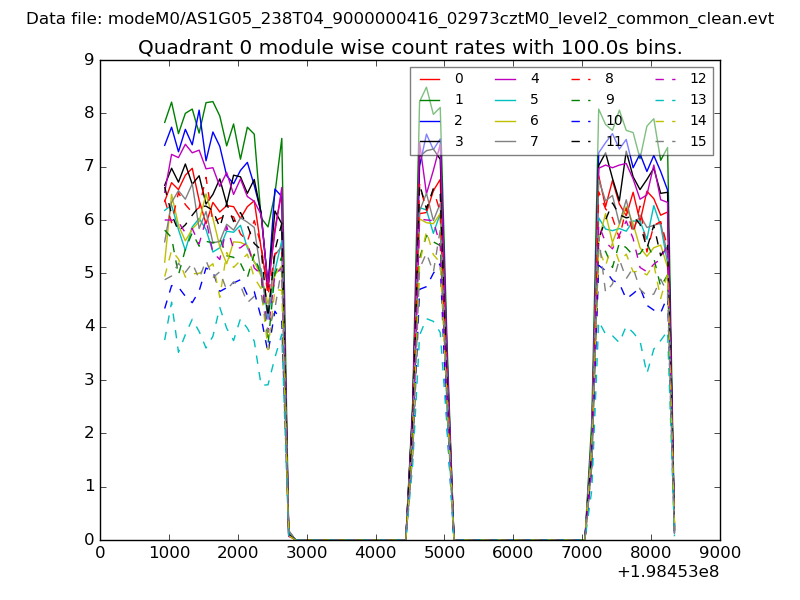 |
 |
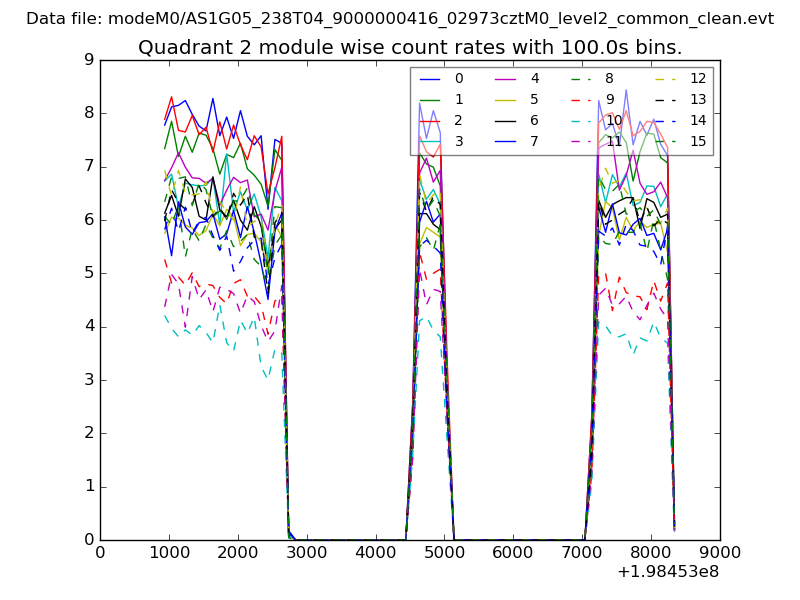
| Module-wise count rates for Quadrant B Data is divided into 100 sec bins |
 |
 |
| Module-wise count rates for Quadrant C Data is divided into 100 sec bins |
 |
 |
| Module-wise count rates for Quadrant D Data is divided into 100 sec bins |
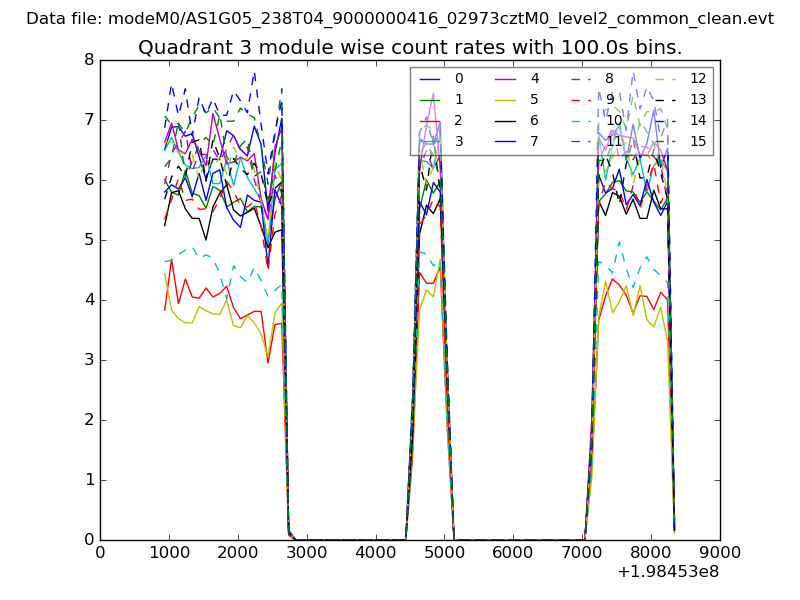 |
 |
| Parameter | Plot |
|---|---|
| CZT HV Monitor | 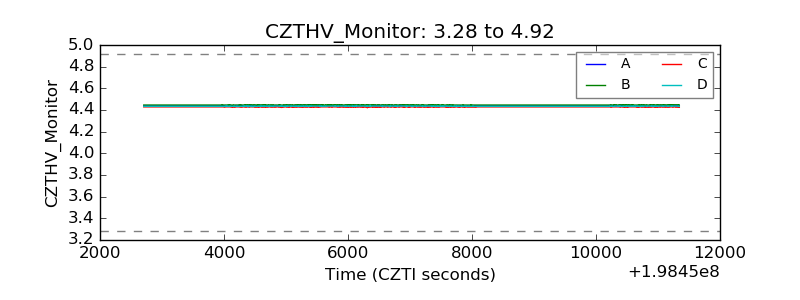 |
| D_VDD | 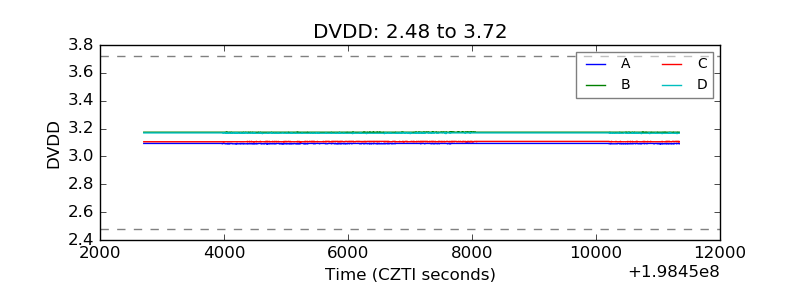 |
| Temperature 1 | 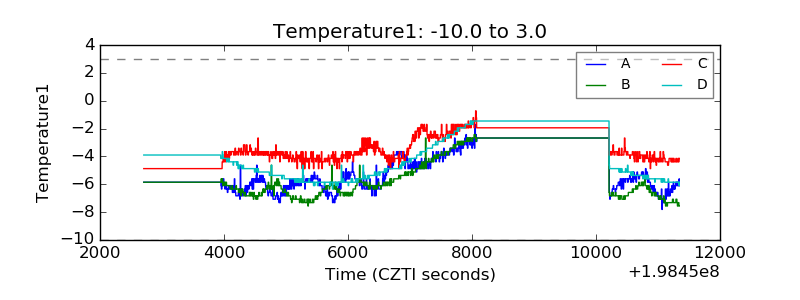 |
| Veto HV Monitor | 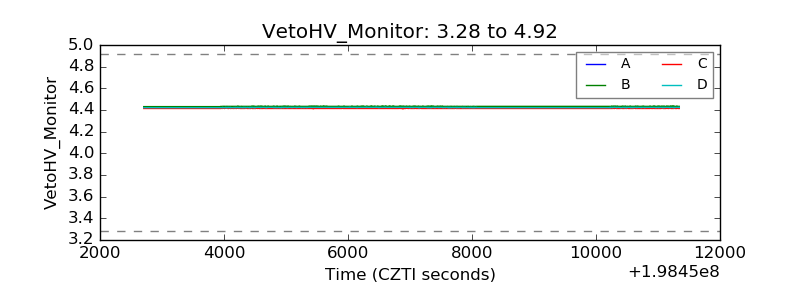 |
| Veto LLD | 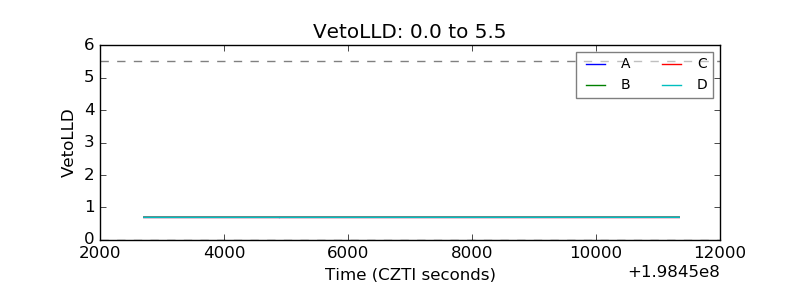 |
| Alpha Counter | 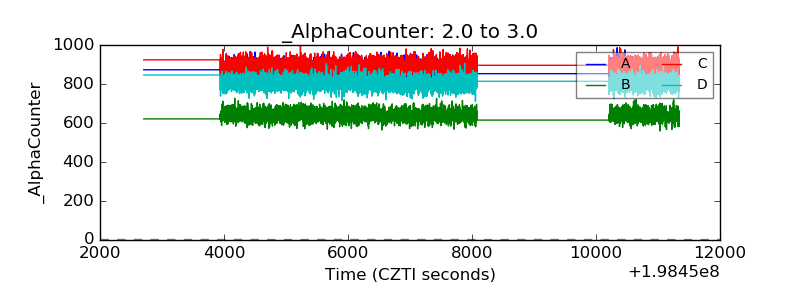 |
| _CPM_Rate | 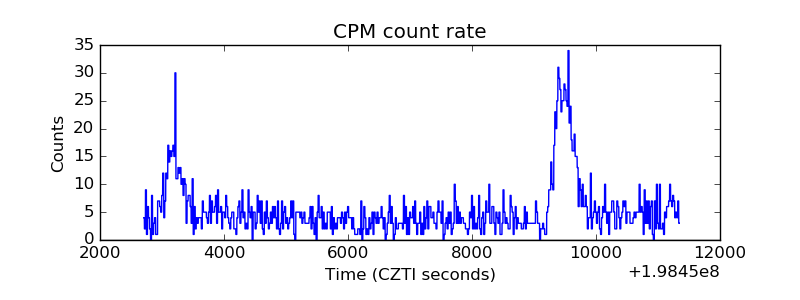 |
| CZT Counter | 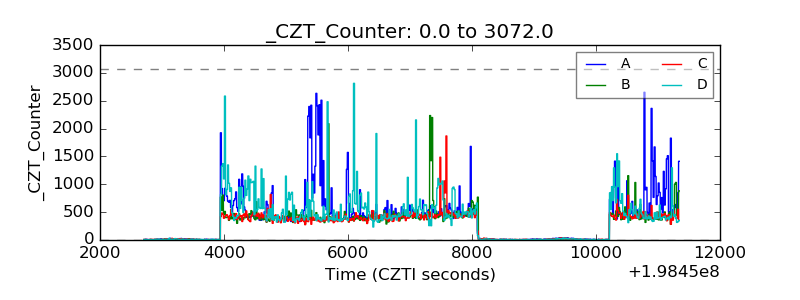 |
| +2.5 Volts monitor |  |
| +5 Volts monitor |  |
| Veto Counter | 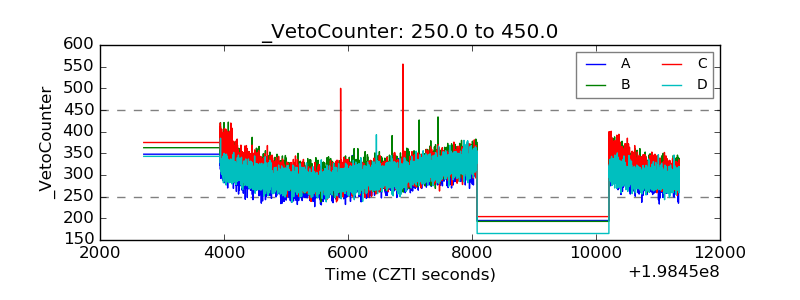 |