| Param | Original file | Final file |
|---|---|---|
| Filename | modeM0/AS1G05_238T04_9000000416_02976cztM0_level2.evt | modeM0/AS1G05_238T04_9000000416_02976cztM0_level2_quad_clean.evt |
| Size (bytes) | 667,281,600 | 84,974,400 |
| Size | 636.4 MB | 81.0 MB |
| Events in quadrant A | 6,400,177 | 486,534 |
| Events in quadrant B | 4,338,395 | 489,691 |
| Events in quadrant C | 3,999,641 | 492,388 |
| Events in quadrant D | 4,857,141 | 476,718 |
| Mode M0 | |||
|---|---|---|---|
| Quadrant | BADHDUFLAG | Total packets | Discarded packets |
| A | 0 | 25650 | 3 |
| B | 0 | 19525 | 3 |
| C | 0 | 18564 | 3 |
| D | 0 | 21486 | 3 |
| Mode SS | |||
|---|---|---|---|
| Quadrant | BADHDUFLAG | Total packets | Discarded packets |
| A | 0 | 186 | 0 |
| B | 0 | 186 | 0 |
| C | 0 | 186 | 0 |
| D | 0 | 186 | 0 |
| Mode M9 | |||
|---|---|---|---|
| Quadrant | BADHDUFLAG | Total packets | Discarded packets |
| A | 0 | 56 | 0 |
| B | 0 | 56 | 0 |
| C | 0 | 56 | 0 |
| D | 0 | 57 | 0 |
| Quadrant | Total seconds | Saturated seconds | Saturation percentage |
|---|---|---|---|
| A | 9041 | 866 | 9.578586% |
| B | 9041 | 41 | 0.453490% |
| C | 9041 | 22 | 0.243336% |
| D | 9041 | 140 | 1.548501% |
Noise dominated data is calculated using 1-second bins in cleaned event files. If a bin has >2000 counts, and if more than 50% of those come from <1% of pixels, then it is considered to be noise-dominated and hence unusable.
| Quadrant | # 1 sec bins | Bins with >0 counts | Bins with >2000 counts | High rate bins dominated by noise | Noise dominated (total time) | Noise dominated (detector-on time) | Marked lightcurve |
|---|---|---|---|---|---|---|---|
| A | 13321 | 9043 | 741 | 741 | 5.56% | 8.19% | 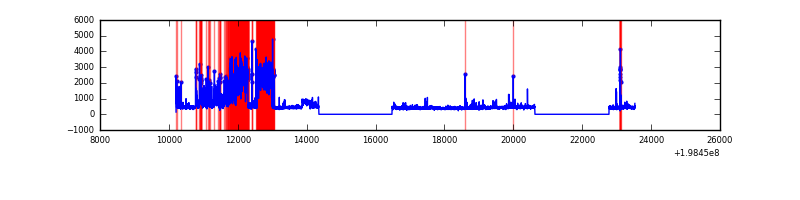 |
| B | 13321 | 9043 | 24 | 24 | 0.18% | 0.27% | 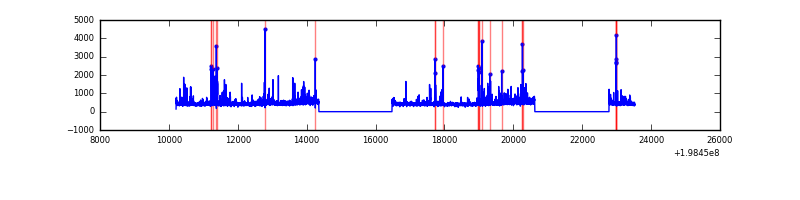 |
| C | 13321 | 9043 | 20 | 20 | 0.15% | 0.22% | 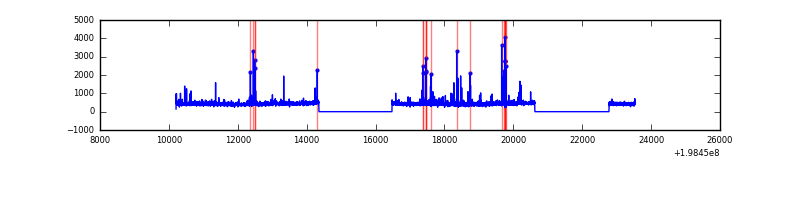 |
| D | 13321 | 9043 | 125 | 125 | 0.94% | 1.38% | 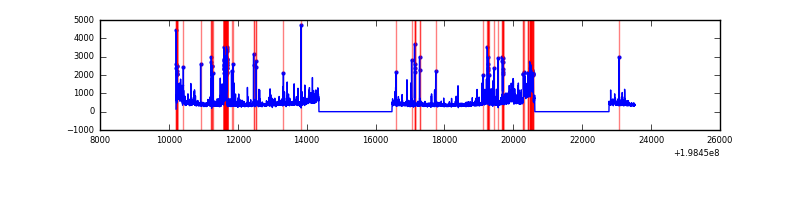 |
Top three noisy pixels from each quadrant. If the there are fewer than three noisy pixels in the level2.evt file, extra rows are filled as -1
| Pixel properties | Quadrant properties | ||||||
|---|---|---|---|---|---|---|---|
| Quadrant | DetID | PixID | Counts | Sigma | Mean | Median | Sigma |
| A | 13 | 9 | 2730416 | 14665.81 | 905 | 886 | 186.1 |
| A | 0 | 31 | 94247 | 501.63 | 905 | 886 | 186.1 |
| A | 0 | 50 | 17796 | 90.86 | 905 | 886 | 186.1 |
| B | 0 | 219 | 215087 | 1153.66 | 957 | 934 | 185.6 |
| B | 3 | 27 | 113150 | 604.52 | 957 | 934 | 185.6 |
| B | 14 | 167 | 99904 | 533.16 | 957 | 934 | 185.6 |
| C | 6 | 80 | 127022 | 591.07 | 913 | 916 | 213.4 |
| C | 1 | 16 | 104307 | 484.6 | 913 | 916 | 213.4 |
| C | 1 | 192 | 100169 | 465.21 | 913 | 916 | 213.4 |
| D | 13 | 114 | 542496 | 2491.53 | 901 | 874 | 217.4 |
| D | 2 | 209 | 223846 | 1025.7 | 901 | 874 | 217.4 |
| D | 13 | 239 | 106584 | 486.28 | 901 | 874 | 217.4 |
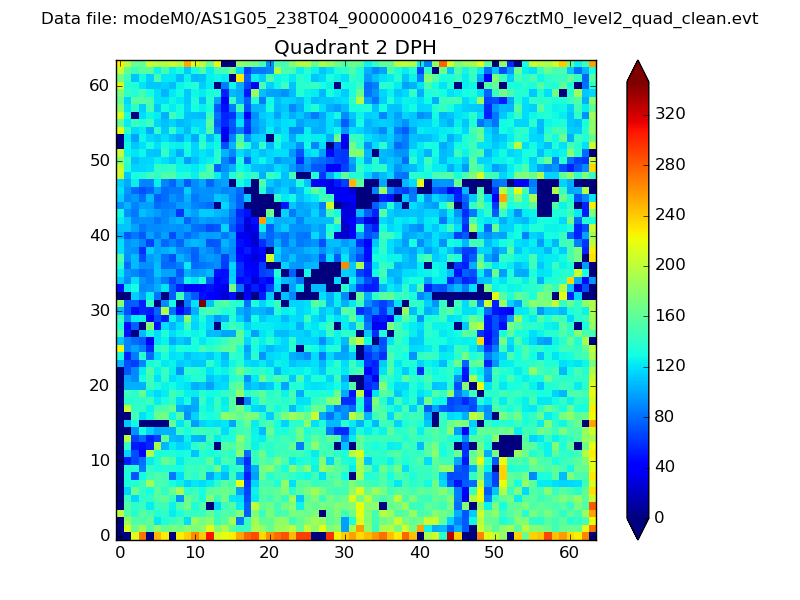
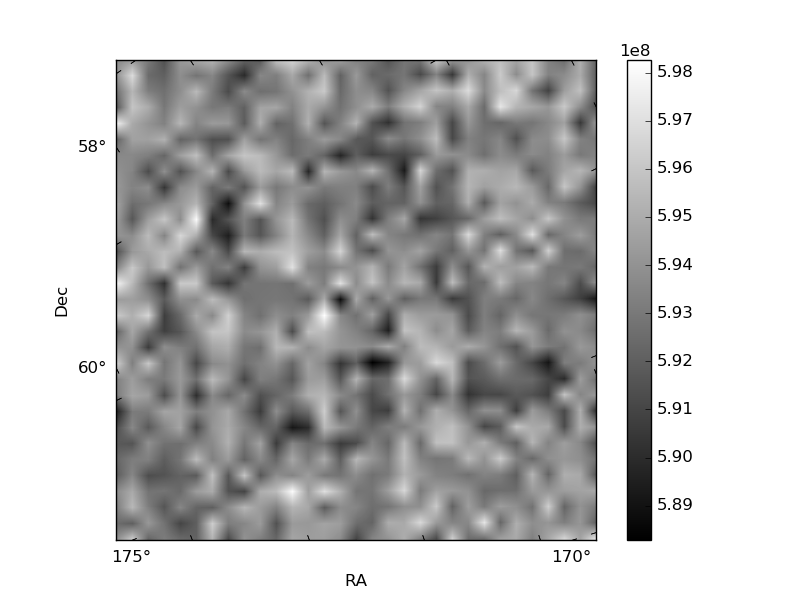
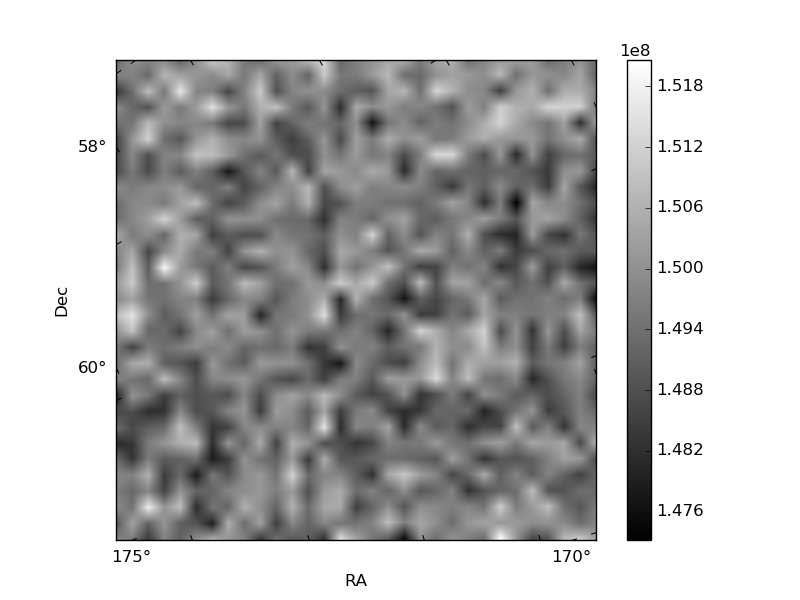
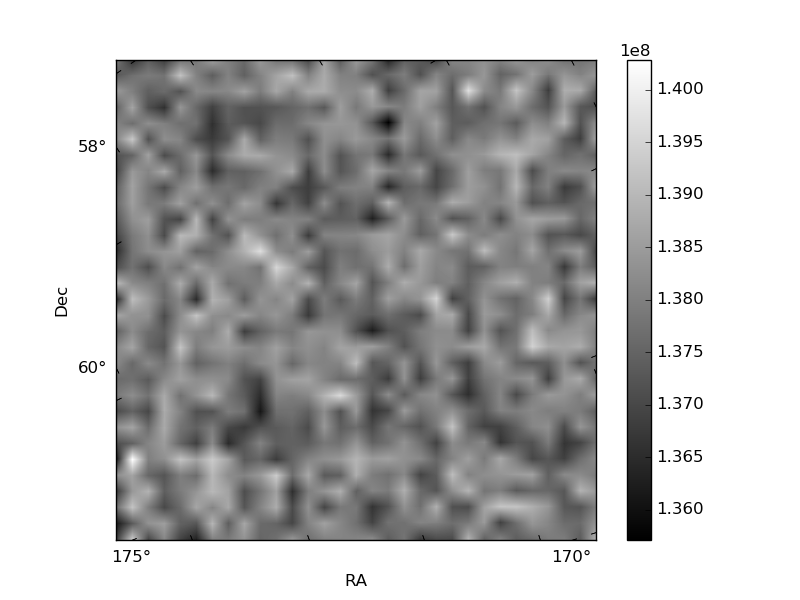
Histogram calculated using DETX and DETY for each event in the final _common_clean file
| Quadrant A | 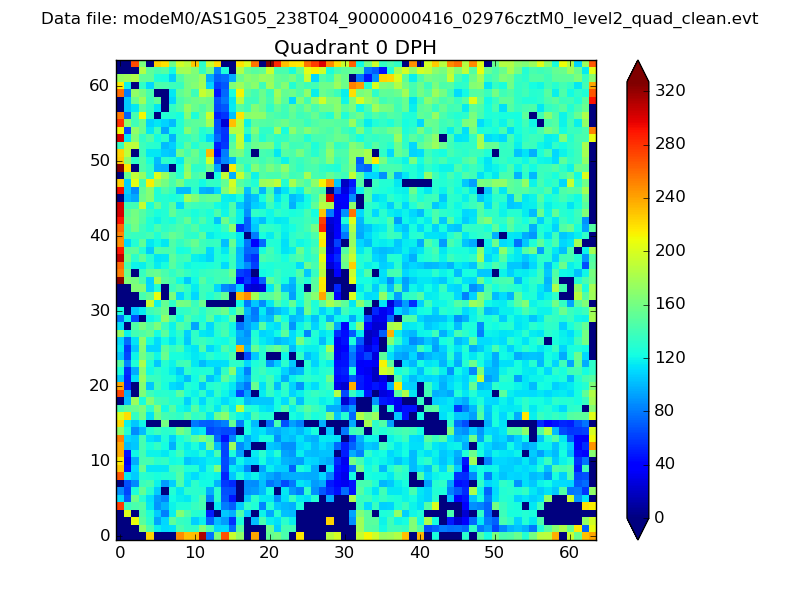 |
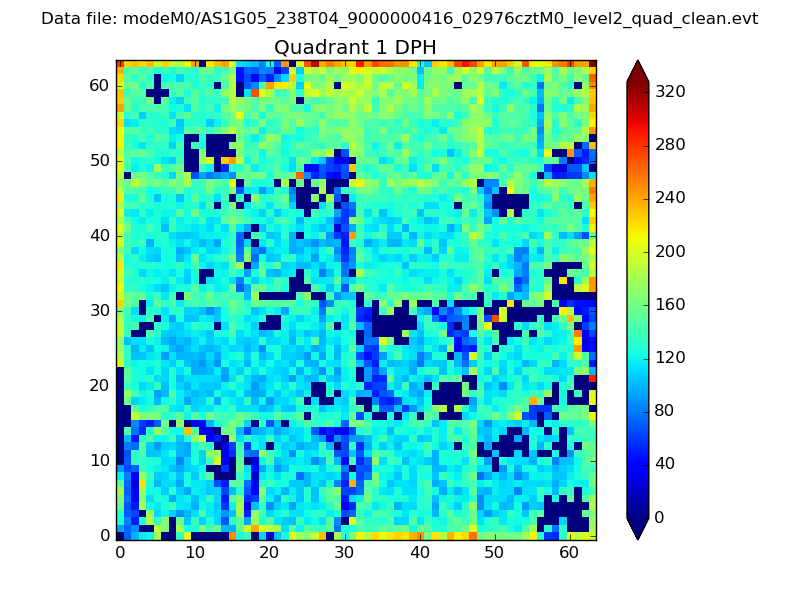 |
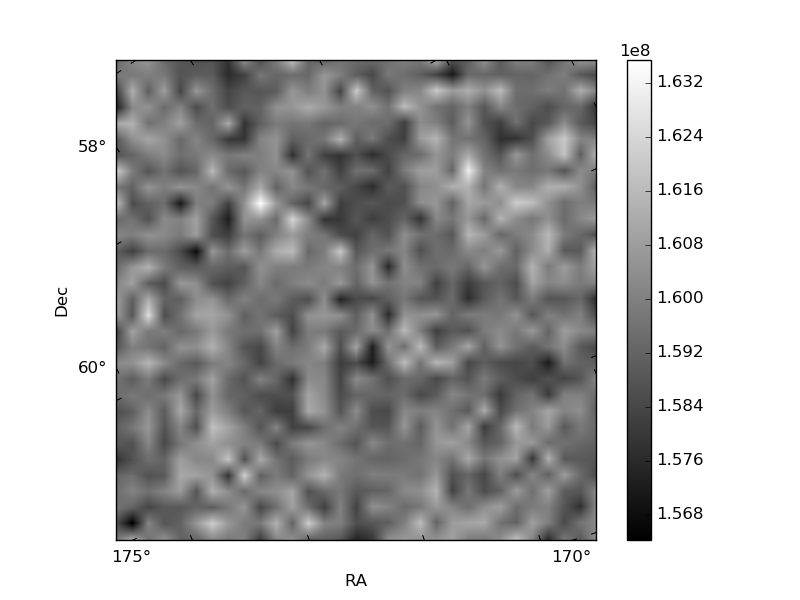
Quadrant B |
|---|---|---|---|
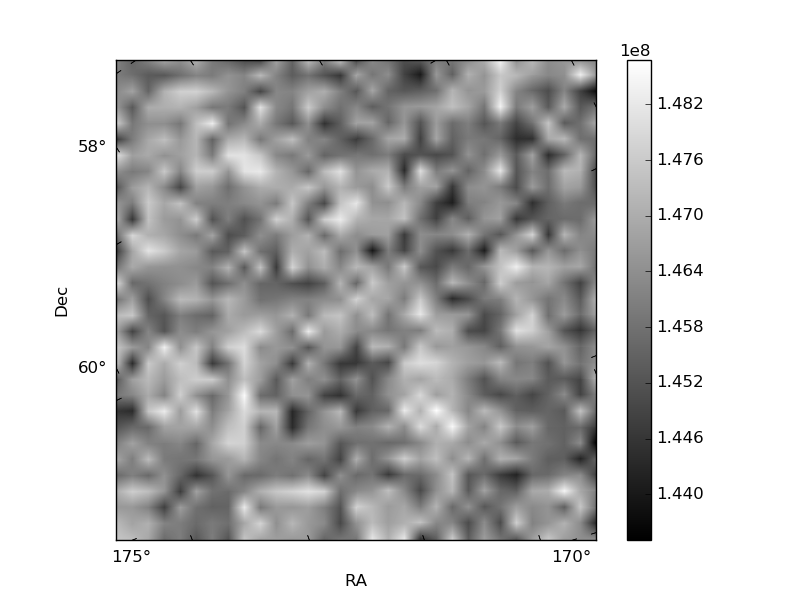
| Quadrant D | 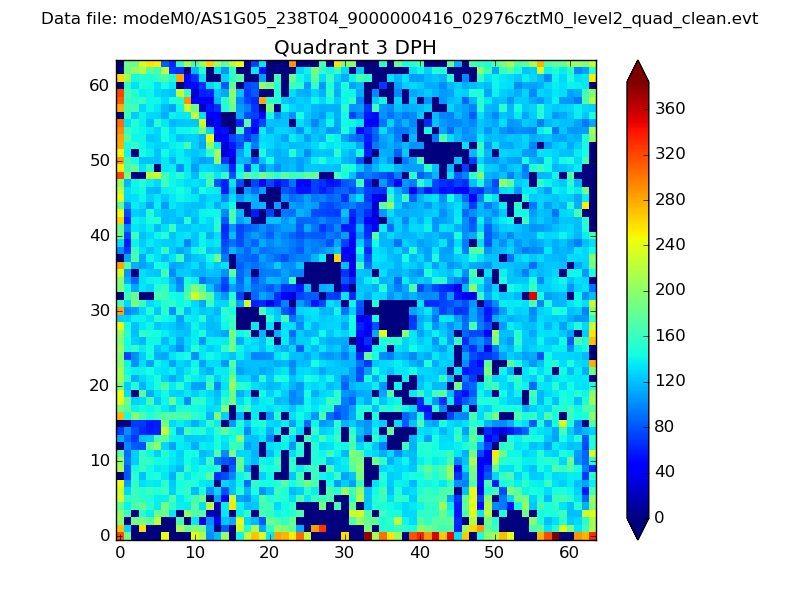 |
 |
Quadrant C |
| Plot type | Count rate plots | Images |
|---|---|---|
| Comparison with Poisson distribution Blue bars denote a histogram of data divided into 1 sec bins. Red curve is a Poisson curve with rate = median count rate of data. |
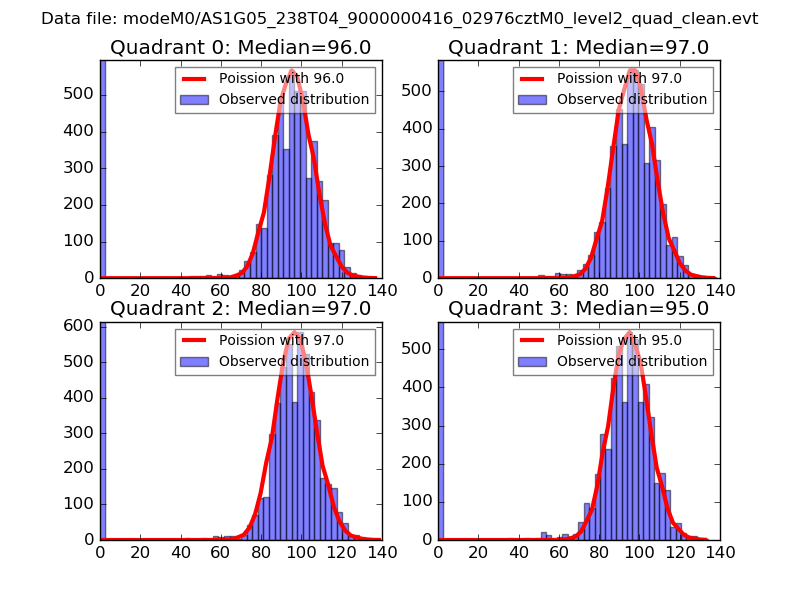 |
 |
| Quadrant-wise count rates Data is divided into 100 sec bins |
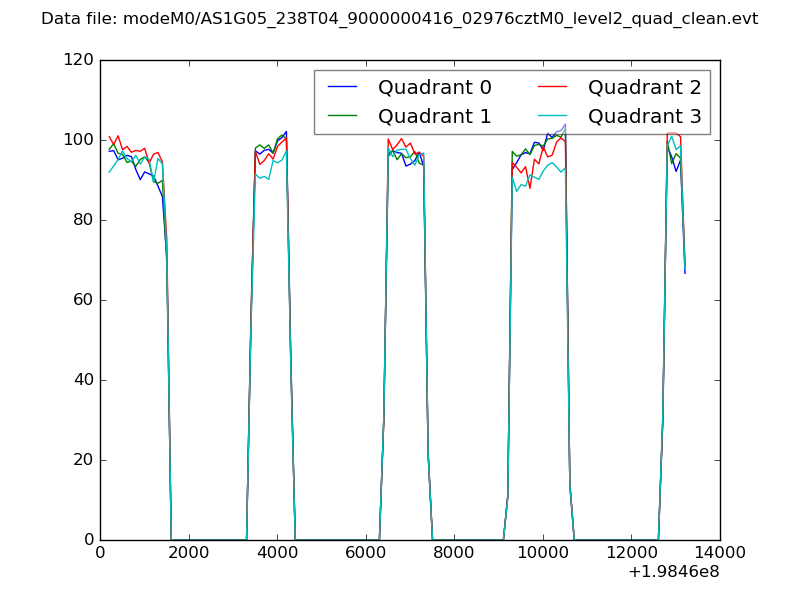 |
|
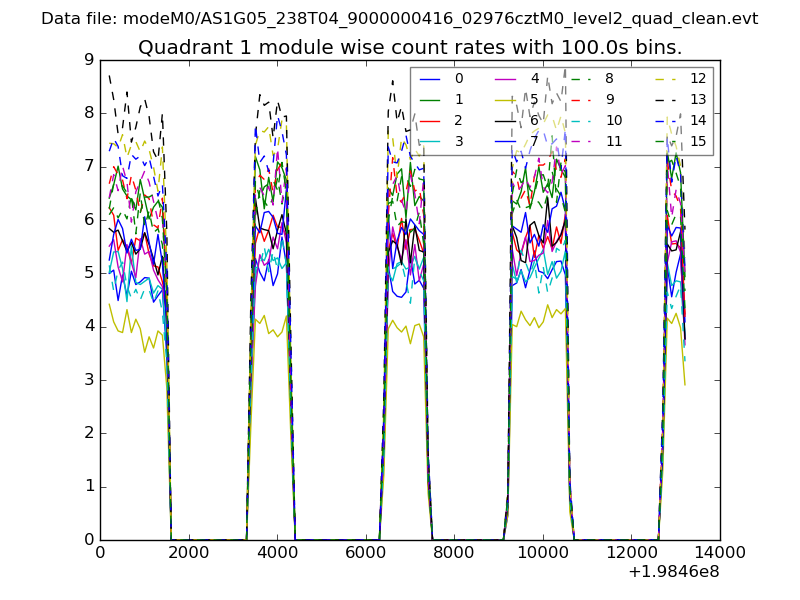
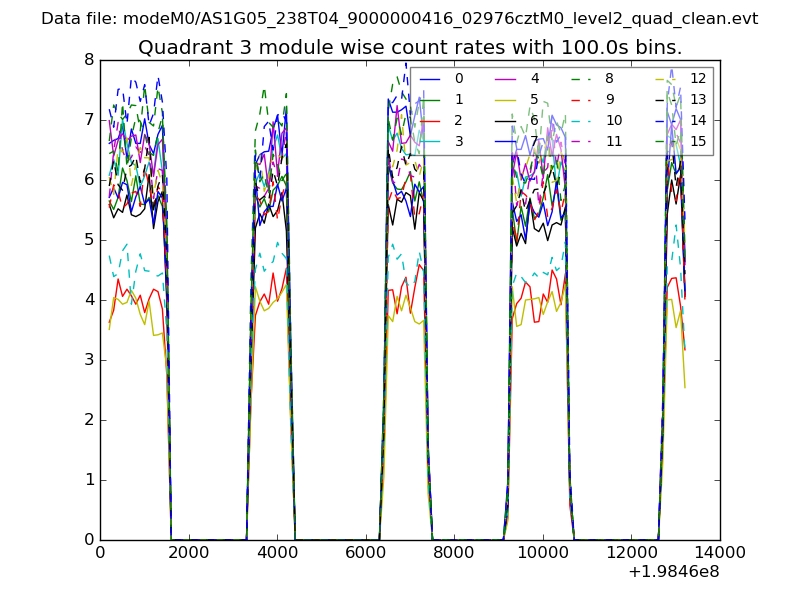
| Module-wise count rates for Quadrant A Data is divided into 100 sec bins |
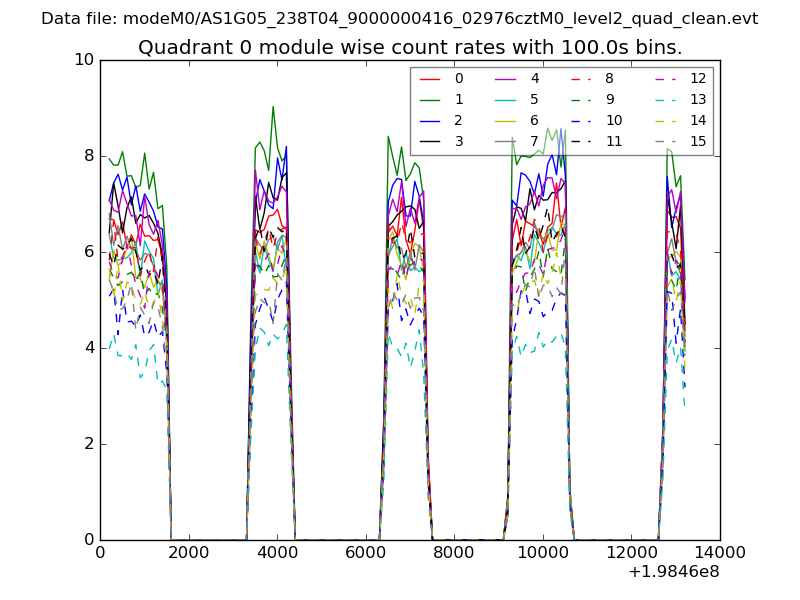 |
 |
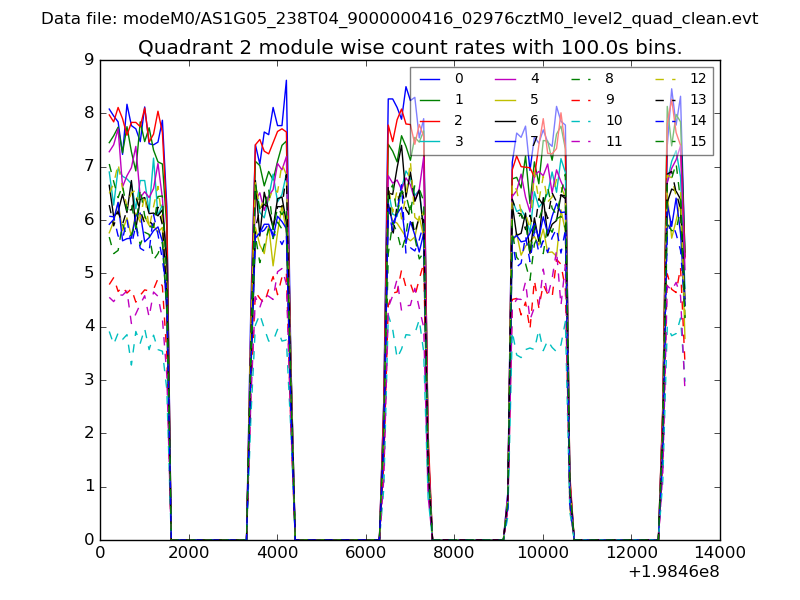
| Module-wise count rates for Quadrant B Data is divided into 100 sec bins |
 |
 |
| Module-wise count rates for Quadrant C Data is divided into 100 sec bins |
 |
 |
| Module-wise count rates for Quadrant D Data is divided into 100 sec bins |
 |
 |
| Parameter | Plot |
|---|---|
| CZT HV Monitor | 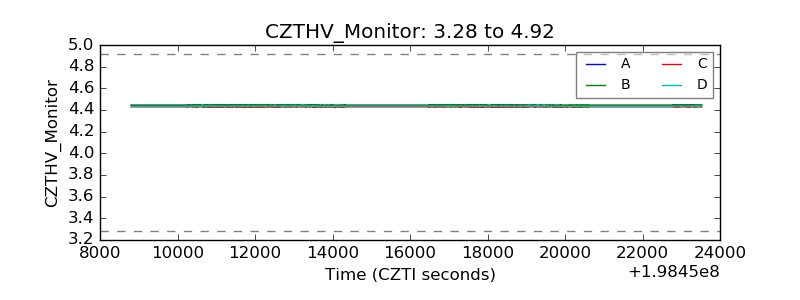 |
| D_VDD | 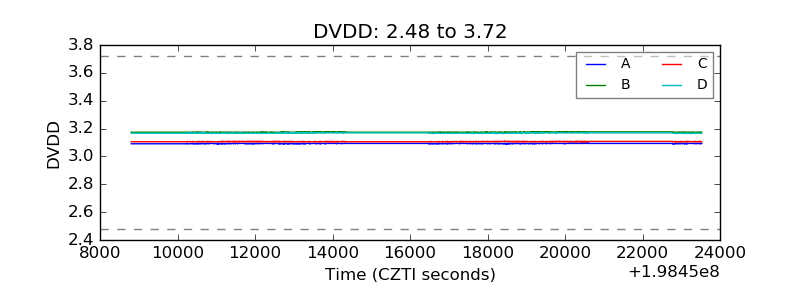 |
| Temperature 1 | 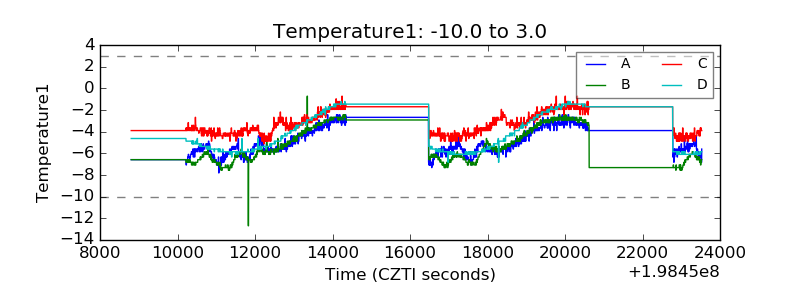 |
| Veto HV Monitor | 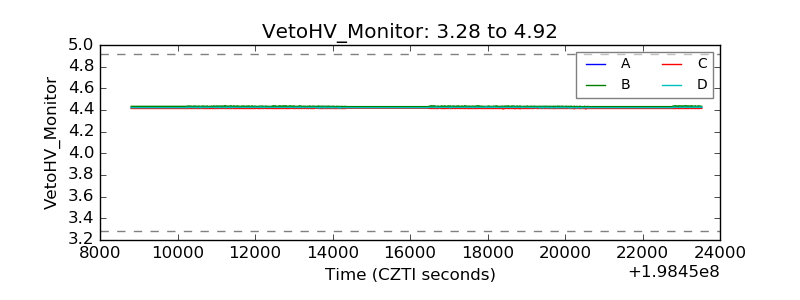 |
| Veto LLD | 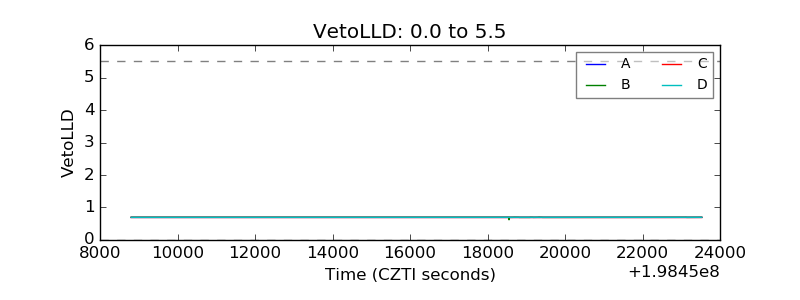 |
| Alpha Counter | 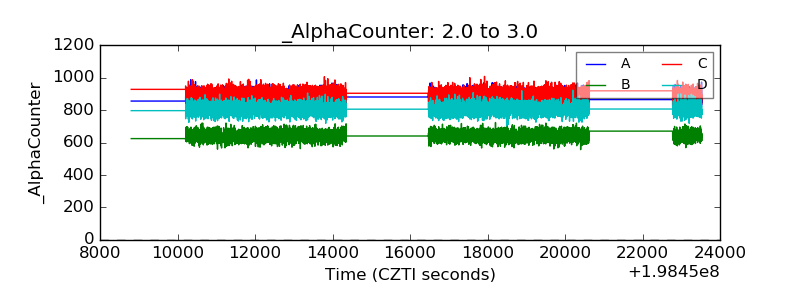 |
| _CPM_Rate | 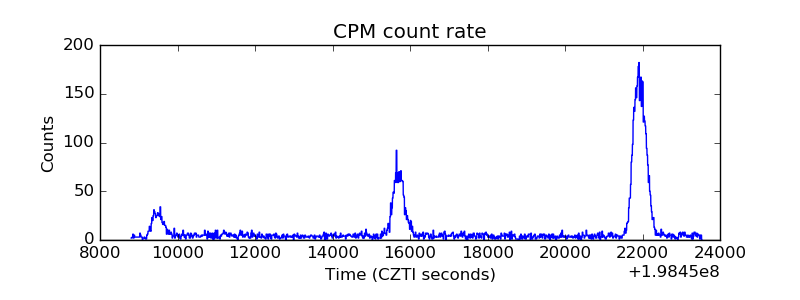 |
| CZT Counter | 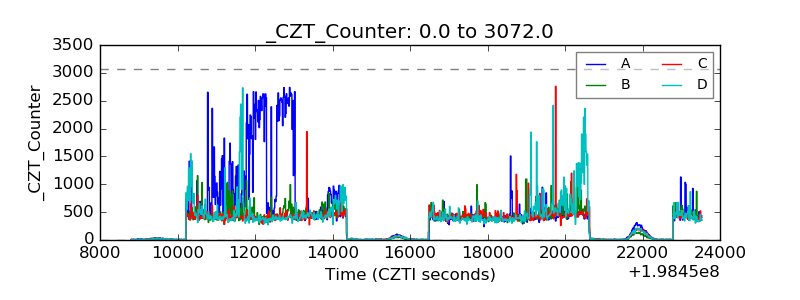 |
| +2.5 Volts monitor |  |
| +5 Volts monitor |  |
| _ROLL_ROT | 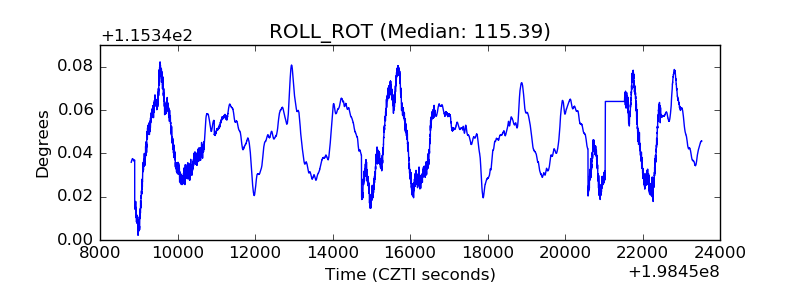 |
| _Roll_DEC | 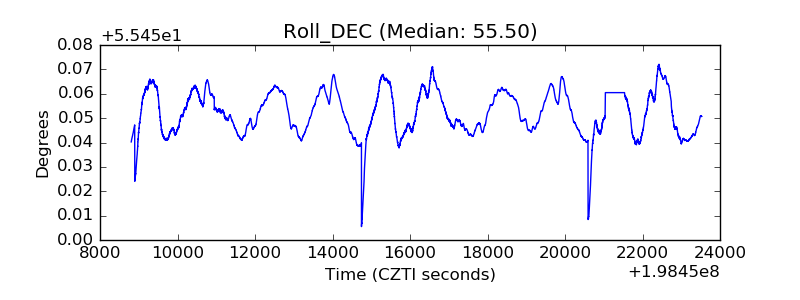 |
| _Roll_RA | 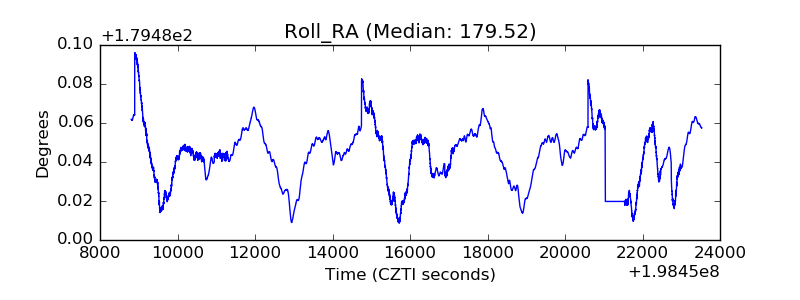 |
| Veto Counter | 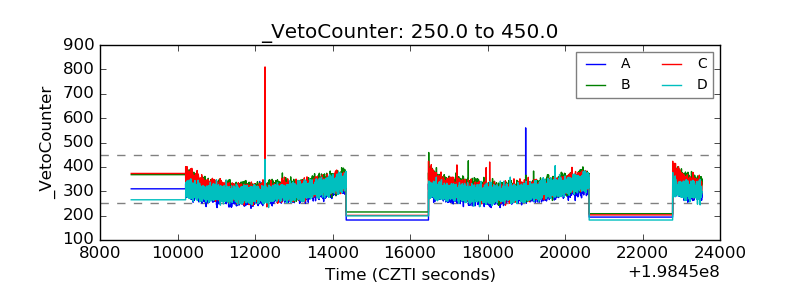 |