| Param | Original file | Final file |
|---|---|---|
| Filename | modeM0/AS1G05_238T05_9000000418cztM0_level2.fits | modeM0/AS1G05_238T05_9000000418cztM0_level2_quad_clean.evt |
| Size (bytes) | 774,432,000 | 934,349,760 |
| Size | 738.6 MB | 891.1 MB |
| Events in quadrant A | 4,477,394 | 5,573,030 |
| Events in quadrant B | 4,390,144 | 5,705,931 |
| Events in quadrant C | 4,520,518 | 5,619,392 |
| Events in quadrant D | 3,848,334 | 5,187,440 |
| Mode M0 | |||
|---|---|---|---|
| Quadrant | BADHDUFLAG | Total packets | Discarded packets |
| A | 0 | 267553 | 0 |
| B | 0 | 233899 | 0 |
| C | 0 | 191507 | 0 |
| D | 0 | 220065 | 0 |
| Mode M9 | |||
|---|---|---|---|
| Quadrant | BADHDUFLAG | Total packets | Discarded packets |
| A | 0 | 489 | 0 |
| B | 0 | 489 | 0 |
| C | 0 | 489 | 0 |
| D | 0 | 490 | 0 |
| Mode SS | |||
|---|---|---|---|
| Quadrant | BADHDUFLAG | Total packets | Discarded packets |
| A | 0 | 1854 | 0 |
| B | 0 | 1854 | 0 |
| C | 0 | 1854 | 0 |
| D | 0 | 1854 | 0 |
| Quadrant | Total seconds | Saturated seconds | Saturation percentage |
|---|---|---|---|
| A | 90639 | 5479 | 6.044859% |
| B | 90639 | 3885 | 4.286234% |
| C | 90639 | 725 | 0.799876% |
| D | 90639 | 1400 | 1.544589% |
Noise dominated data is calculated using 1-second bins in cleaned event files. If a bin has >2000 counts, and if more than 50% of those come from <1% of pixels, then it is considered to be noise-dominated and hence unusable.
| Quadrant | # 1 sec bins | Bins with >0 counts | Bins with >2000 counts | High rate bins dominated by noise | Noise dominated (total time) | Noise dominated (detector-on time) | Marked lightcurve |
|---|---|---|---|---|---|---|---|
| A | 135814 | 90530 | 0 | 0 | 0.00% | 0.00% | 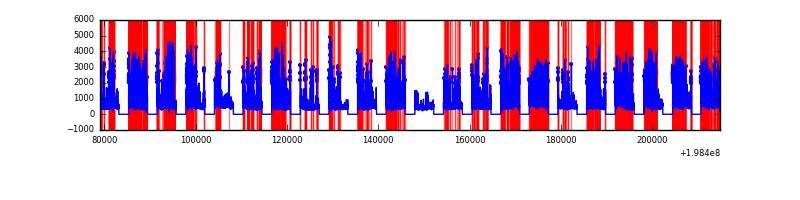 |
| B | 135814 | 90620 | 0 | 0 | 0.00% | 0.00% | 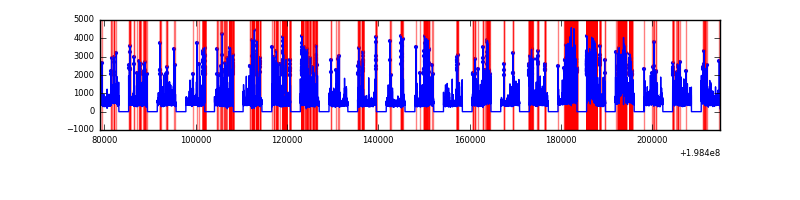 |
| C | 135814 | 90624 | 0 | 0 | 0.00% | 0.00% | 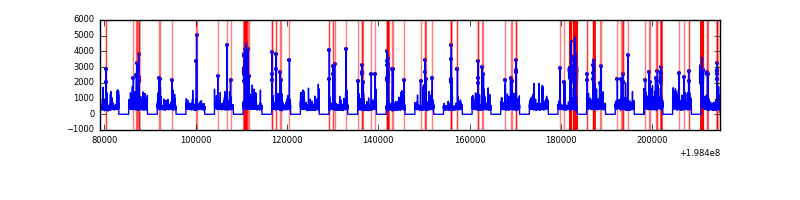 |
| D | 135814 | 90625 | 0 | 0 | 0.00% | 0.00% | 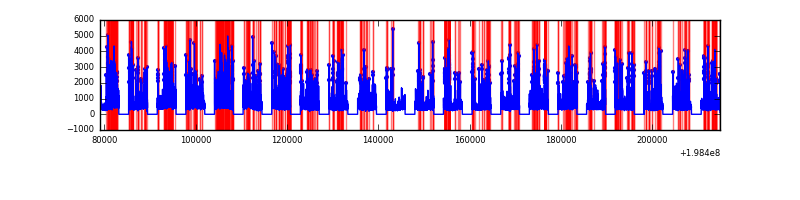 |
Top three noisy pixels from each quadrant. If the there are fewer than three noisy pixels in the level2.evt file, extra rows are filled as -1
| Pixel properties | Quadrant properties | ||||||
|---|---|---|---|---|---|---|---|
| Quadrant | DetID | PixID | Counts | Sigma | Mean | Median | Sigma |
| A | 0 | 29 | 4544 | 11.54 | 1167 | 1092 | 299.1 |
| A | 7 | 110 | 3922 | 9.46 | 1167 | 1092 | 299.1 |
| A | 9 | 19 | 3525 | 8.13 | 1167 | 1092 | 299.1 |
| B | 2 | 9 | 3905 | 12.26 | 1162 | 1109 | 228.0 |
| B | 12 | 226 | 3288 | 9.56 | 1162 | 1109 | 228.0 |
| B | 5 | 128 | 3231 | 9.31 | 1162 | 1109 | 228.0 |
| C | 1 | 80 | 3636 | 7.96 | 1196 | 1108 | 317.5 |
| C | 1 | 81 | 3588 | 7.81 | 1196 | 1108 | 317.5 |
| C | 9 | 188 | 3166 | 6.48 | 1196 | 1108 | 317.5 |
| D | 6 | 44 | 2932 | 6.64 | 1106 | 1005 | 290.4 |
| D | 6 | 231 | 2923 | 6.6 | 1106 | 1005 | 290.4 |
| D | 7 | 3 | 2803 | 6.19 | 1106 | 1005 | 290.4 |
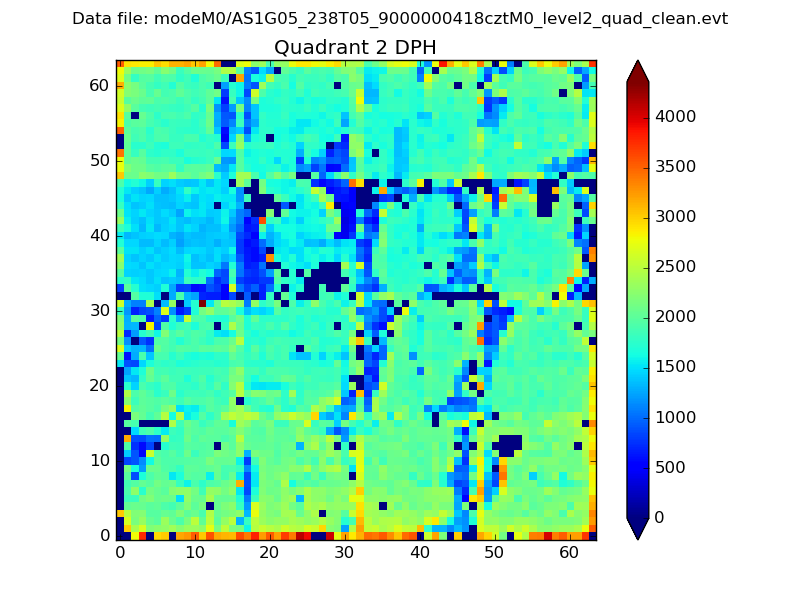
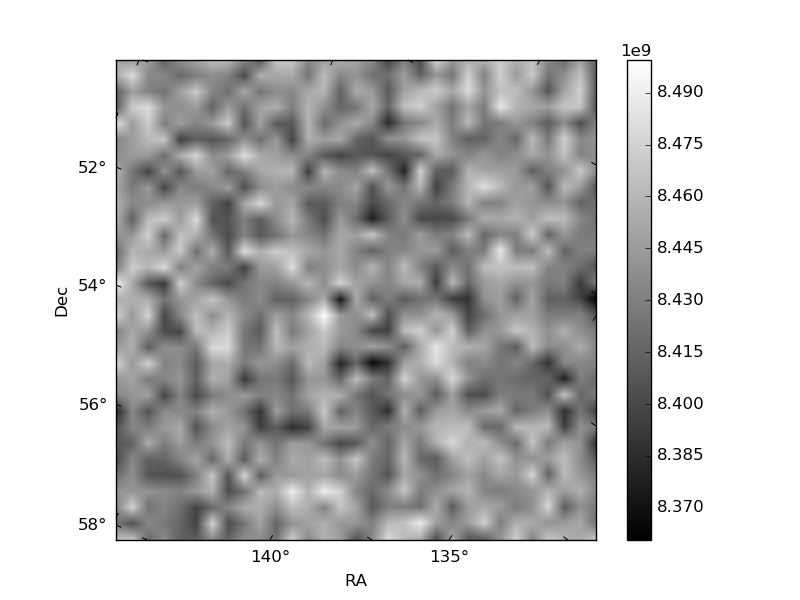
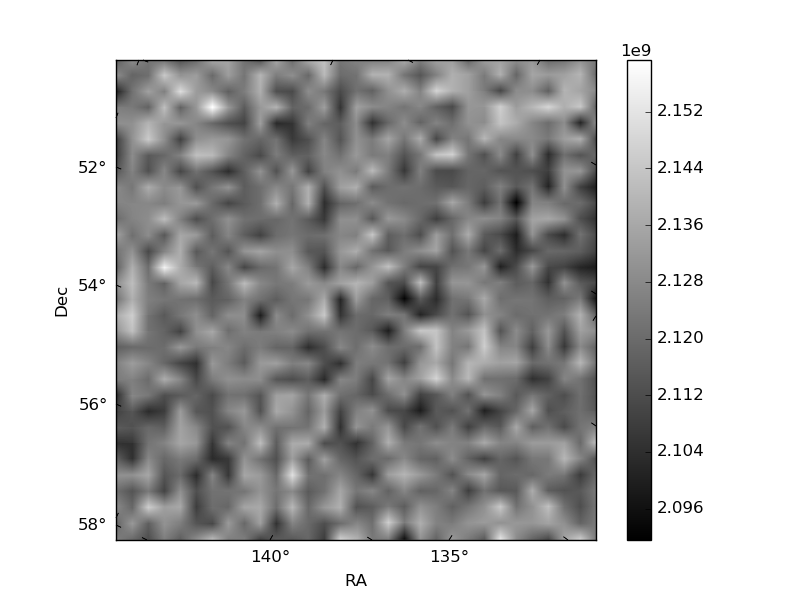
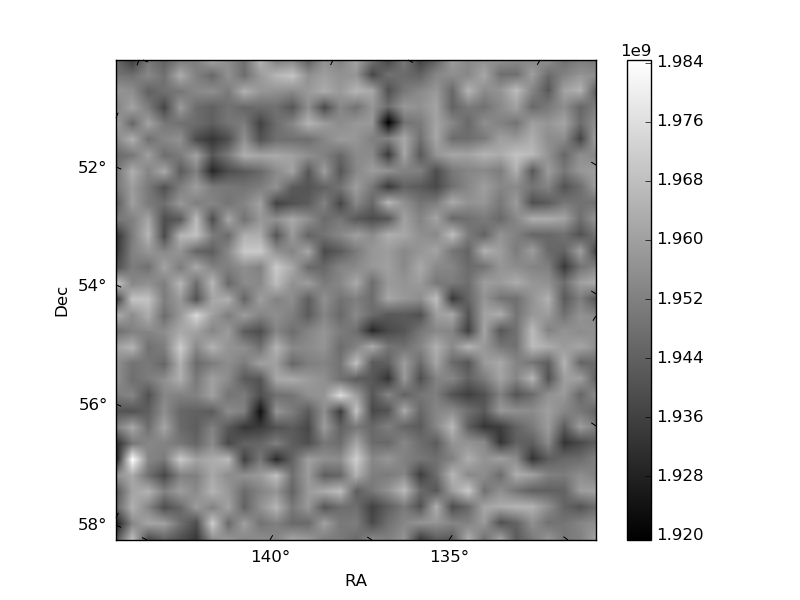
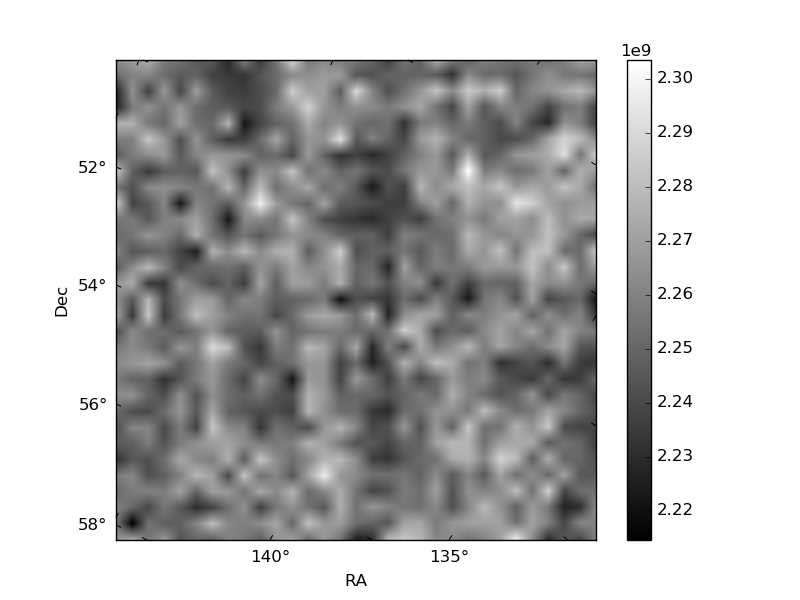
Histogram calculated using DETX and DETY for each event in the final _common_clean file
| Quadrant A | 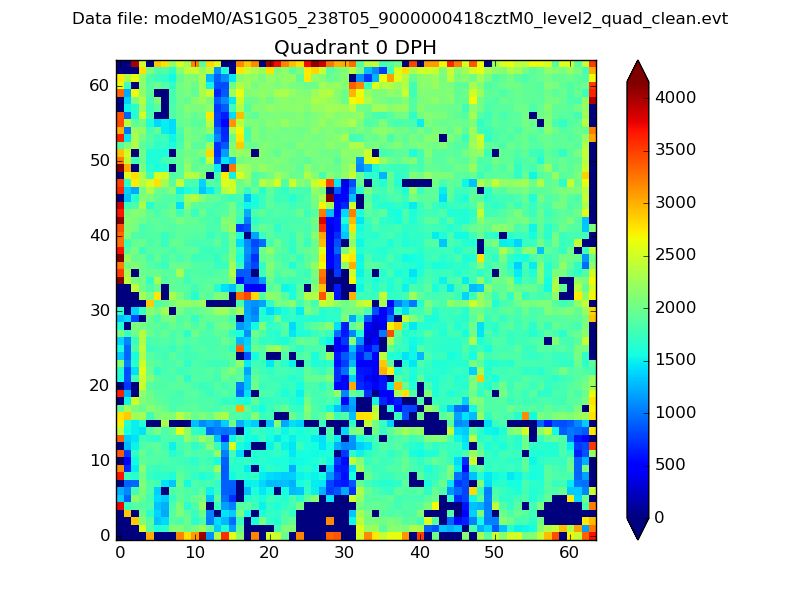 |
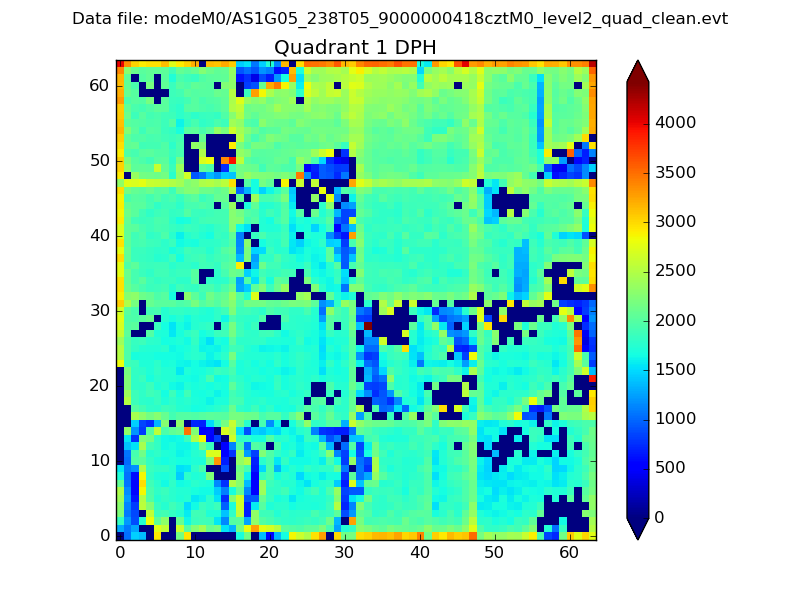 |
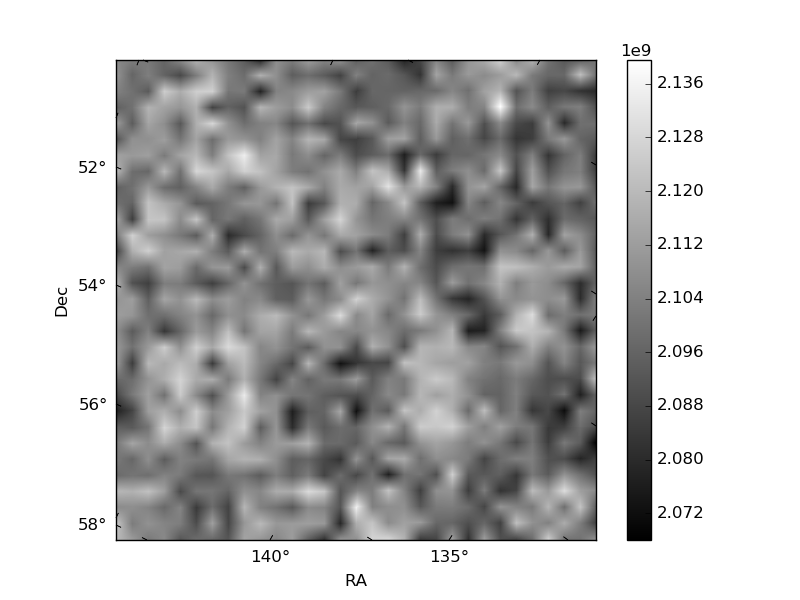
Quadrant B |
|---|---|---|---|
| Quadrant D | 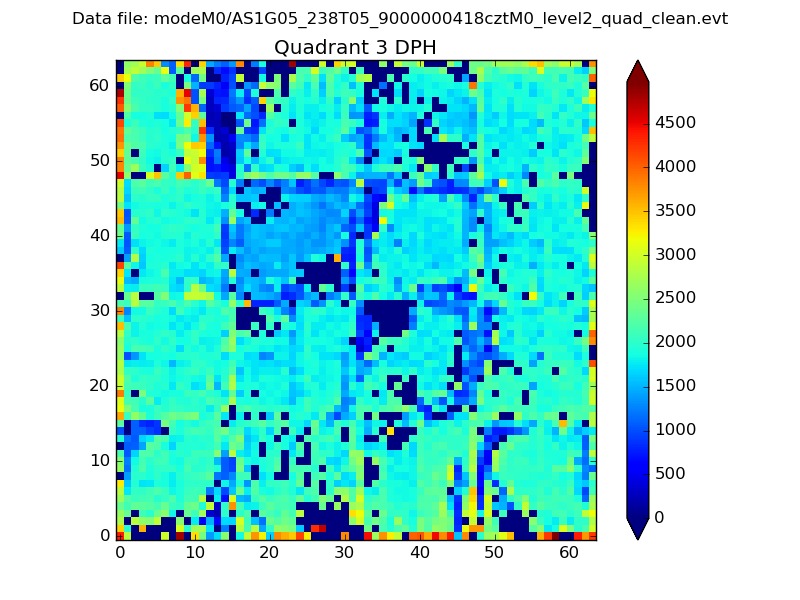 |
 |
Quadrant C |
| Plot type | Count rate plots | Images |
|---|---|---|
| Comparison with Poisson distribution Blue bars denote a histogram of data divided into 1 sec bins. Red curve is a Poisson curve with rate = median count rate of data. |
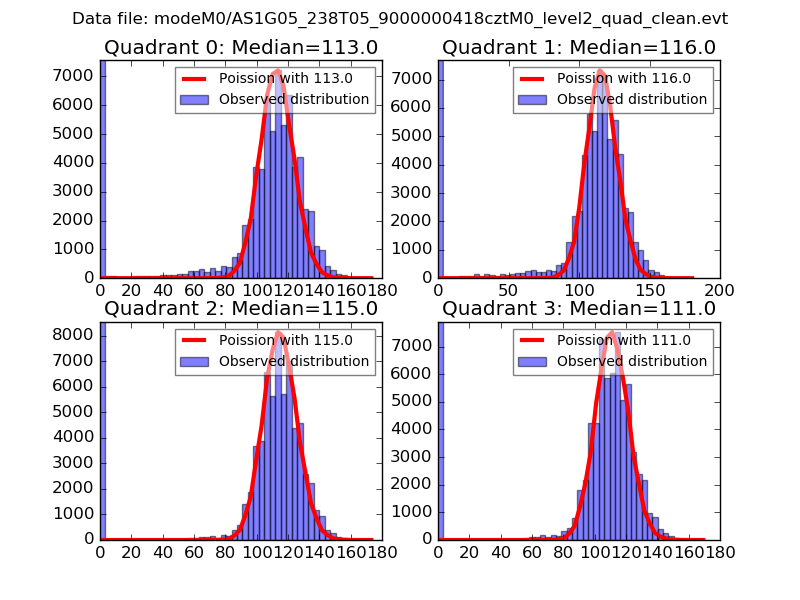 |
 |
| Quadrant-wise count rates Data is divided into 100 sec bins |
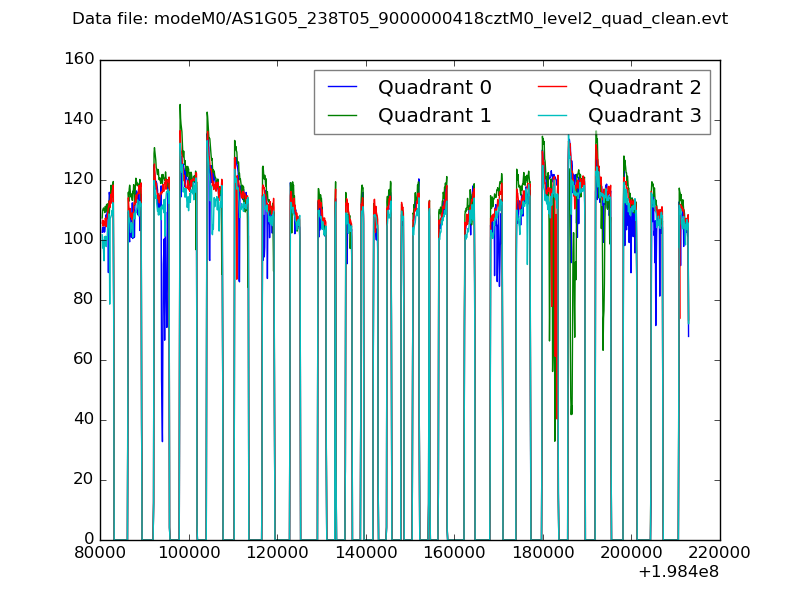 |
|
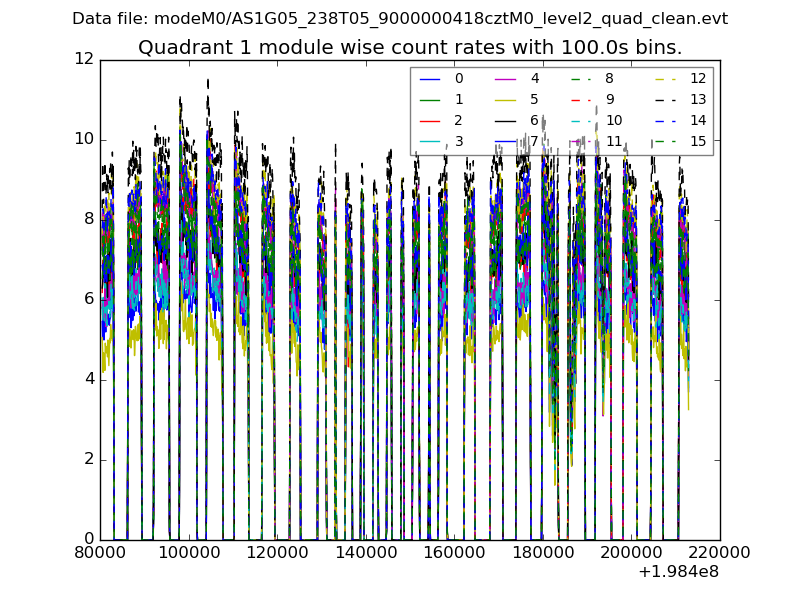
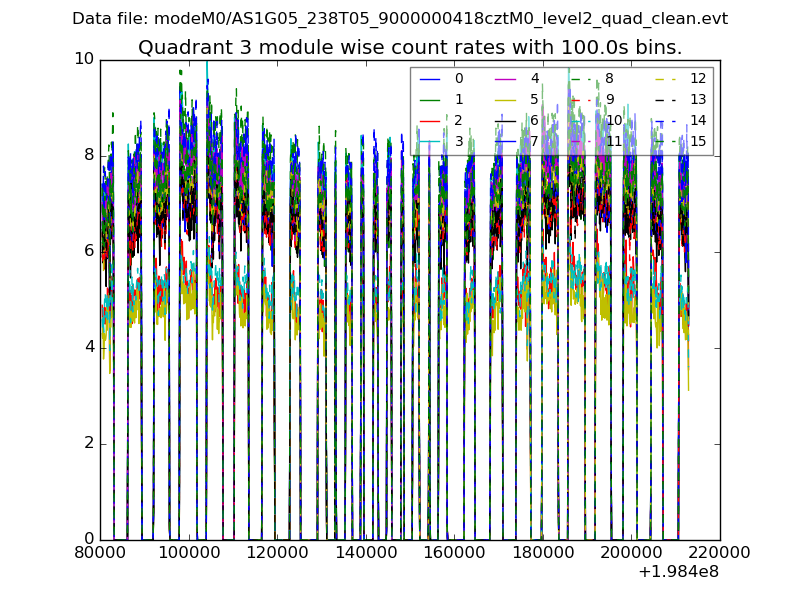
| Module-wise count rates for Quadrant A Data is divided into 100 sec bins |
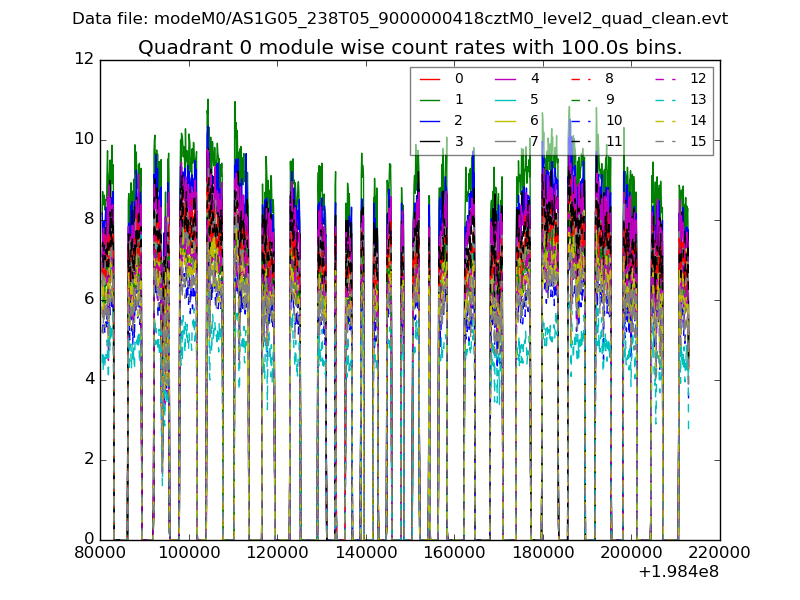 |
 |
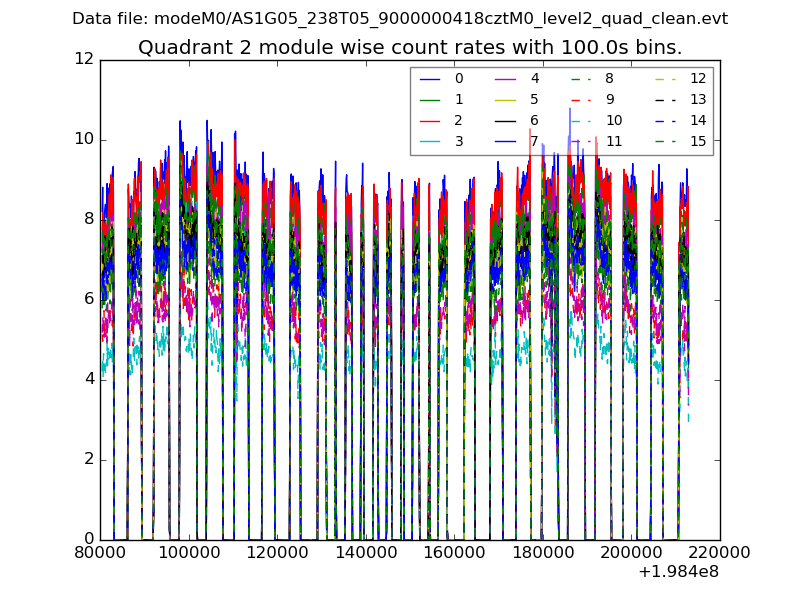
| Module-wise count rates for Quadrant B Data is divided into 100 sec bins |
 |
 |
| Module-wise count rates for Quadrant C Data is divided into 100 sec bins |
 |
 |
| Module-wise count rates for Quadrant D Data is divided into 100 sec bins |
 |
 |
| Parameter | Plot |
|---|---|
| CZT HV Monitor | 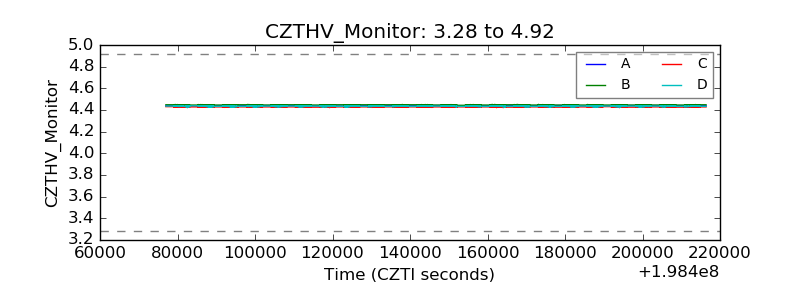 |
| D_VDD | 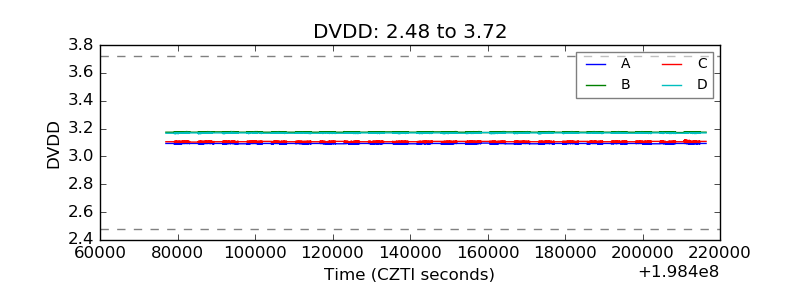 |
| Temperature 1 | 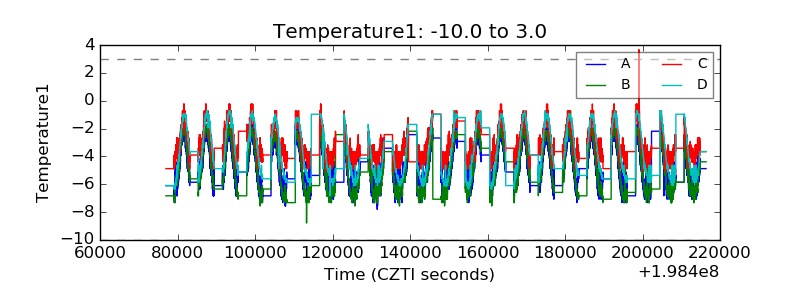 |
| Veto HV Monitor | 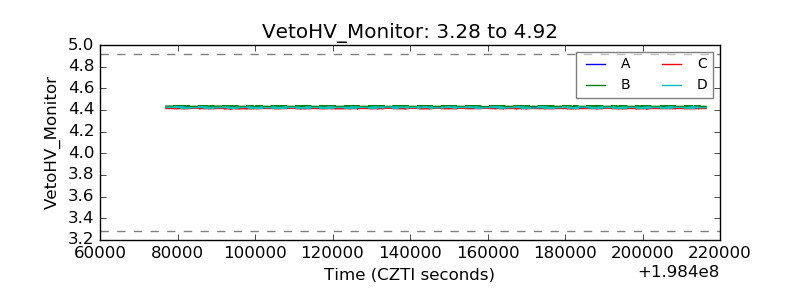 |
| Veto LLD | 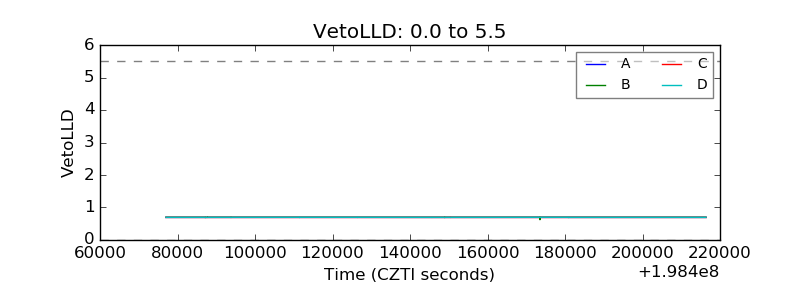 |
| Alpha Counter | 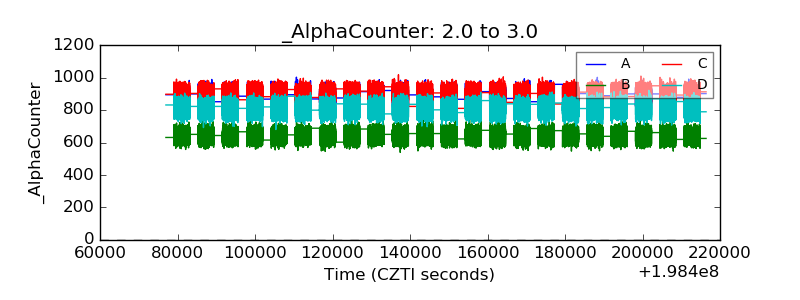 |
| _CPM_Rate | 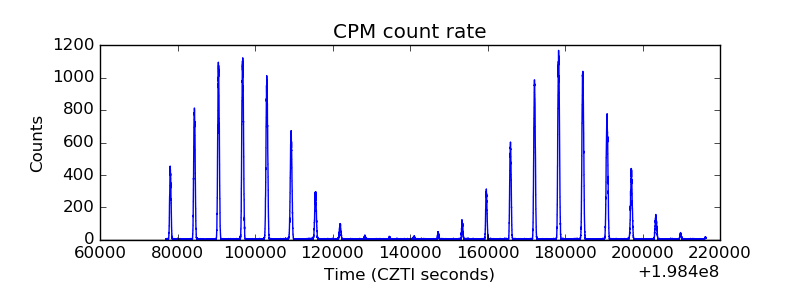 |
| CZT Counter | 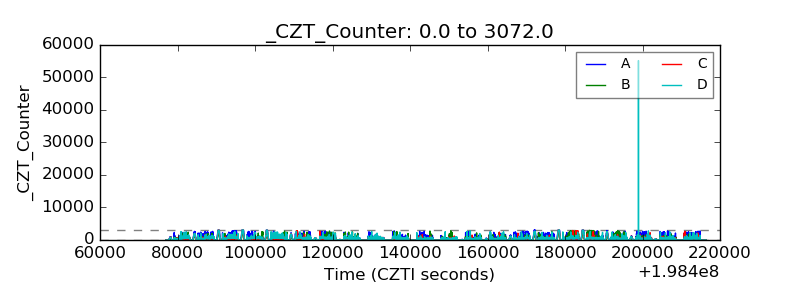 |
| +2.5 Volts monitor | 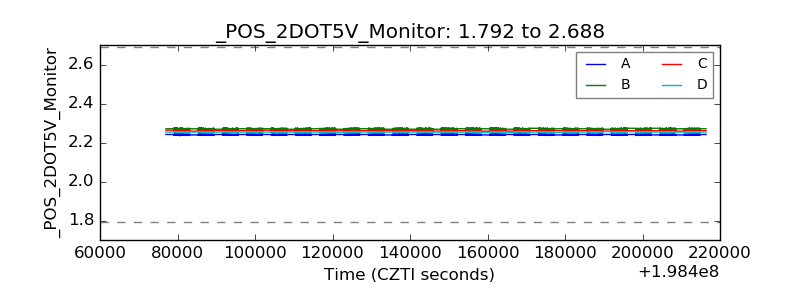 |
| +5 Volts monitor | 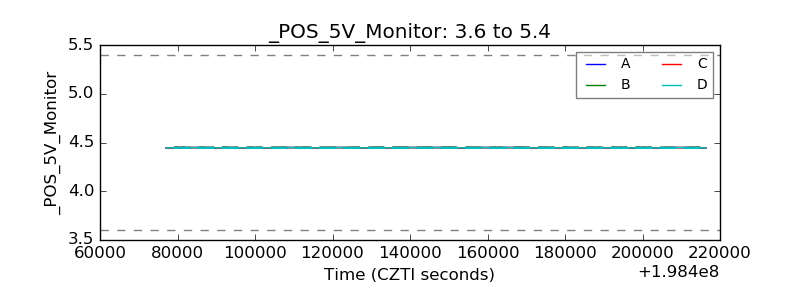 |
| _ROLL_ROT | 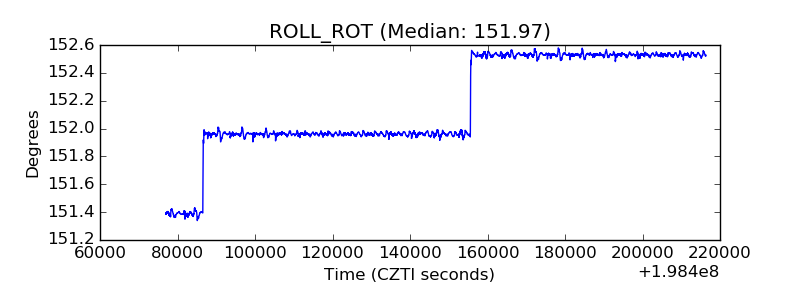 |
| _Roll_DEC | 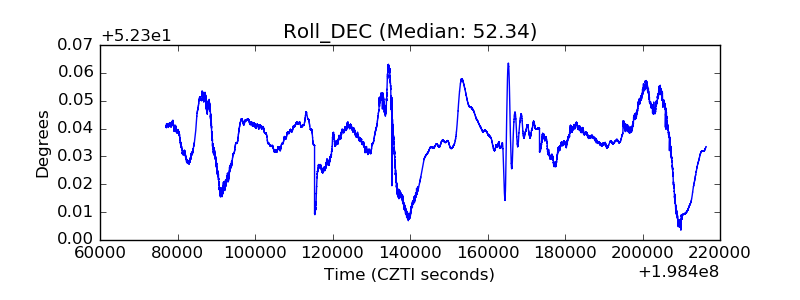 |
| _Roll_RA | 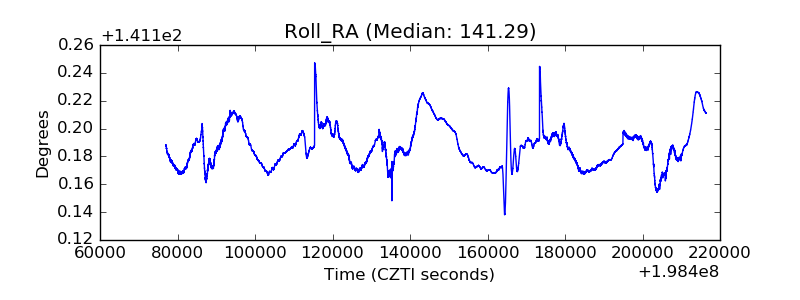 |
| Veto Counter | 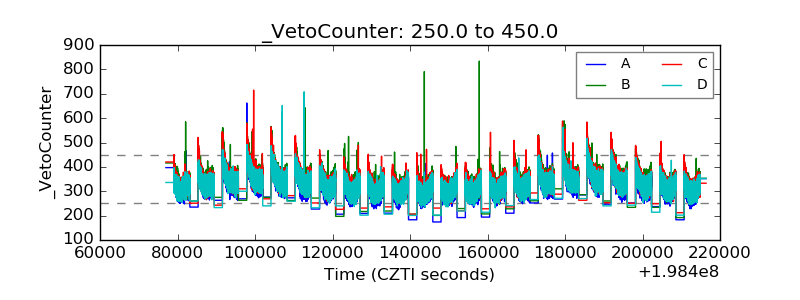 |