| Param | Original file | Final file |
|---|---|---|
| Filename | modeM0/AS1G05_238T05_9000000418_02979cztM0_level2.evt | modeM0/AS1G05_238T05_9000000418_02979cztM0_level2_quad_clean.evt |
| Size (bytes) | 423,829,440 | 55,575,360 |
| Size | 404.2 MB | 53.0 MB |
| Events in quadrant A | 4,349,758 | 325,814 |
| Events in quadrant B | 2,762,139 | 347,017 |
| Events in quadrant C | 2,302,785 | 335,938 |
| Events in quadrant D | 3,082,105 | 323,769 |
| Mode M0 | |||
|---|---|---|---|
| Quadrant | BADHDUFLAG | Total packets | Discarded packets |
| A | 0 | 16248 | 3 |
| B | 0 | 11465 | 2 |
| C | 0 | 10338 | 2 |
| D | 0 | 12592 | 2 |
| Mode M9 | |||
|---|---|---|---|
| Quadrant | BADHDUFLAG | Total packets | Discarded packets |
| A | 0 | 27 | 0 |
| B | 0 | 27 | 0 |
| C | 0 | 27 | 0 |
| D | 0 | 28 | 0 |
| Mode SS | |||
|---|---|---|---|
| Quadrant | BADHDUFLAG | Total packets | Discarded packets |
| A | 0 | 102 | 0 |
| B | 0 | 102 | 0 |
| C | 0 | 102 | 0 |
| D | 0 | 102 | 0 |
| Quadrant | Total seconds | Saturated seconds | Saturation percentage |
|---|---|---|---|
| A | 4987 | 528 | 10.587528% |
| B | 4987 | 51 | 1.022659% |
| C | 4987 | 15 | 0.300782% |
| D | 4987 | 81 | 1.624223% |
Noise dominated data is calculated using 1-second bins in cleaned event files. If a bin has >2000 counts, and if more than 50% of those come from <1% of pixels, then it is considered to be noise-dominated and hence unusable.
| Quadrant | # 1 sec bins | Bins with >0 counts | Bins with >2000 counts | High rate bins dominated by noise | Noise dominated (total time) | Noise dominated (detector-on time) | Marked lightcurve |
|---|---|---|---|---|---|---|---|
| A | 7143 | 4988 | 309 | 309 | 4.33% | 6.19% | 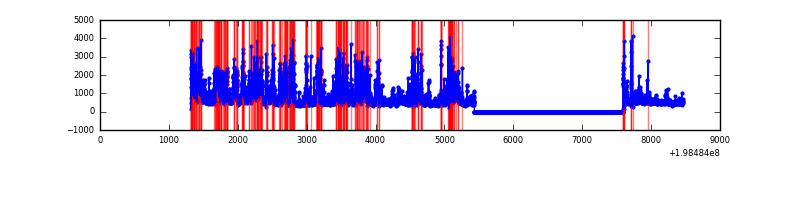 |
| B | 7143 | 4988 | 36 | 36 | 0.50% | 0.72% | 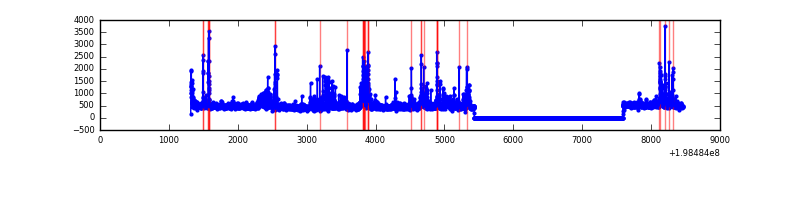 |
| C | 7143 | 4988 | 11 | 11 | 0.15% | 0.22% | 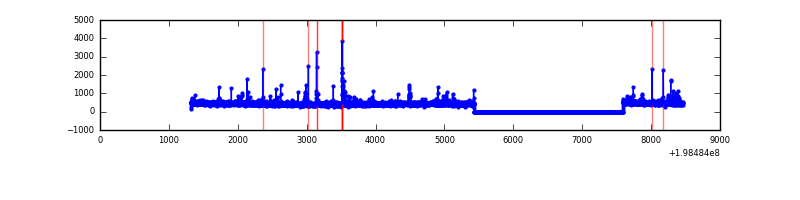 |
| D | 7143 | 4988 | 74 | 74 | 1.04% | 1.48% | 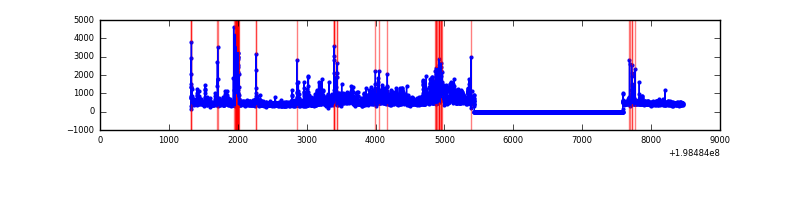 |
Top three noisy pixels from each quadrant. If the there are fewer than three noisy pixels in the level2.evt file, extra rows are filled as -1
| Pixel properties | Quadrant properties | ||||||
|---|---|---|---|---|---|---|---|
| Quadrant | DetID | PixID | Counts | Sigma | Mean | Median | Sigma |
| A | 13 | 9 | 1941094 | 17694.29 | 543 | 532 | 109.7 |
| A | 0 | 50 | 206076 | 1874.18 | 543 | 532 | 109.7 |
| A | 0 | 31 | 35366 | 317.62 | 543 | 532 | 109.7 |
| B | 5 | 70 | 203289 | 1853.03 | 571 | 558 | 109.4 |
| B | 2 | 249 | 171718 | 1564.46 | 571 | 558 | 109.4 |
| B | 0 | 219 | 96013 | 872.49 | 571 | 558 | 109.4 |
| C | 6 | 80 | 77045 | 610.27 | 540 | 542 | 125.4 |
| C | 10 | 55 | 40446 | 318.32 | 540 | 542 | 125.4 |
| C | 15 | 208 | 31799 | 249.34 | 540 | 542 | 125.4 |
| D | 13 | 114 | 599297 | 4643.26 | 537 | 523 | 129.0 |
| D | 1 | 31 | 216764 | 1676.86 | 537 | 523 | 129.0 |
| D | 14 | 129 | 57682 | 443.25 | 537 | 523 | 129.0 |
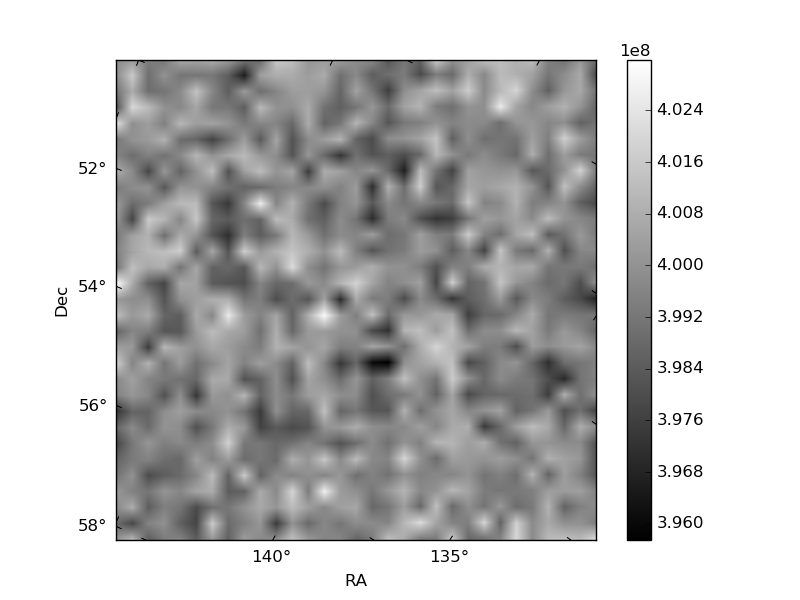
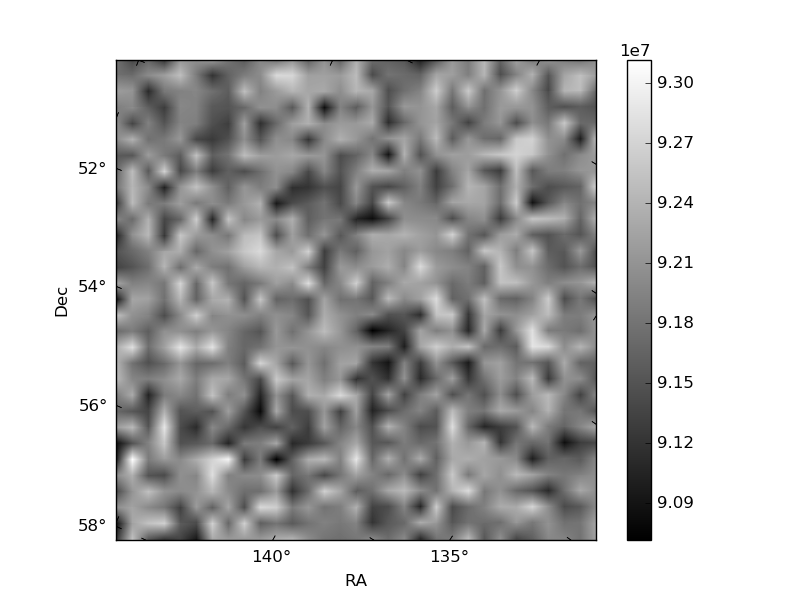
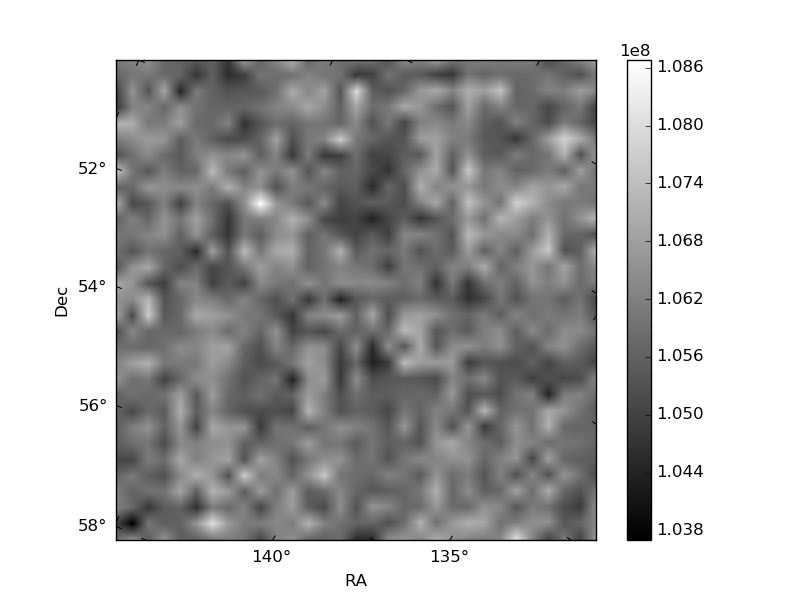
Histogram calculated using DETX and DETY for each event in the final _common_clean file
| Quadrant A | 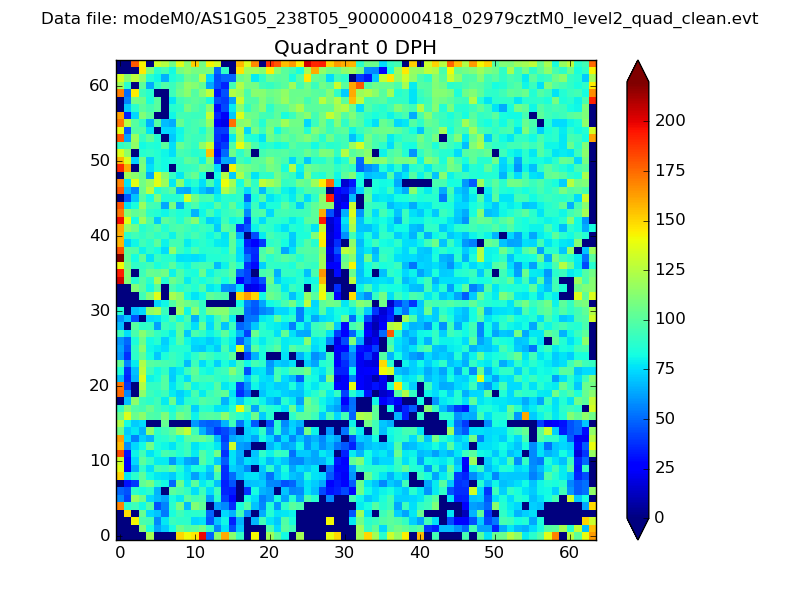 |
 |
Quadrant B |
|---|---|---|---|
| Quadrant D | 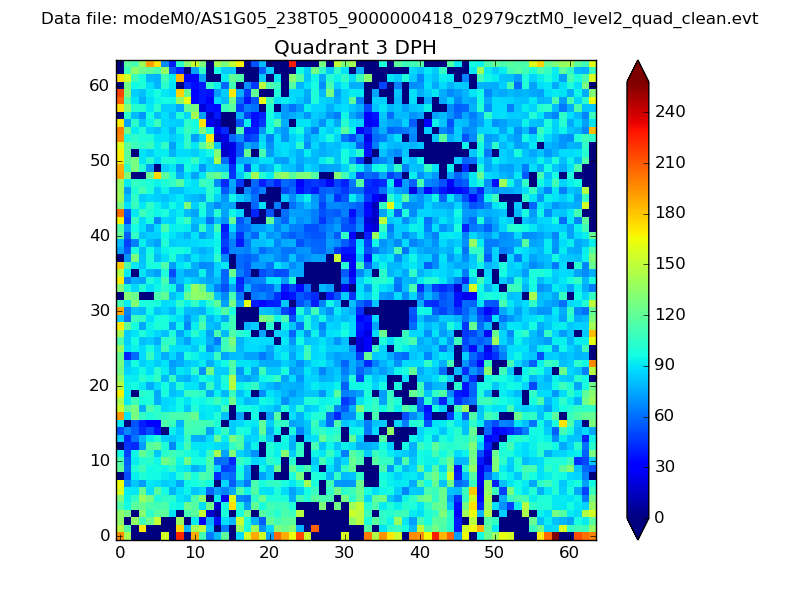 |
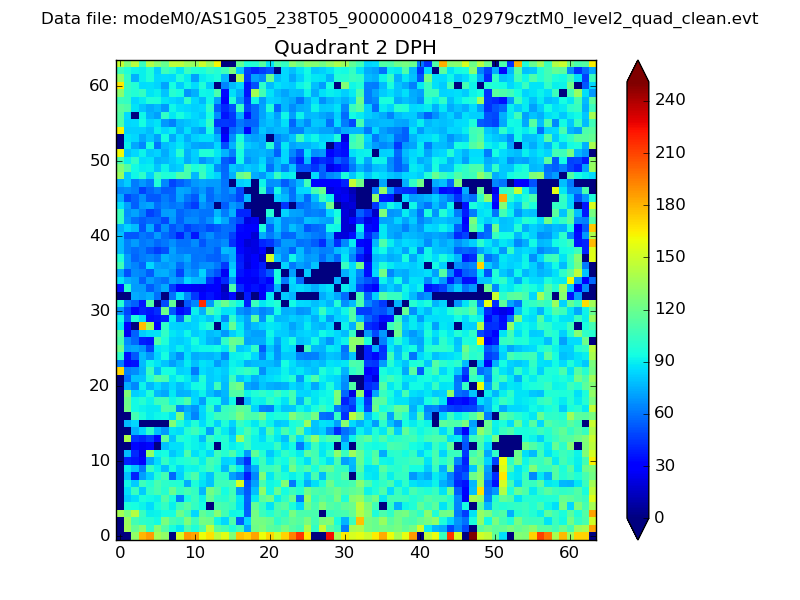 |
Quadrant C |
| Plot type | Count rate plots | Images |
|---|---|---|
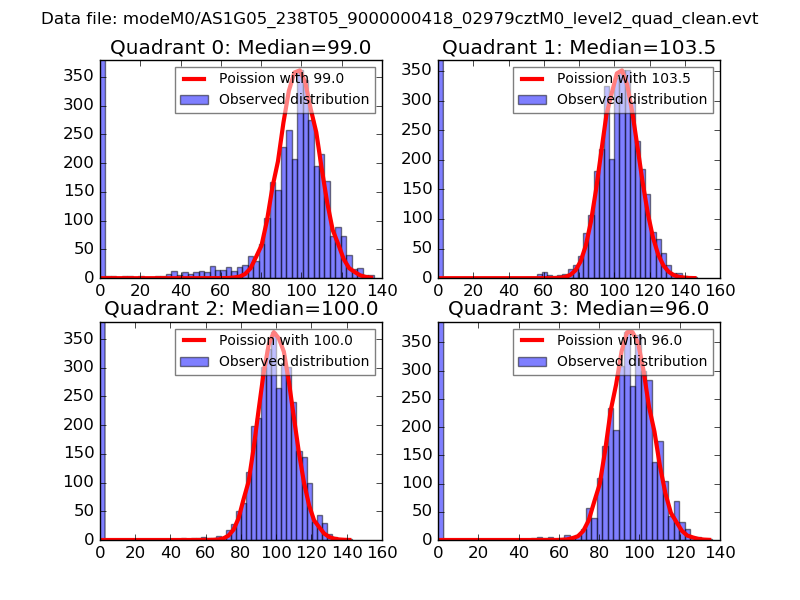
| Comparison with Poisson distribution Blue bars denote a histogram of data divided into 1 sec bins. Red curve is a Poisson curve with rate = median count rate of data. |
 |
 |
| Quadrant-wise count rates Data is divided into 100 sec bins |
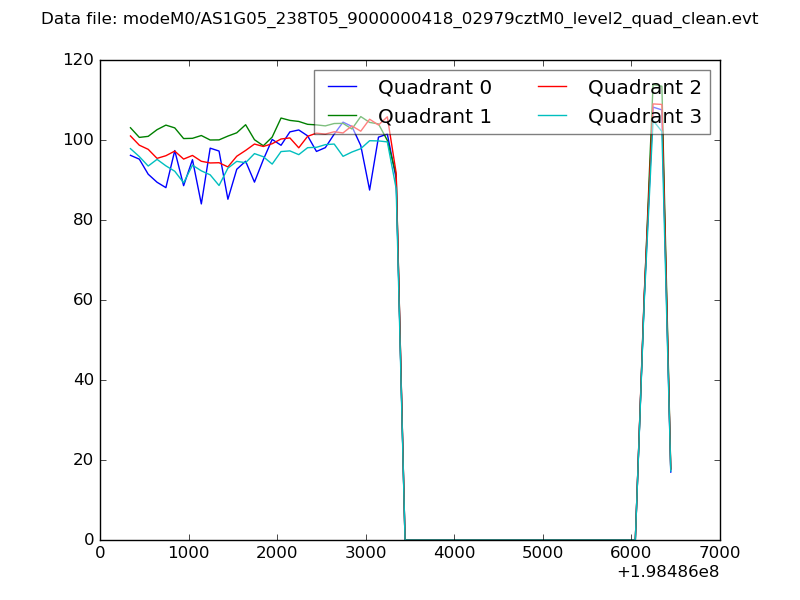 |
|
| Module-wise count rates for Quadrant A Data is divided into 100 sec bins |
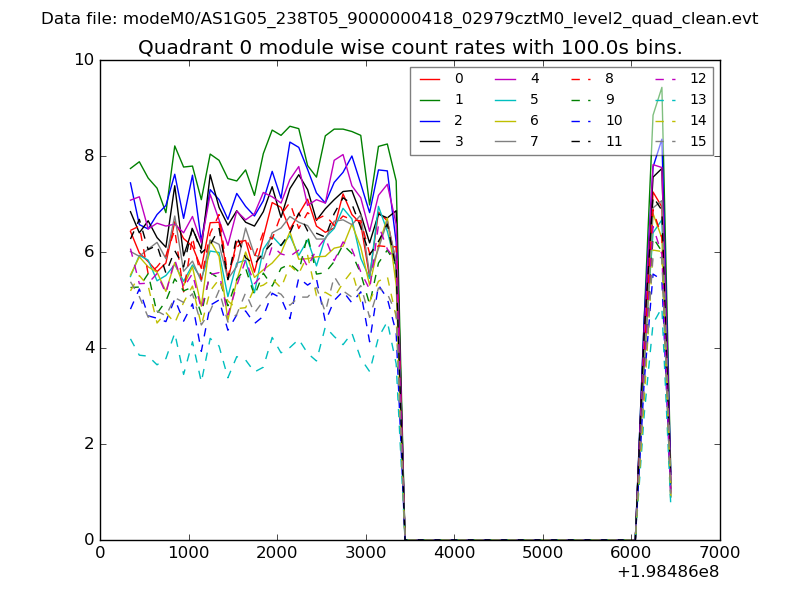 |
 |
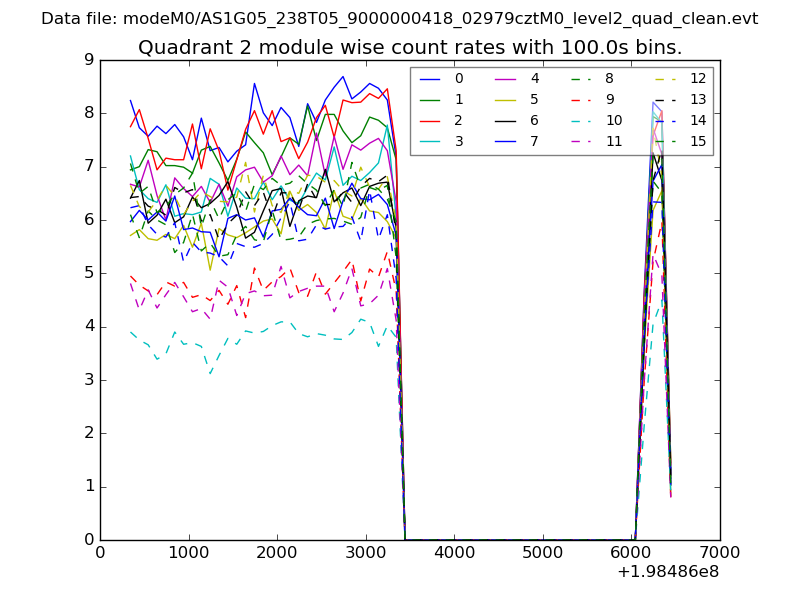
| Module-wise count rates for Quadrant B Data is divided into 100 sec bins |
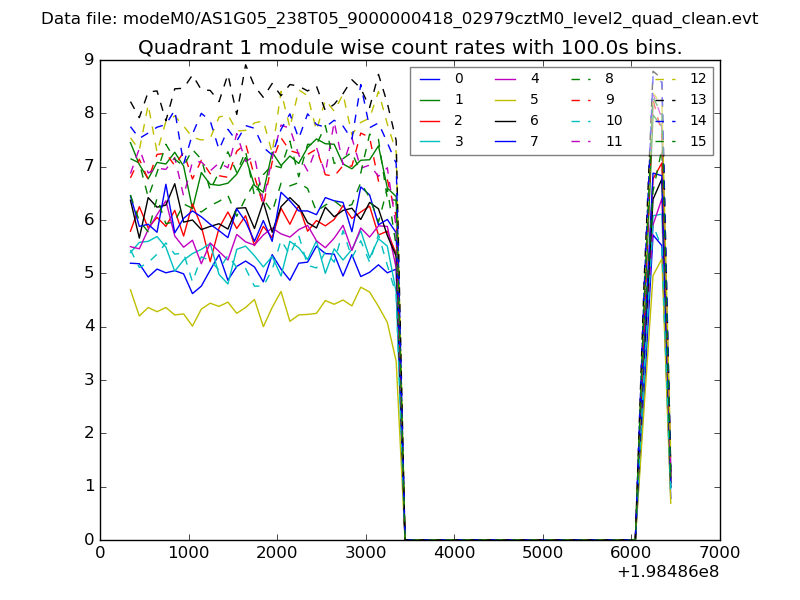 |
 |
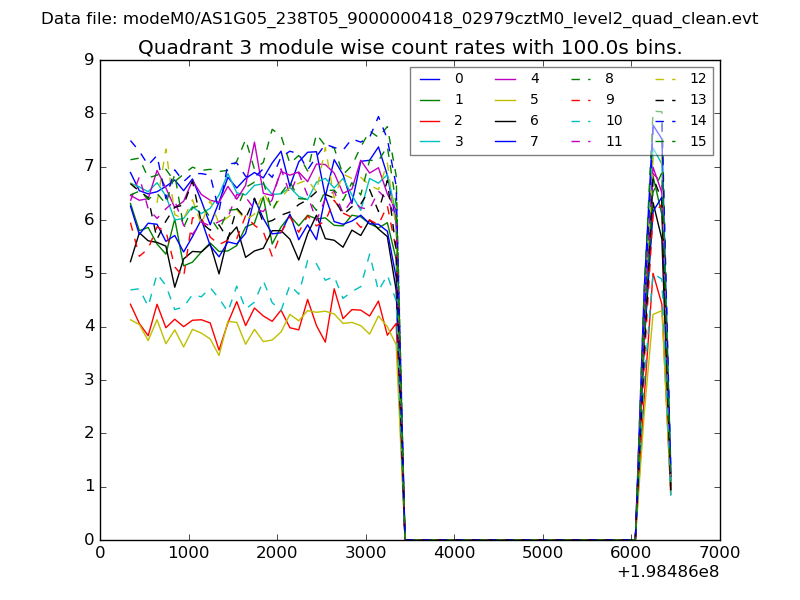
| Module-wise count rates for Quadrant C Data is divided into 100 sec bins |
 |
 |
| Module-wise count rates for Quadrant D Data is divided into 100 sec bins |
 |
 |
| Parameter | Plot |
|---|---|
| CZT HV Monitor | 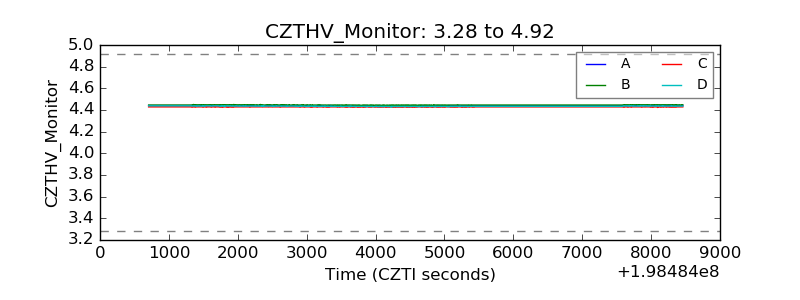 |
| D_VDD | 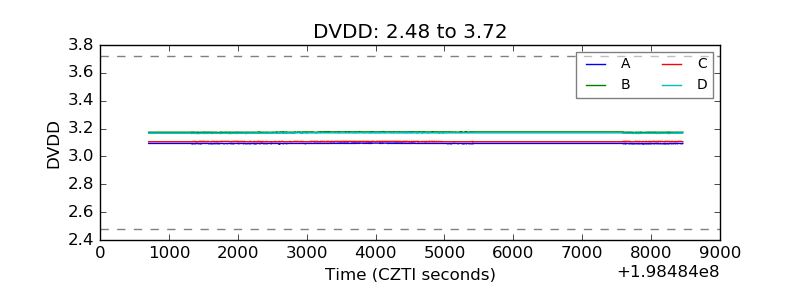 |
| Temperature 1 | 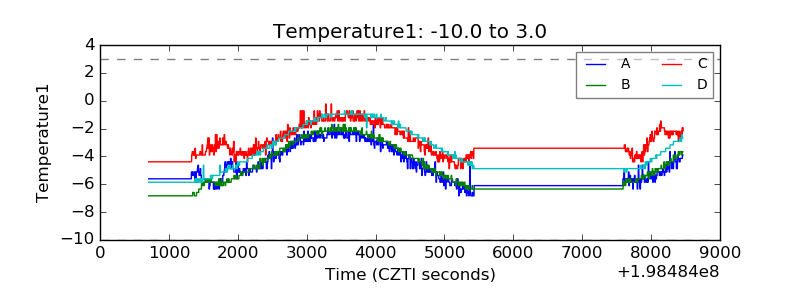 |
| Veto HV Monitor | 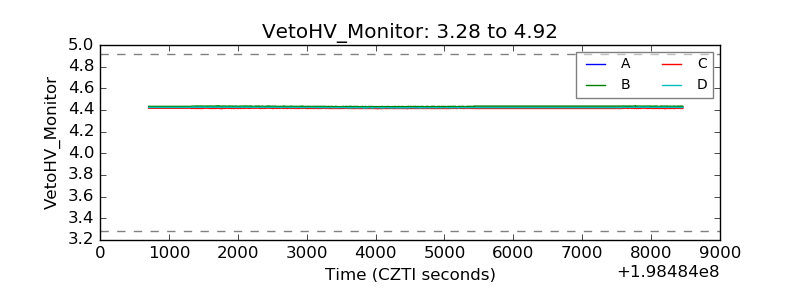 |
| Veto LLD | 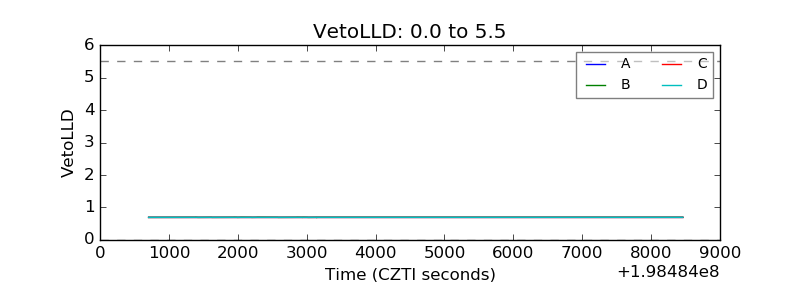 |
| Alpha Counter | 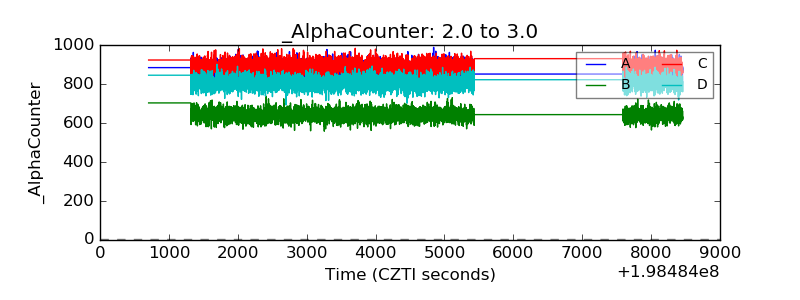 |
| _CPM_Rate | 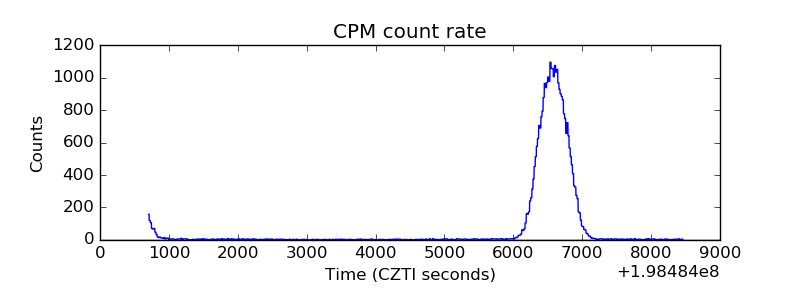 |
| CZT Counter | 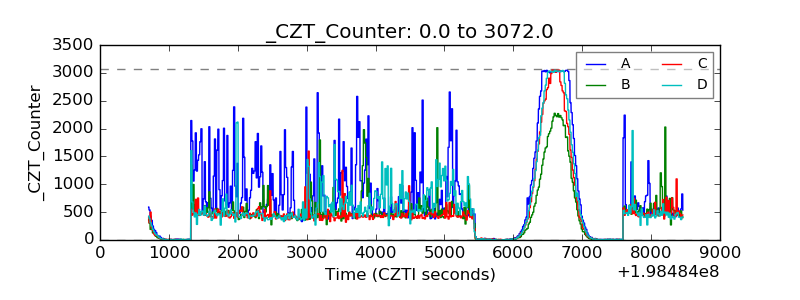 |
| +2.5 Volts monitor | 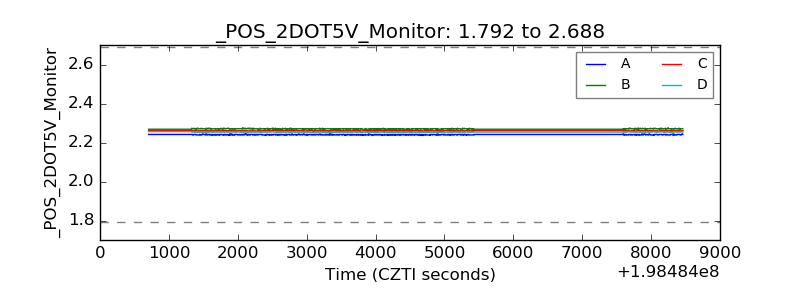 |
| +5 Volts monitor |  |
| _ROLL_ROT | 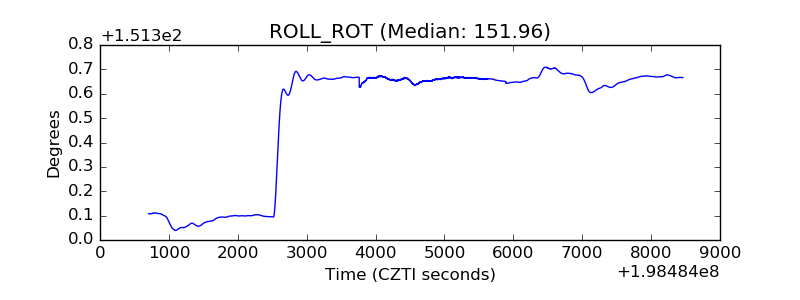 |
| _Roll_DEC | 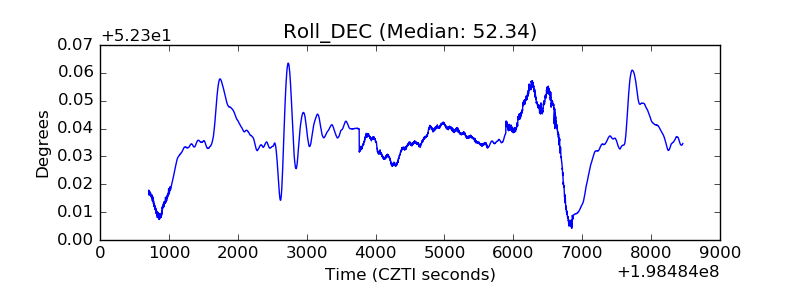 |
| _Roll_RA | 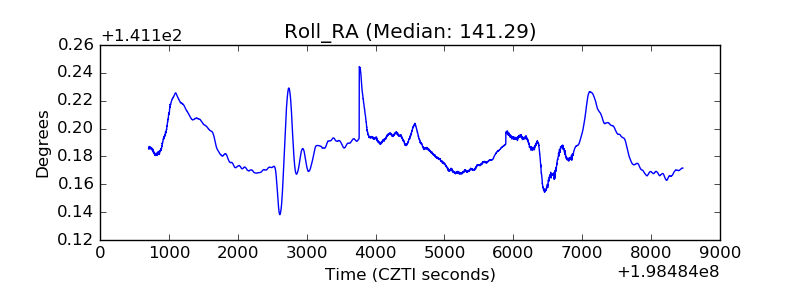 |
| Veto Counter | 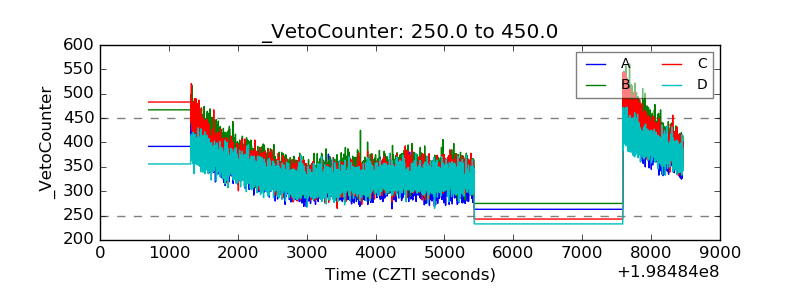 |