| Param | Original file | Final file |
|---|---|---|
| Filename | modeM0/AS1G05_238T05_9000000418_02980cztM0_level2.evt | modeM0/AS1G05_238T05_9000000418_02980cztM0_level2_quad_clean.evt |
| Size (bytes) | 476,265,600 | 71,539,200 |
| Size | 454.2 MB | 68.2 MB |
| Events in quadrant A | 5,339,732 | 409,501 |
| Events in quadrant B | 2,747,550 | 481,848 |
| Events in quadrant C | 2,369,738 | 464,355 |
| Events in quadrant D | 3,614,475 | 446,363 |
| Mode M0 | |||
|---|---|---|---|
| Quadrant | BADHDUFLAG | Total packets | Discarded packets |
| A | 0 | 19355 | 3 |
| B | 0 | 11350 | 2 |
| C | 0 | 10593 | 2 |
| D | 0 | 14265 | 2 |
| Mode M9 | |||
|---|---|---|---|
| Quadrant | BADHDUFLAG | Total packets | Discarded packets |
| A | 0 | 43 | 0 |
| B | 0 | 43 | 0 |
| C | 0 | 43 | 0 |
| D | 0 | 43 | 0 |
| Mode SS | |||
|---|---|---|---|
| Quadrant | BADHDUFLAG | Total packets | Discarded packets |
| A | 0 | 108 | 0 |
| B | 0 | 108 | 0 |
| C | 0 | 108 | 0 |
| D | 0 | 108 | 0 |
| Quadrant | Total seconds | Saturated seconds | Saturation percentage |
|---|---|---|---|
| A | 5191 | 961 | 18.512811% |
| B | 5191 | 16 | 0.308226% |
| C | 5191 | 6 | 0.115585% |
| D | 5191 | 74 | 1.425544% |
Noise dominated data is calculated using 1-second bins in cleaned event files. If a bin has >2000 counts, and if more than 50% of those come from <1% of pixels, then it is considered to be noise-dominated and hence unusable.
| Quadrant | # 1 sec bins | Bins with >0 counts | Bins with >2000 counts | High rate bins dominated by noise | Noise dominated (total time) | Noise dominated (detector-on time) | Marked lightcurve |
|---|---|---|---|---|---|---|---|
| A | 9503 | 5193 | 786 | 786 | 8.27% | 15.14% | 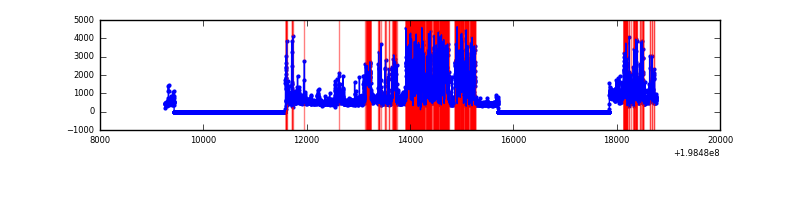 |
| B | 9503 | 5193 | 12 | 12 | 0.13% | 0.23% | 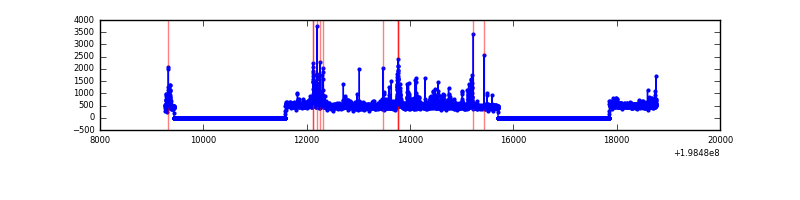 |
| C | 9503 | 5193 | 3 | 3 | 0.03% | 0.06% | 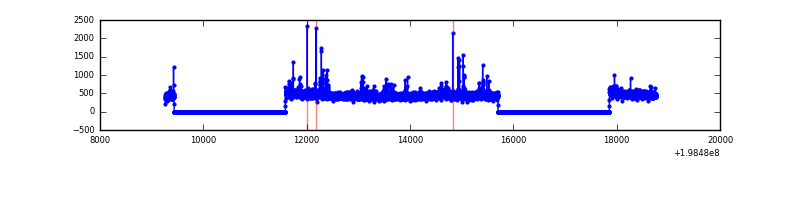 |
| D | 9503 | 5193 | 84 | 84 | 0.88% | 1.62% | 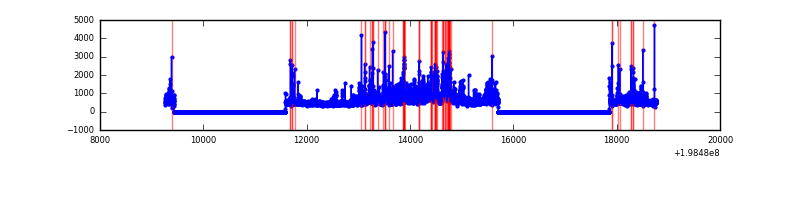 |
Top three noisy pixels from each quadrant. If the there are fewer than three noisy pixels in the level2.evt file, extra rows are filled as -1
| Pixel properties | Quadrant properties | ||||||
|---|---|---|---|---|---|---|---|
| Quadrant | DetID | PixID | Counts | Sigma | Mean | Median | Sigma |
| A | 12 | 247 | 2061396 | 18954.54 | 541 | 529 | 108.7 |
| A | 13 | 9 | 1076510 | 9896.19 | 541 | 529 | 108.7 |
| A | 0 | 31 | 31421 | 284.12 | 541 | 529 | 108.7 |
| B | 2 | 249 | 119809 | 1021.11 | 605 | 593 | 116.8 |
| B | 6 | 203 | 89303 | 759.82 | 605 | 593 | 116.8 |
| B | 0 | 219 | 84165 | 715.81 | 605 | 593 | 116.8 |
| C | 6 | 80 | 42474 | 313.11 | 575 | 578 | 133.8 |
| C | 15 | 208 | 25578 | 186.83 | 575 | 578 | 133.8 |
| C | 10 | 55 | 17270 | 124.75 | 575 | 578 | 133.8 |
| D | 13 | 114 | 926114 | 6770.39 | 574 | 558 | 136.7 |
| D | 2 | 136 | 194876 | 1421.42 | 574 | 558 | 136.7 |
| D | 1 | 31 | 91834 | 667.68 | 574 | 558 | 136.7 |
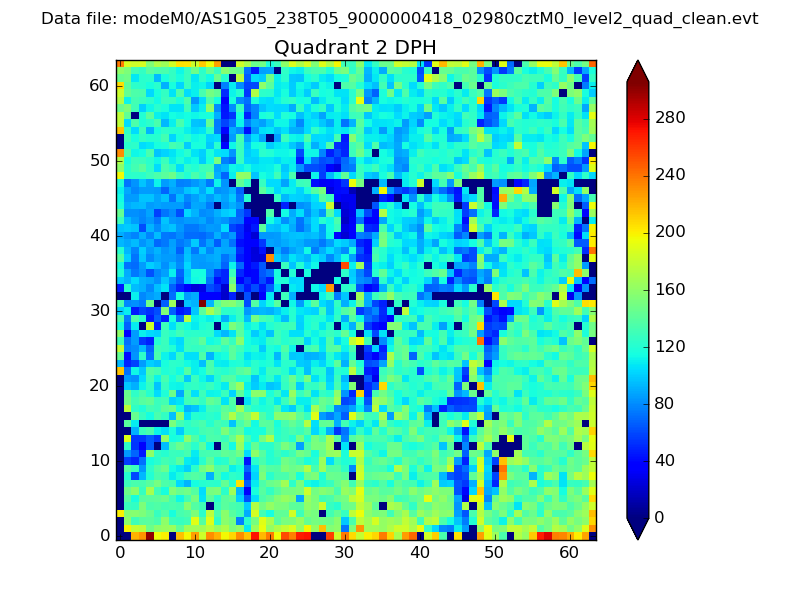
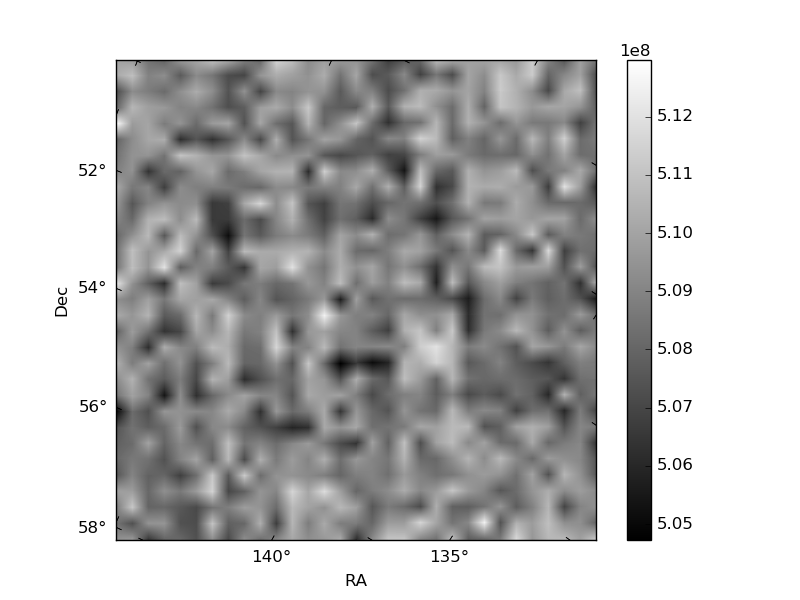
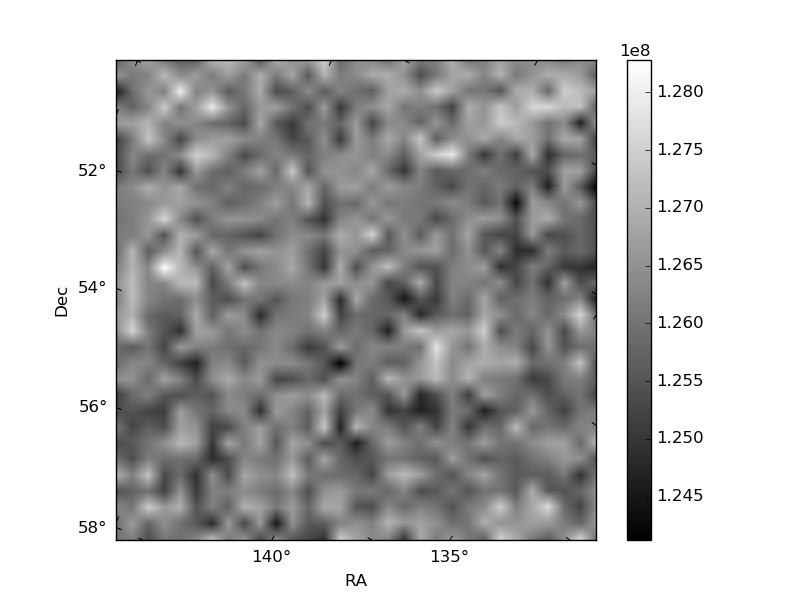
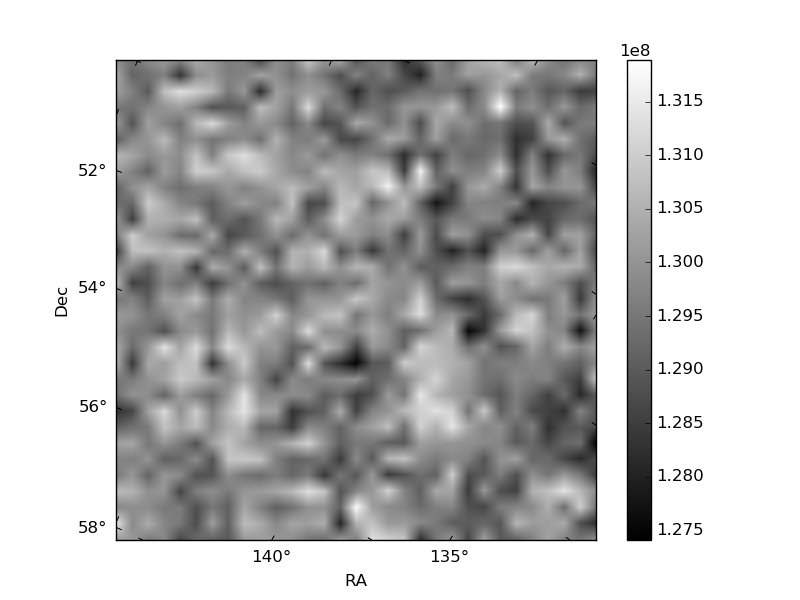
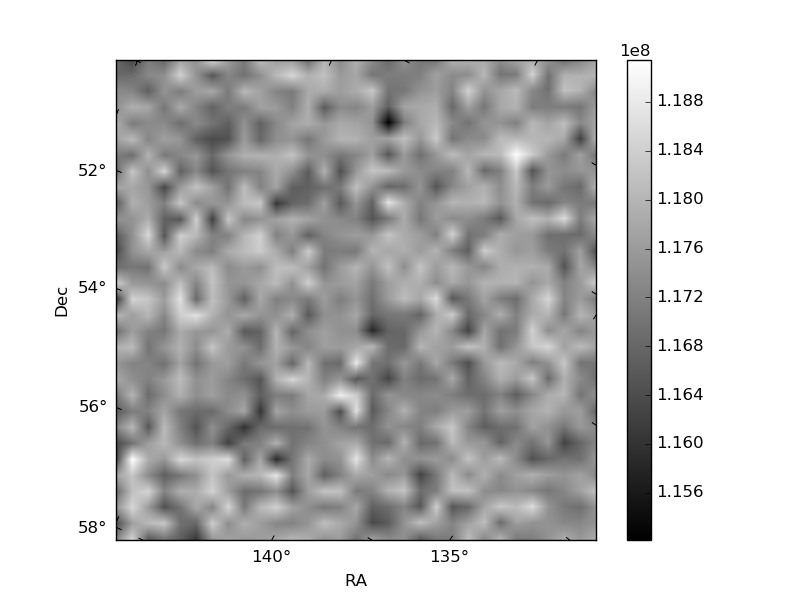
Histogram calculated using DETX and DETY for each event in the final _common_clean file
| Quadrant A | 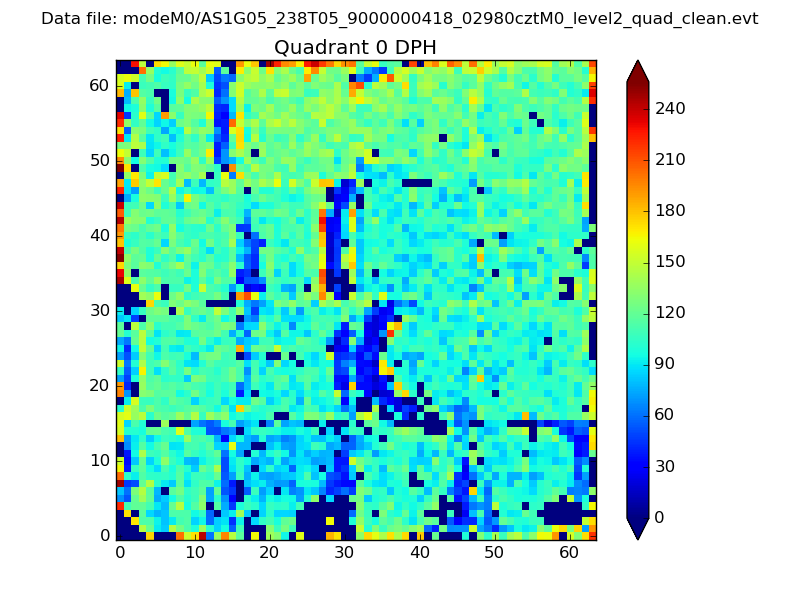 |
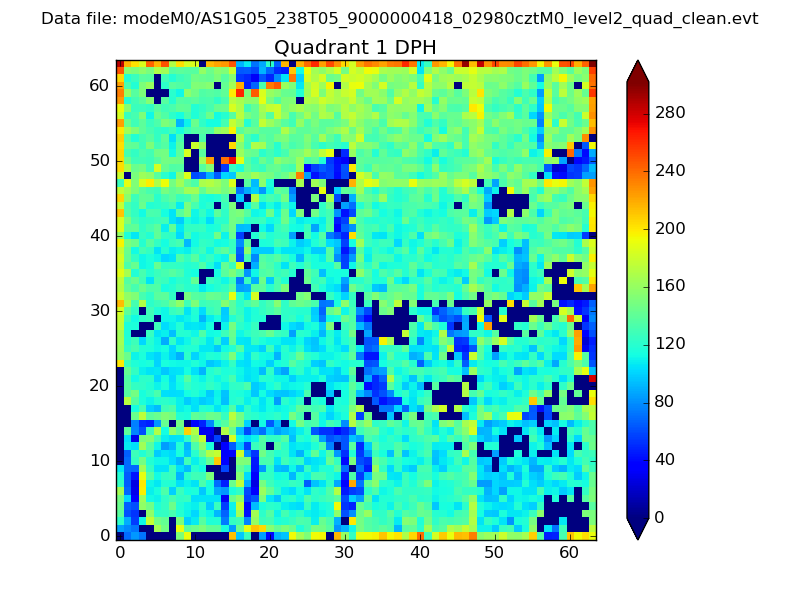 |
Quadrant B |
|---|---|---|---|
| Quadrant D | 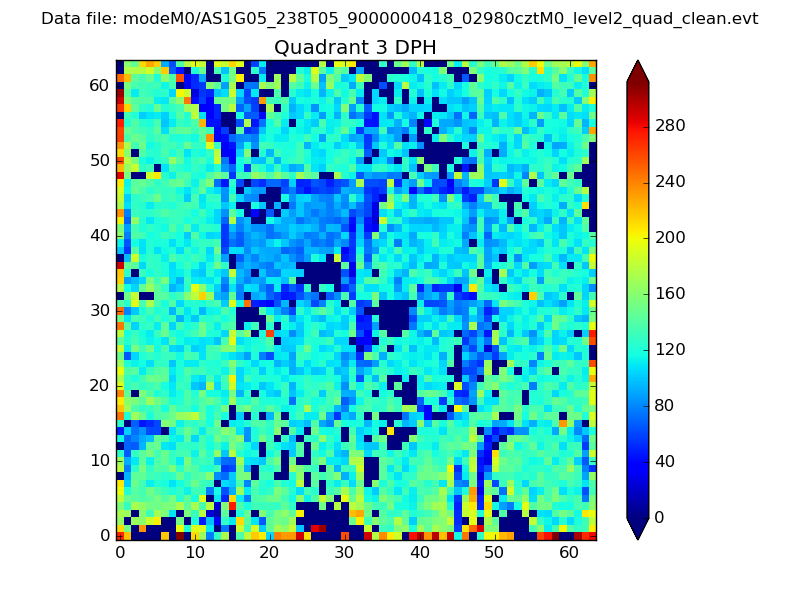 |
 |
Quadrant C |
| Plot type | Count rate plots | Images |
|---|---|---|
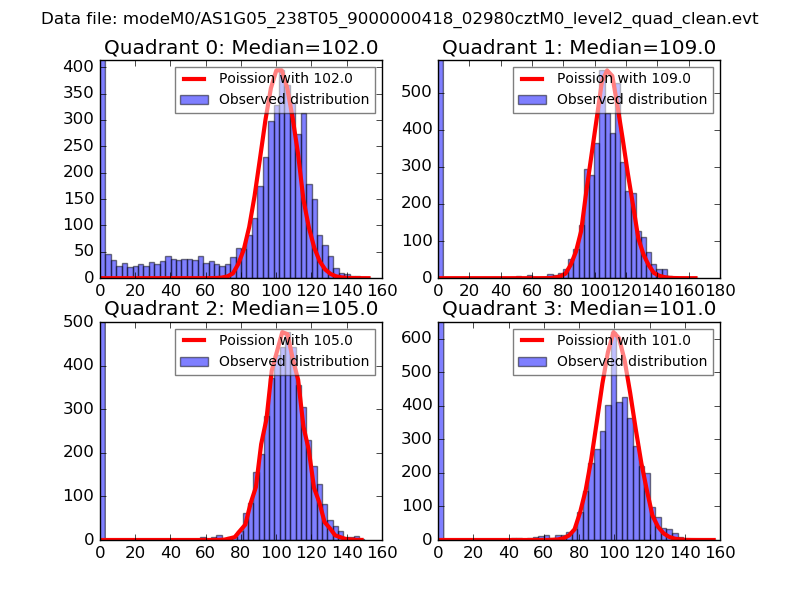
| Comparison with Poisson distribution Blue bars denote a histogram of data divided into 1 sec bins. Red curve is a Poisson curve with rate = median count rate of data. |
 |
 |
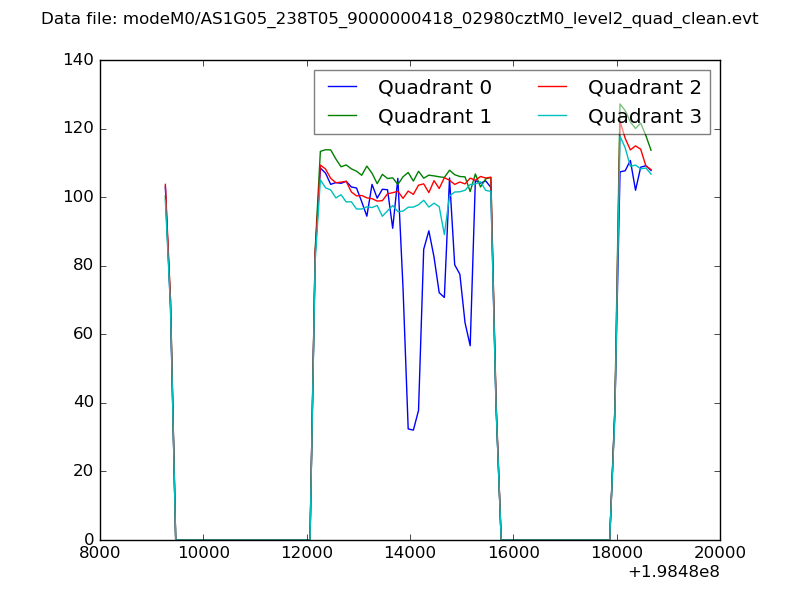
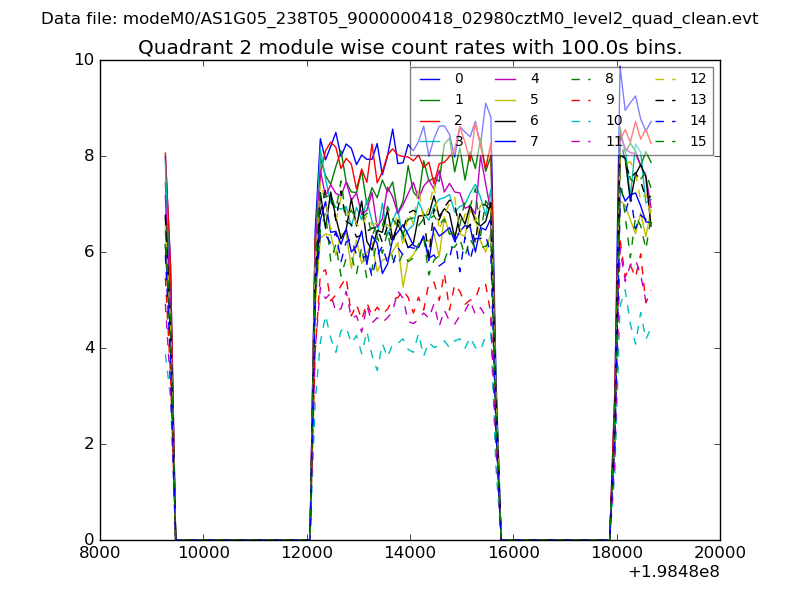
| Quadrant-wise count rates Data is divided into 100 sec bins |
 |
|
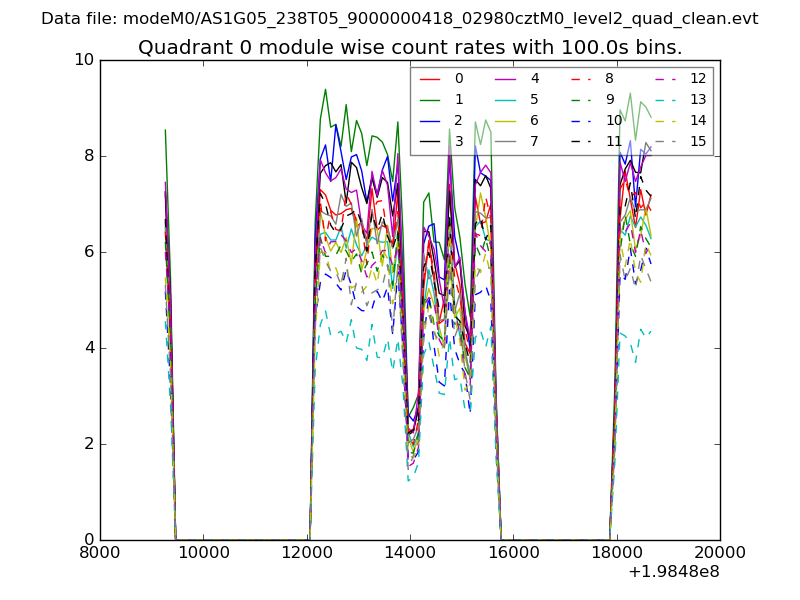
| Module-wise count rates for Quadrant A Data is divided into 100 sec bins |
 |
 |
| Module-wise count rates for Quadrant B Data is divided into 100 sec bins |
 |
 |
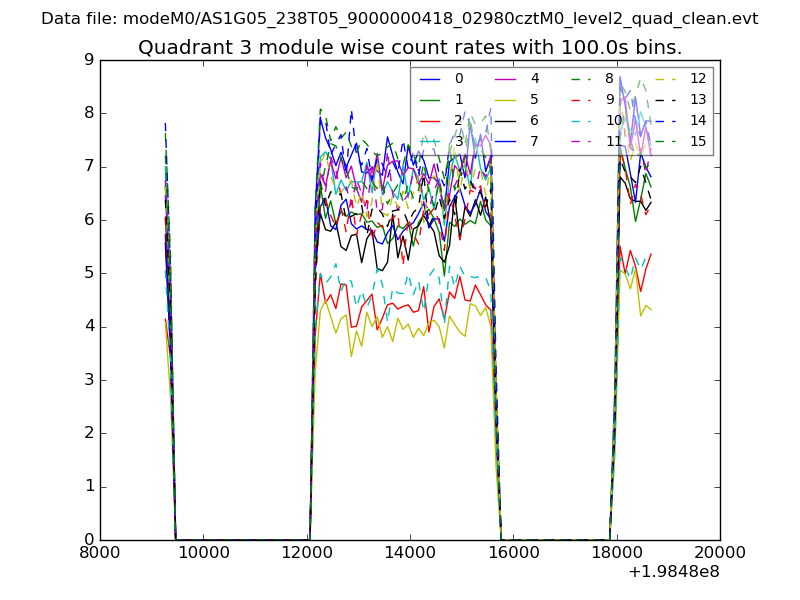
| Module-wise count rates for Quadrant C Data is divided into 100 sec bins |
 |
 |
| Module-wise count rates for Quadrant D Data is divided into 100 sec bins |
 |
 |
| Parameter | Plot |
|---|---|
| CZT HV Monitor | 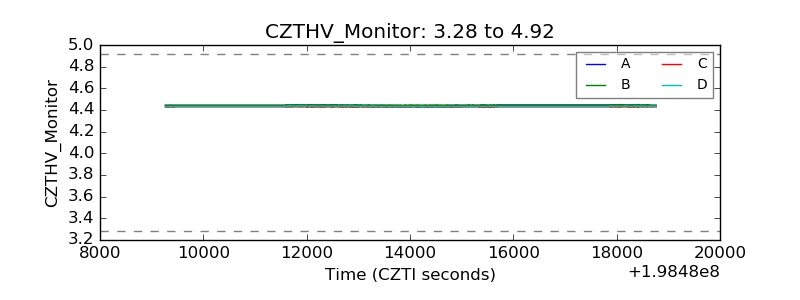 |
| D_VDD | 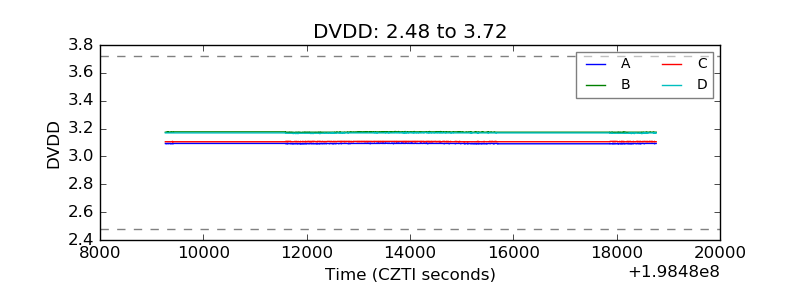 |
| Temperature 1 | 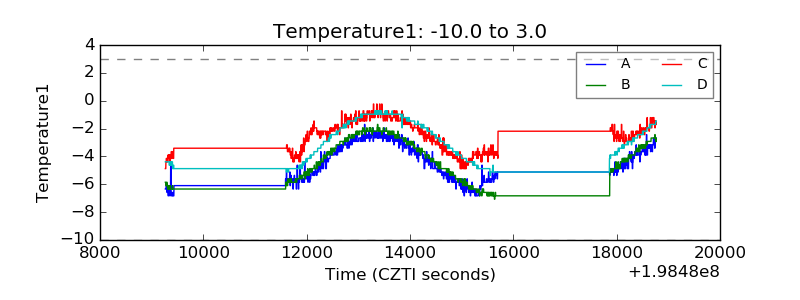 |
| Veto HV Monitor |  |
| Veto LLD | 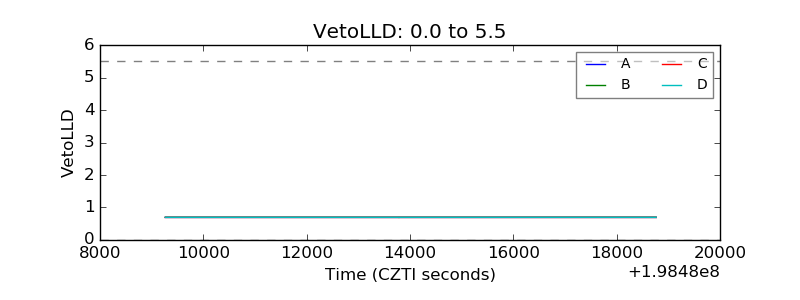 |
| Alpha Counter | 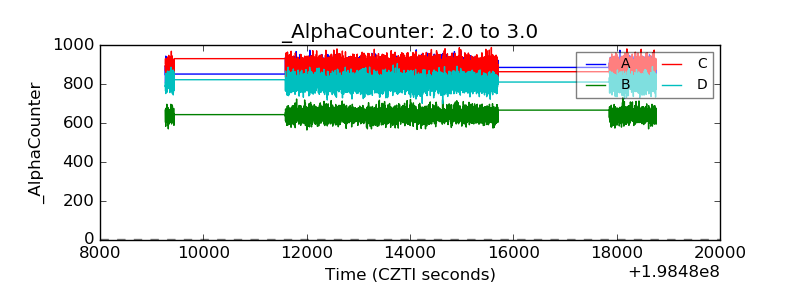 |
| _CPM_Rate | 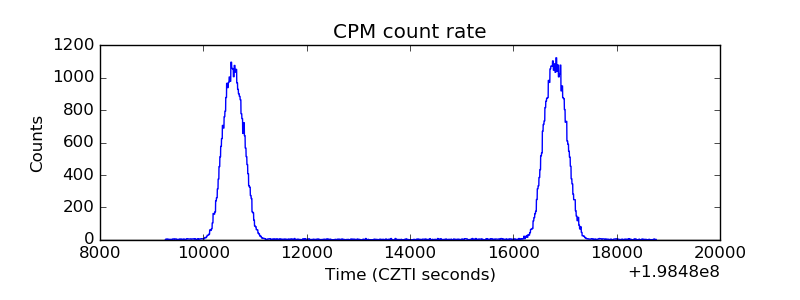 |
| CZT Counter | 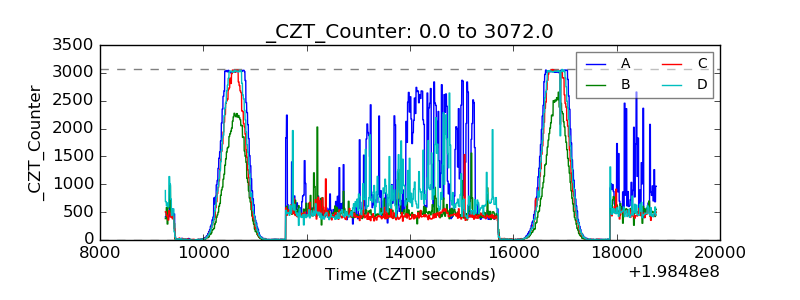 |
| +2.5 Volts monitor |  |
| +5 Volts monitor |  |
| _ROLL_ROT | 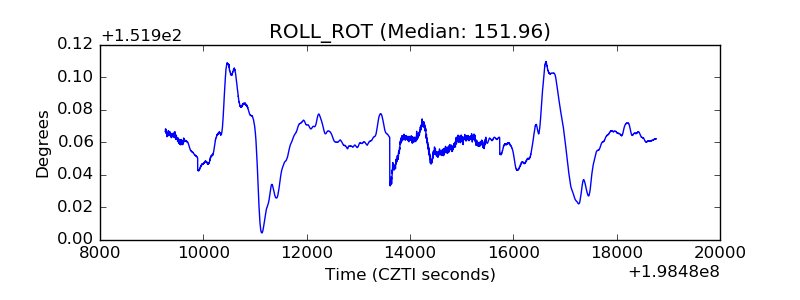 |
| _Roll_DEC | 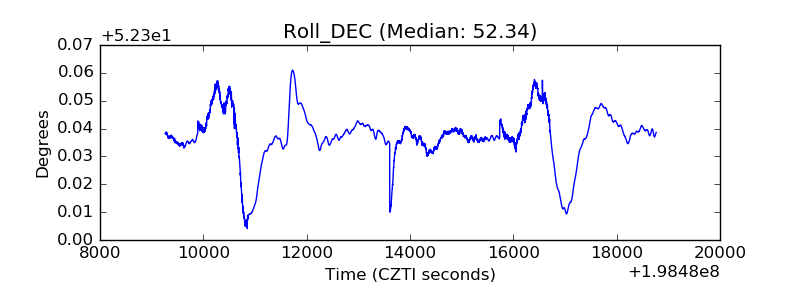 |
| _Roll_RA | 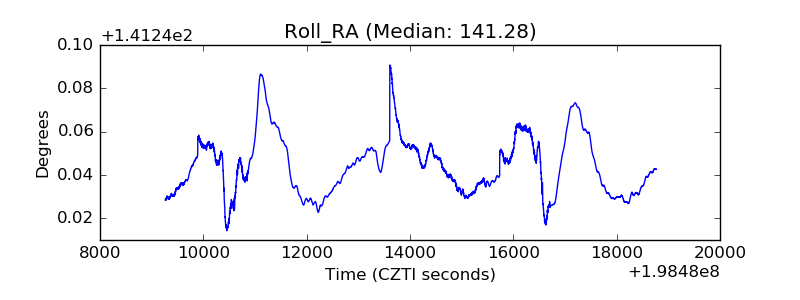 |
| Veto Counter | 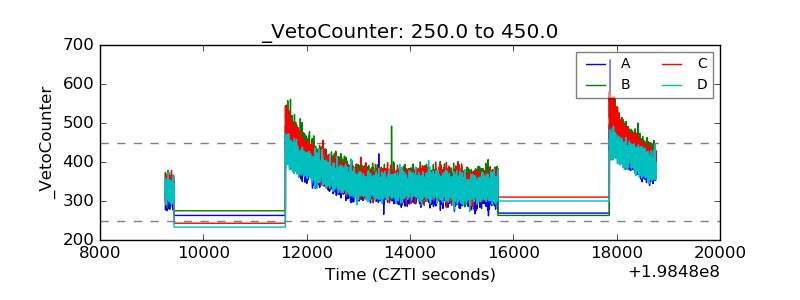 |