| Param | Original file | Final file |
|---|---|---|
| Filename | modeM0/AS1G05_238T05_9000000418_02981cztM0_level2.evt | modeM0/AS1G05_238T05_9000000418_02981cztM0_level2_quad_clean.evt |
| Size (bytes) | 441,043,200 | 84,064,320 |
| Size | 420.6 MB | 80.2 MB |
| Events in quadrant A | 4,029,439 | 540,050 |
| Events in quadrant B | 2,815,486 | 561,670 |
| Events in quadrant C | 2,387,257 | 544,565 |
| Events in quadrant D | 3,766,413 | 529,478 |
| Mode M0 | |||
|---|---|---|---|
| Quadrant | BADHDUFLAG | Total packets | Discarded packets |
| A | 0 | 15569 | 3 |
| B | 0 | 11651 | 2 |
| C | 0 | 10734 | 2 |
| D | 0 | 14688 | 2 |
| Mode M9 | |||
|---|---|---|---|
| Quadrant | BADHDUFLAG | Total packets | Discarded packets |
| A | 0 | 35 | 0 |
| B | 0 | 35 | 0 |
| C | 0 | 35 | 0 |
| D | 0 | 36 | 0 |
| Mode SS | |||
|---|---|---|---|
| Quadrant | BADHDUFLAG | Total packets | Discarded packets |
| A | 0 | 106 | 0 |
| B | 0 | 106 | 0 |
| C | 0 | 106 | 0 |
| D | 0 | 106 | 0 |
| Quadrant | Total seconds | Saturated seconds | Saturation percentage |
|---|---|---|---|
| A | 5288 | 309 | 5.843419% |
| B | 5288 | 78 | 1.475038% |
| C | 5288 | 8 | 0.151286% |
| D | 5288 | 84 | 1.588502% |
Noise dominated data is calculated using 1-second bins in cleaned event files. If a bin has >2000 counts, and if more than 50% of those come from <1% of pixels, then it is considered to be noise-dominated and hence unusable.
| Quadrant | # 1 sec bins | Bins with >0 counts | Bins with >2000 counts | High rate bins dominated by noise | Noise dominated (total time) | Noise dominated (detector-on time) | Marked lightcurve |
|---|---|---|---|---|---|---|---|
| A | 7444 | 5289 | 224 | 224 | 3.01% | 4.24% | 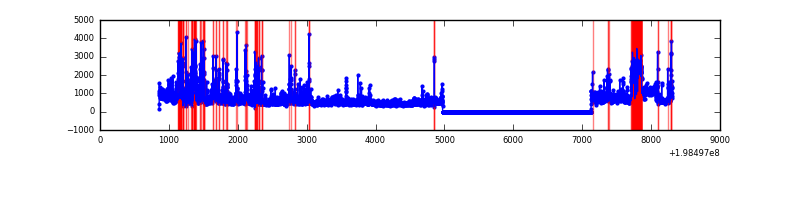 |
| B | 7444 | 5289 | 64 | 64 | 0.86% | 1.21% | 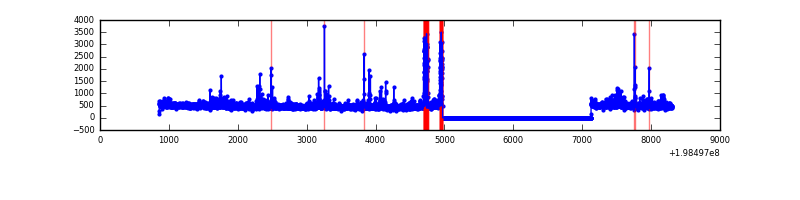 |
| C | 7444 | 5289 | 3 | 3 | 0.04% | 0.06% | 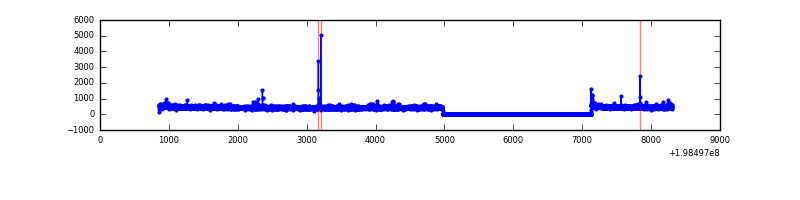 |
| D | 7444 | 5289 | 84 | 84 | 1.13% | 1.59% | 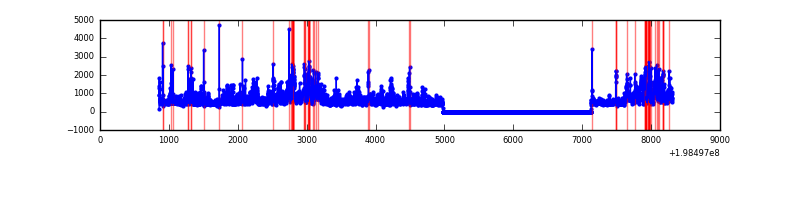 |
Top three noisy pixels from each quadrant. If the there are fewer than three noisy pixels in the level2.evt file, extra rows are filled as -1
| Pixel properties | Quadrant properties | ||||||
|---|---|---|---|---|---|---|---|
| Quadrant | DetID | PixID | Counts | Sigma | Mean | Median | Sigma |
| A | 13 | 9 | 1424340 | 11887.42 | 597 | 585 | 119.8 |
| A | 14 | 63 | 106310 | 882.73 | 597 | 585 | 119.8 |
| A | 14 | 238 | 57391 | 474.29 | 597 | 585 | 119.8 |
| B | 3 | 11 | 176845 | 1488.62 | 614 | 602 | 118.4 |
| B | 0 | 219 | 94776 | 795.43 | 614 | 602 | 118.4 |
| B | 6 | 203 | 71996 | 603.02 | 614 | 602 | 118.4 |
| C | 6 | 80 | 29985 | 214.88 | 587 | 592 | 136.8 |
| C | 15 | 208 | 21528 | 153.05 | 587 | 592 | 136.8 |
| C | 12 | 4 | 7318 | 49.17 | 587 | 592 | 136.8 |
| D | 13 | 114 | 1120273 | 8056.58 | 589 | 576 | 139.0 |
| D | 2 | 136 | 175490 | 1258.56 | 589 | 576 | 139.0 |
| D | 1 | 31 | 95316 | 681.68 | 589 | 576 | 139.0 |
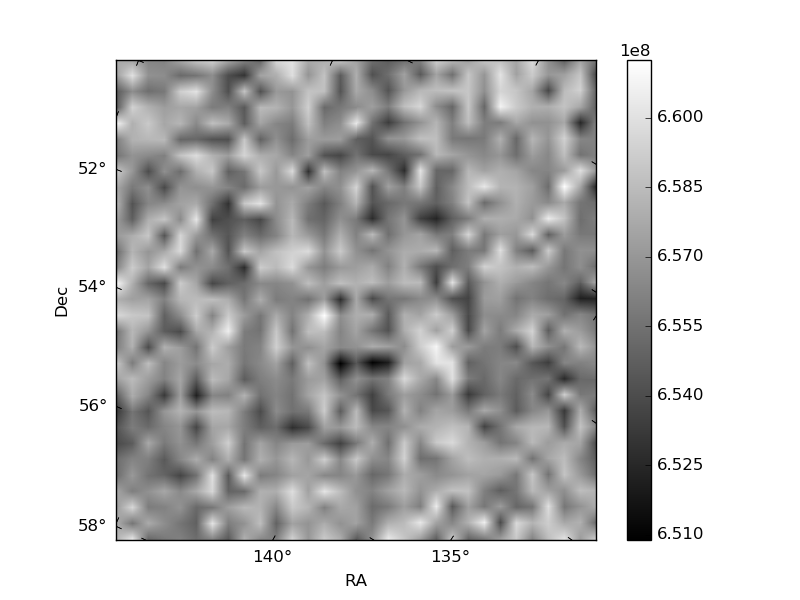
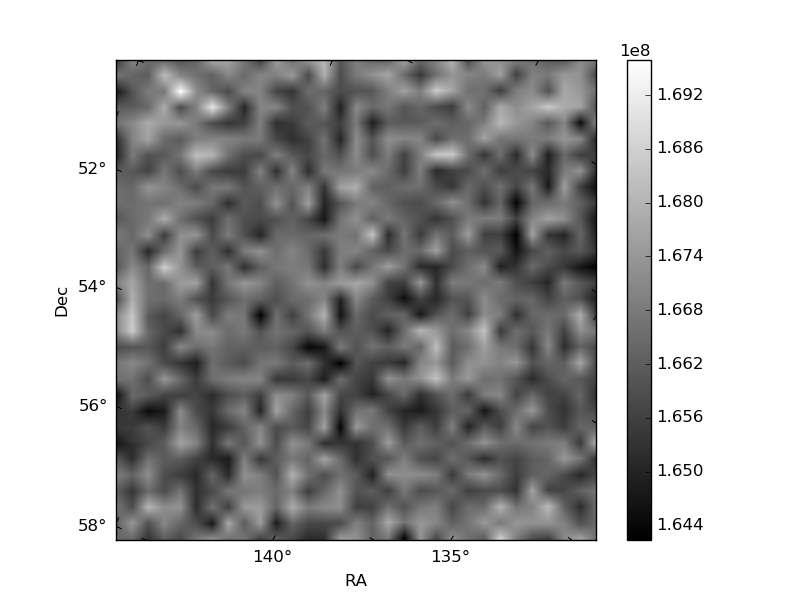
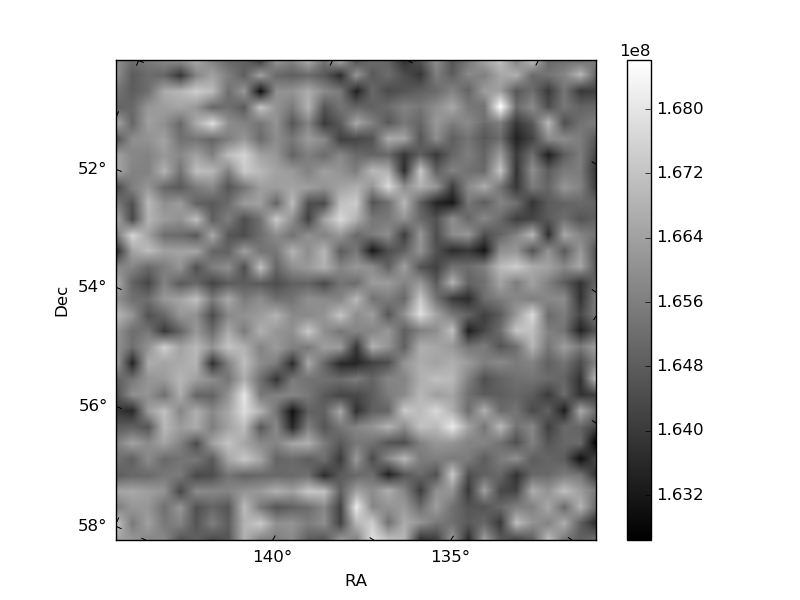
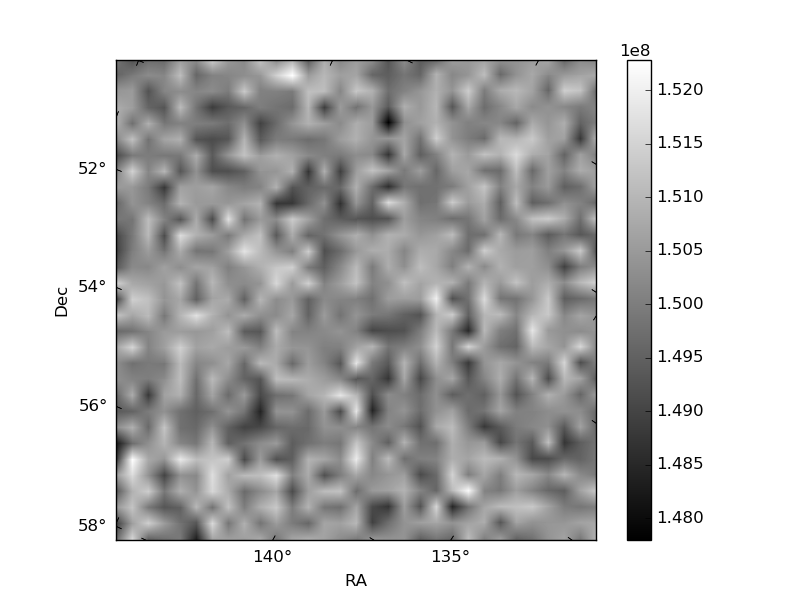
Histogram calculated using DETX and DETY for each event in the final _common_clean file
| Quadrant A | 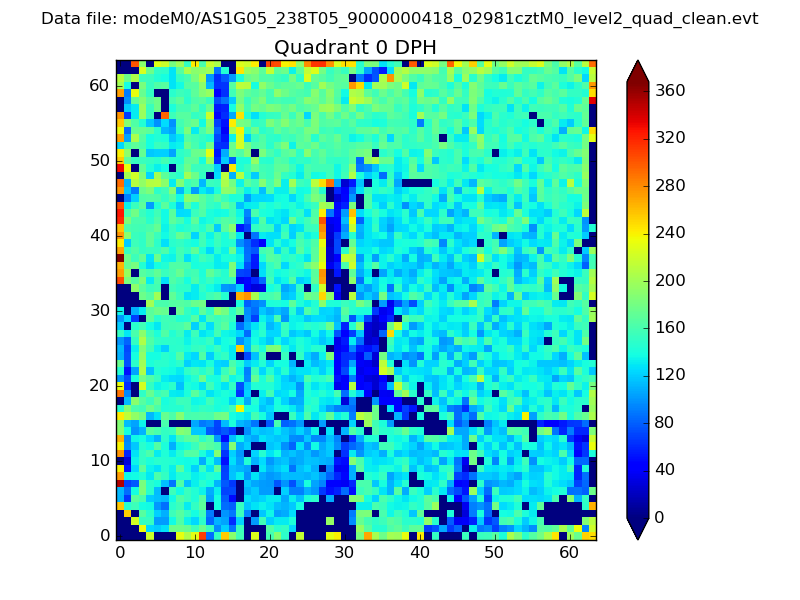 |
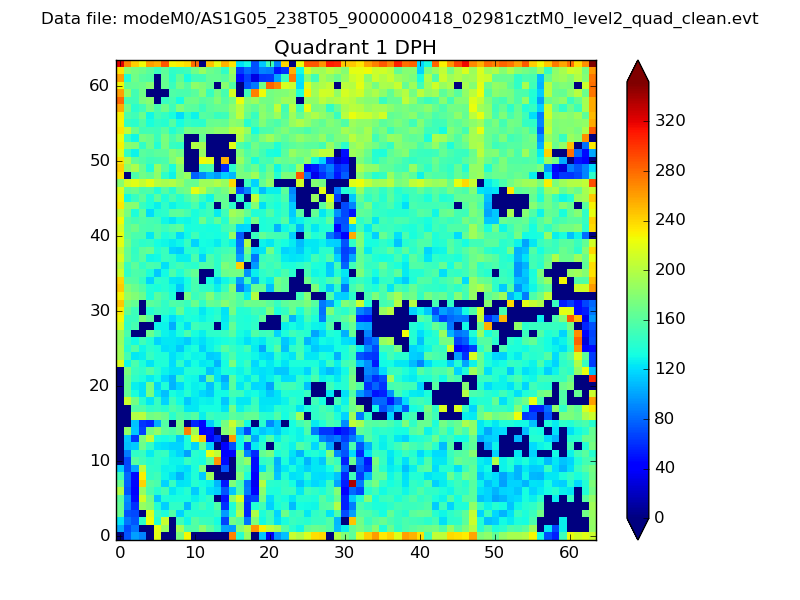 |
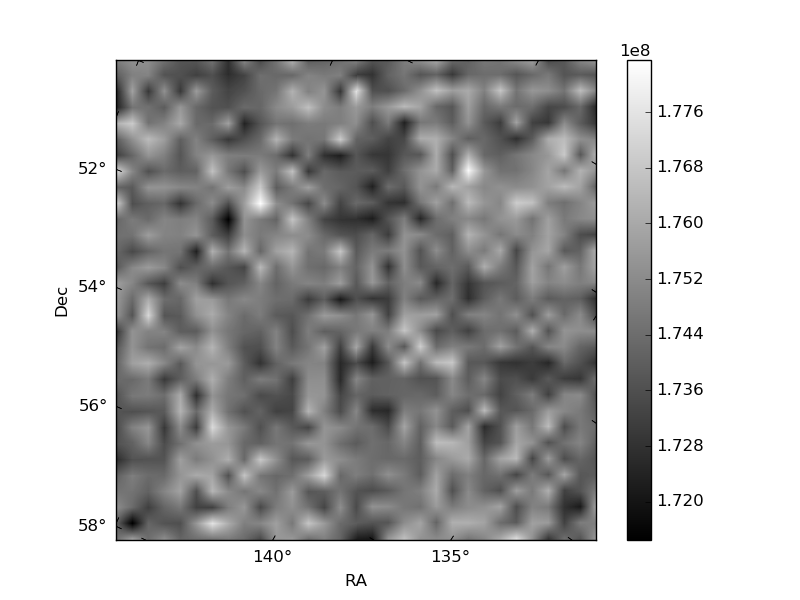
Quadrant B |
|---|---|---|---|
| Quadrant D | 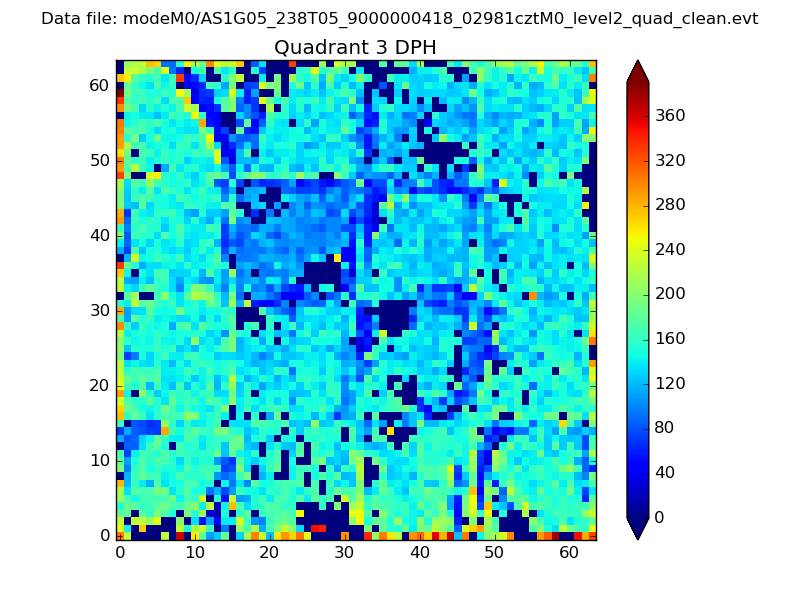 |
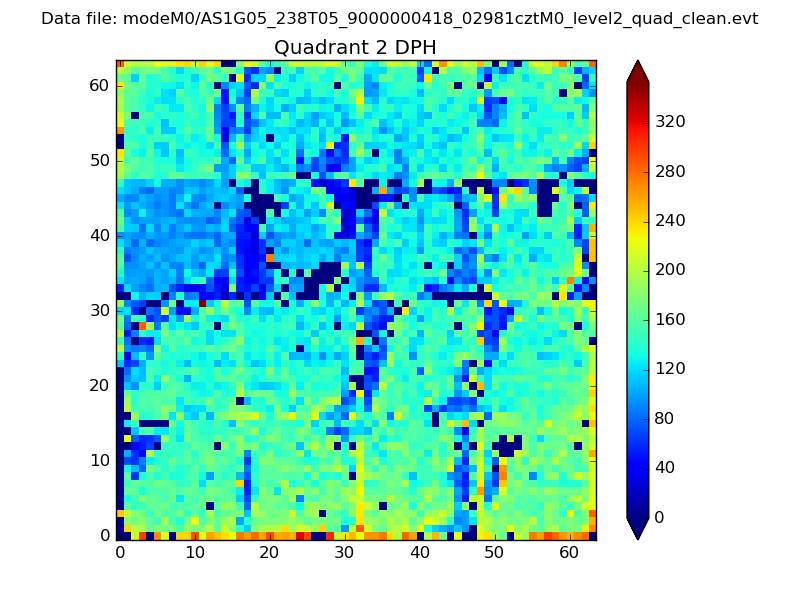 |
Quadrant C |
| Plot type | Count rate plots | Images |
|---|---|---|
| Comparison with Poisson distribution Blue bars denote a histogram of data divided into 1 sec bins. Red curve is a Poisson curve with rate = median count rate of data. |
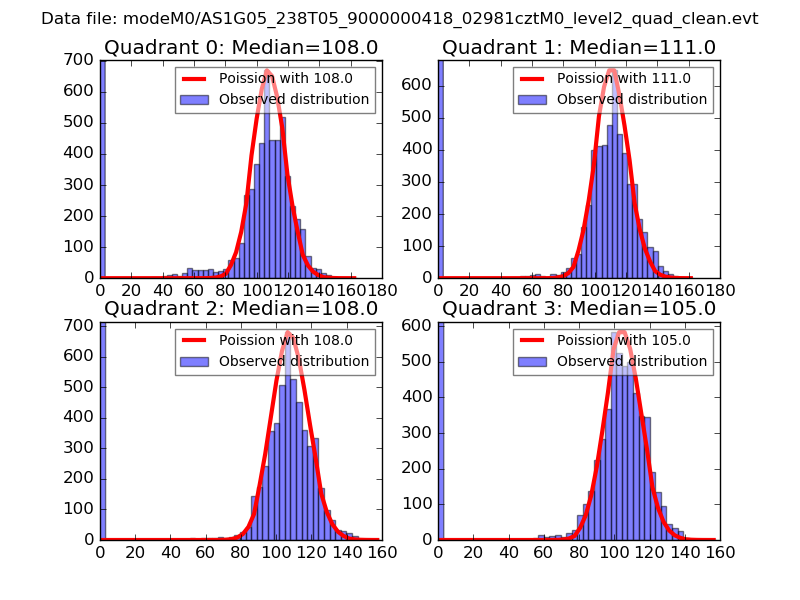 |
 |
| Quadrant-wise count rates Data is divided into 100 sec bins |
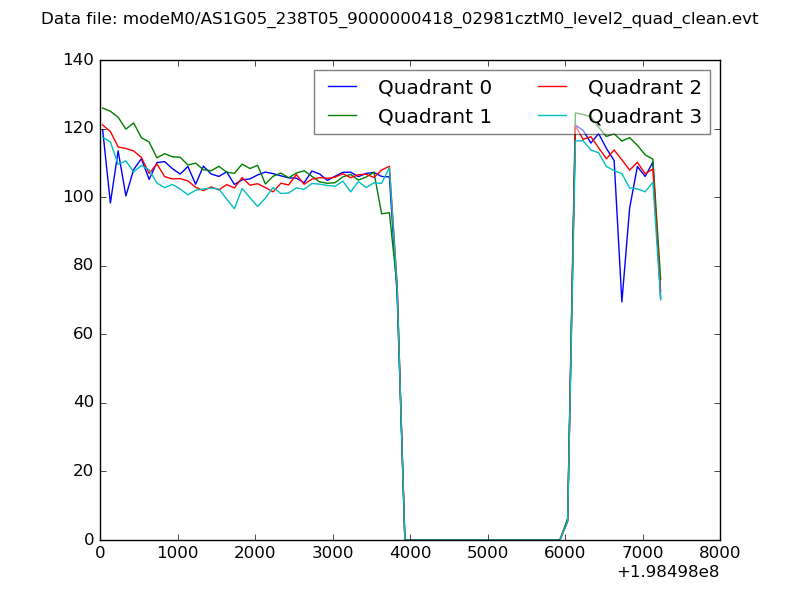 |
|
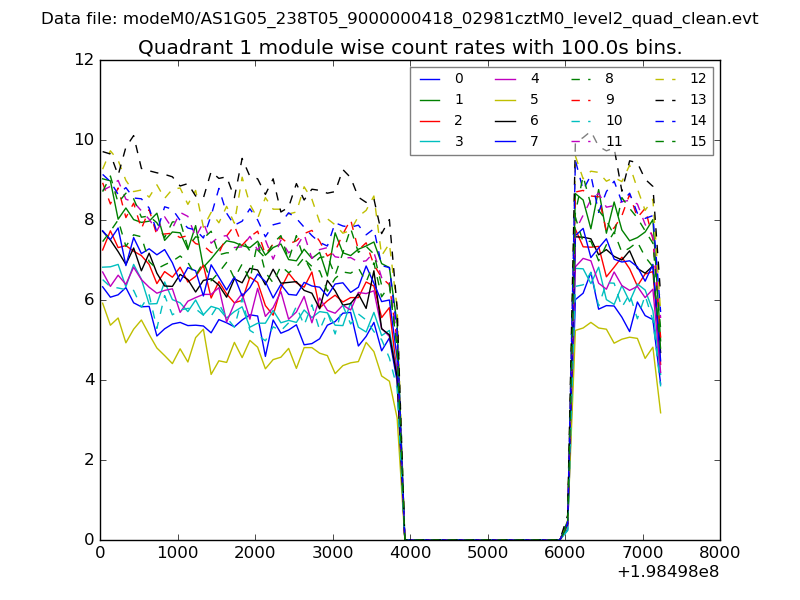
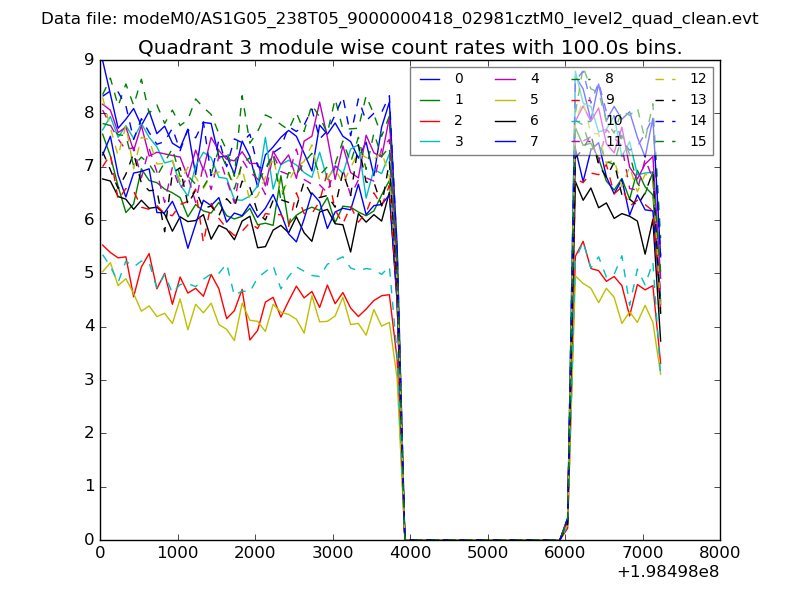
| Module-wise count rates for Quadrant A Data is divided into 100 sec bins |
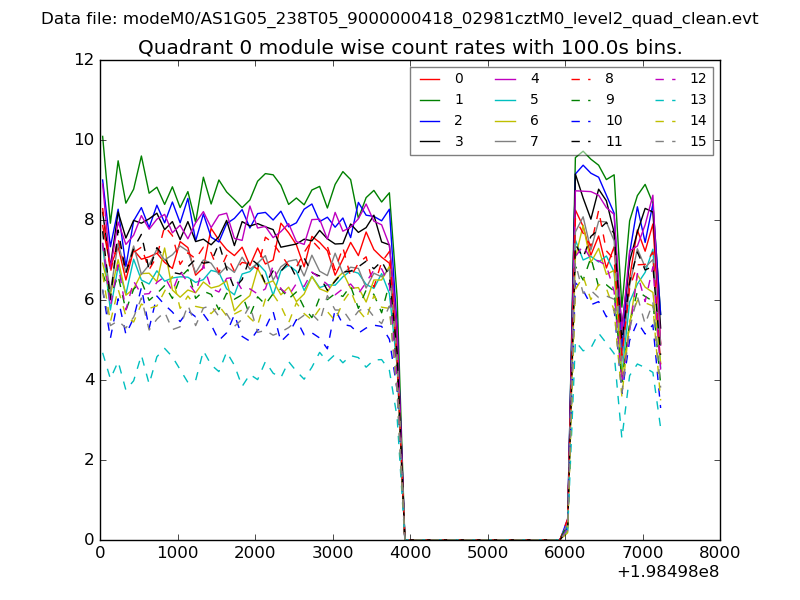 |
 |
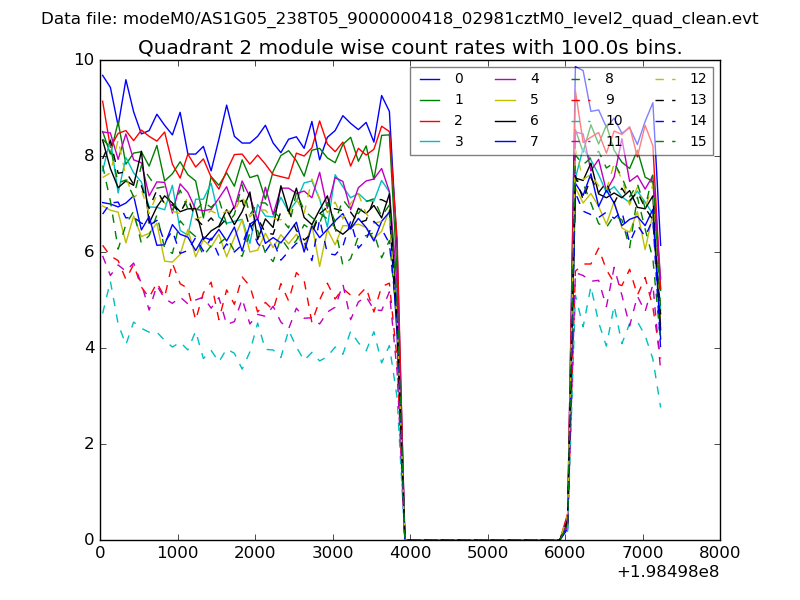
| Module-wise count rates for Quadrant B Data is divided into 100 sec bins |
 |
 |
| Module-wise count rates for Quadrant C Data is divided into 100 sec bins |
 |
 |
| Module-wise count rates for Quadrant D Data is divided into 100 sec bins |
 |
 |
| Parameter | Plot |
|---|---|
| CZT HV Monitor | 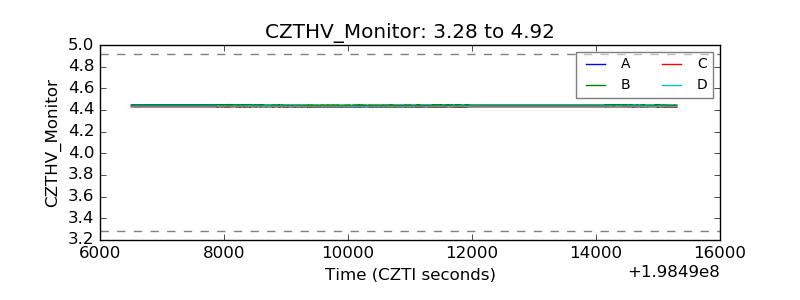 |
| D_VDD | 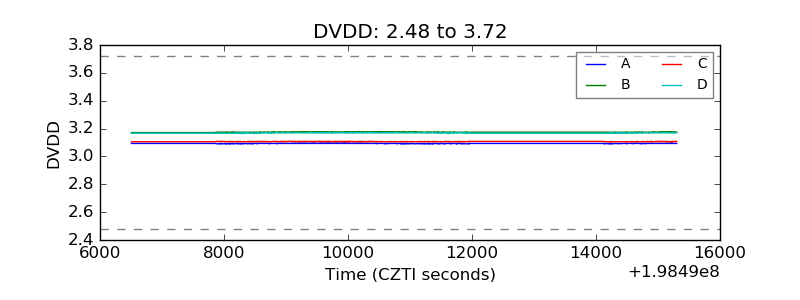 |
| Temperature 1 | 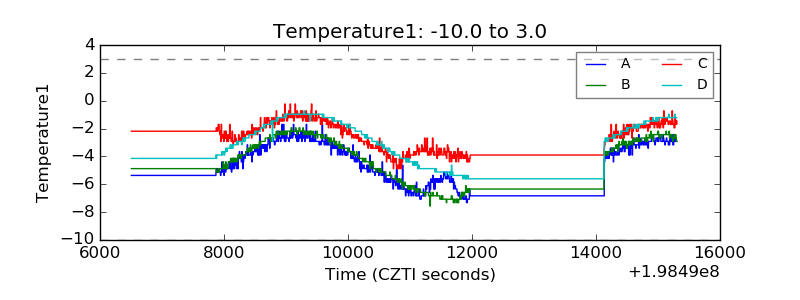 |
| Veto HV Monitor | 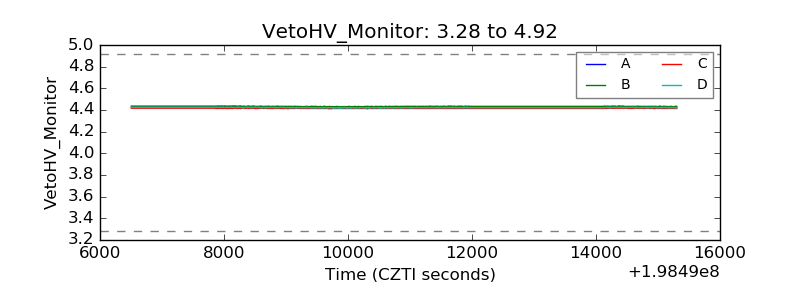 |
| Veto LLD | 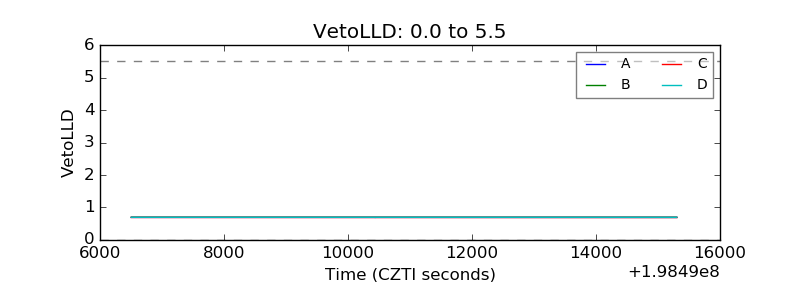 |
| Alpha Counter | 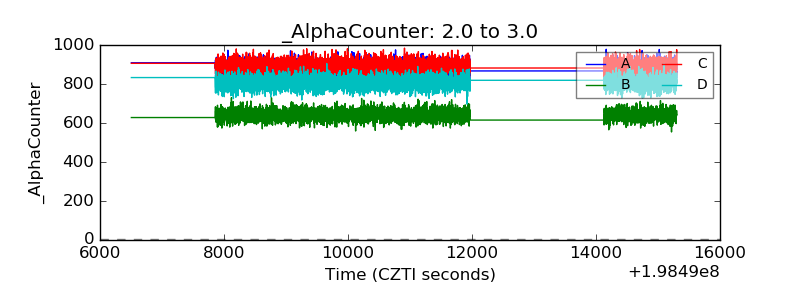 |
| _CPM_Rate | 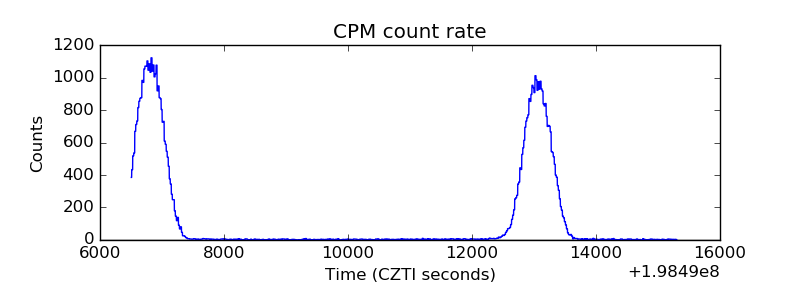 |
| CZT Counter | 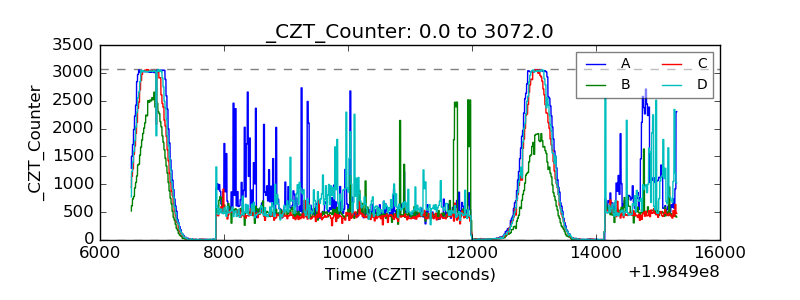 |
| +2.5 Volts monitor |  |
| +5 Volts monitor |  |
| _ROLL_ROT | 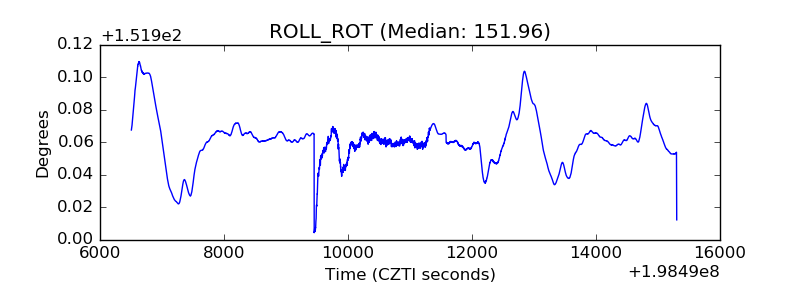 |
| _Roll_DEC | 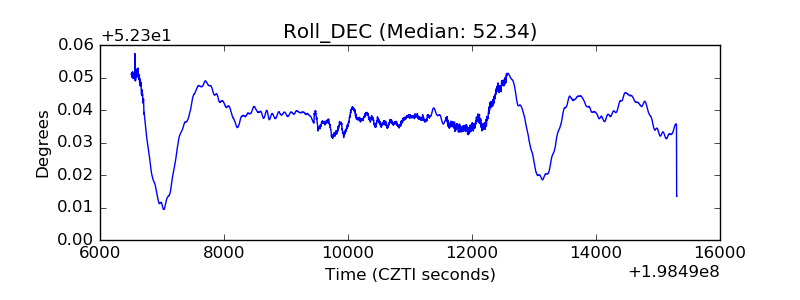 |
| _Roll_RA | 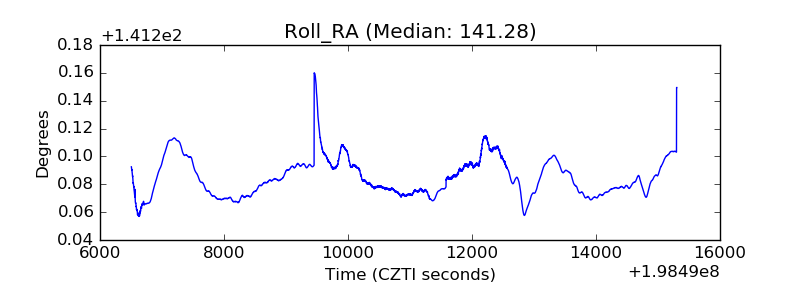 |
| Veto Counter | 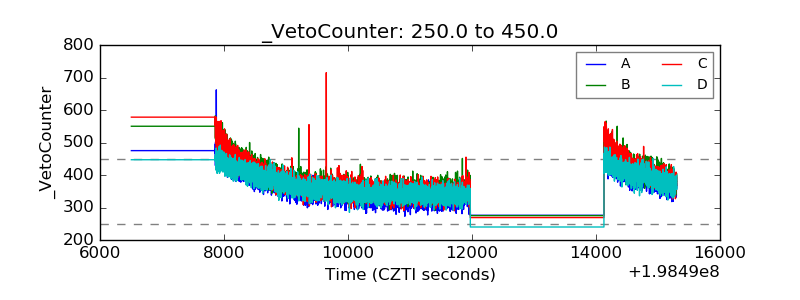 |