| Param | Original file | Final file |
|---|---|---|
| Filename | modeM0/AS1G05_238T05_9000000418_02982cztM0_level2.evt | modeM0/AS1G05_238T05_9000000418_02982cztM0_level2_quad_clean.evt |
| Size (bytes) | 473,230,080 | 78,226,560 |
| Size | 451.3 MB | 74.6 MB |
| Events in quadrant A | 3,959,671 | 500,382 |
| Events in quadrant B | 2,868,887 | 518,419 |
| Events in quadrant C | 2,630,866 | 501,066 |
| Events in quadrant D | 4,517,111 | 481,798 |
| Mode M0 | |||
|---|---|---|---|
| Quadrant | BADHDUFLAG | Total packets | Discarded packets |
| A | 0 | 15320 | 3 |
| B | 0 | 11962 | 2 |
| C | 0 | 11405 | 2 |
| D | 0 | 17029 | 2 |
| Mode M9 | |||
|---|---|---|---|
| Quadrant | BADHDUFLAG | Total packets | Discarded packets |
| A | 0 | 21 | 0 |
| B | 0 | 21 | 0 |
| C | 0 | 21 | 0 |
| D | 0 | 22 | 0 |
| Mode SS | |||
|---|---|---|---|
| Quadrant | BADHDUFLAG | Total packets | Discarded packets |
| A | 0 | 108 | 0 |
| B | 0 | 108 | 0 |
| C | 0 | 108 | 0 |
| D | 0 | 108 | 0 |
| Quadrant | Total seconds | Saturated seconds | Saturation percentage |
|---|---|---|---|
| A | 5235 | 258 | 4.928367% |
| B | 5235 | 117 | 2.234957% |
| C | 5235 | 95 | 1.814709% |
| D | 5235 | 241 | 4.603629% |
Noise dominated data is calculated using 1-second bins in cleaned event files. If a bin has >2000 counts, and if more than 50% of those come from <1% of pixels, then it is considered to be noise-dominated and hence unusable.
| Quadrant | # 1 sec bins | Bins with >0 counts | Bins with >2000 counts | High rate bins dominated by noise | Noise dominated (total time) | Noise dominated (detector-on time) | Marked lightcurve |
|---|---|---|---|---|---|---|---|
| A | 7390 | 5236 | 175 | 175 | 2.37% | 3.34% | 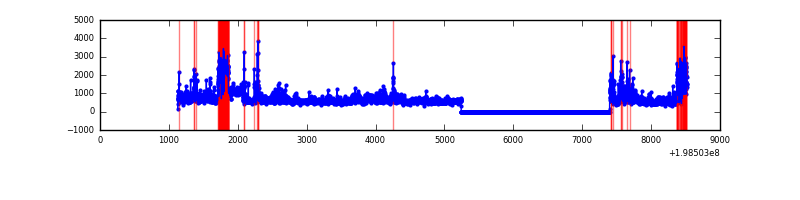 |
| B | 7390 | 5236 | 108 | 108 | 1.46% | 2.06% | 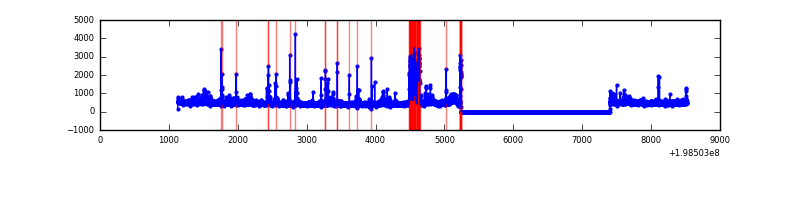 |
| C | 7390 | 5236 | 77 | 77 | 1.04% | 1.47% | 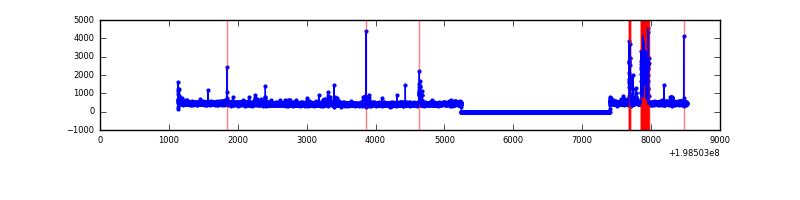 |
| D | 7390 | 5236 | 253 | 253 | 3.42% | 4.83% | 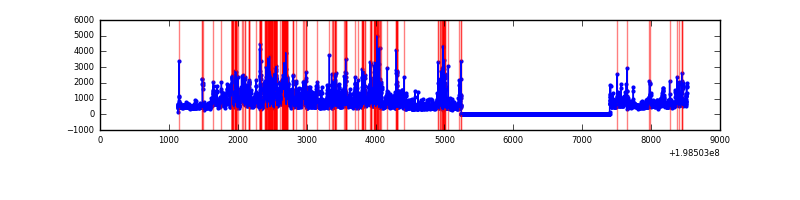 |
Top three noisy pixels from each quadrant. If the there are fewer than three noisy pixels in the level2.evt file, extra rows are filled as -1
| Pixel properties | Quadrant properties | ||||||
|---|---|---|---|---|---|---|---|
| Quadrant | DetID | PixID | Counts | Sigma | Mean | Median | Sigma |
| A | 13 | 9 | 1215548 | 10420.65 | 579 | 568 | 116.6 |
| A | 14 | 63 | 434249 | 3719.6 | 579 | 568 | 116.6 |
| A | 0 | 31 | 25609 | 214.77 | 579 | 568 | 116.6 |
| B | 3 | 11 | 295304 | 2618.37 | 593 | 580 | 112.6 |
| B | 0 | 219 | 53056 | 466.2 | 593 | 580 | 112.6 |
| B | 3 | 27 | 41939 | 367.44 | 593 | 580 | 112.6 |
| C | 1 | 192 | 281206 | 2136.44 | 569 | 572 | 131.4 |
| C | 6 | 80 | 68300 | 515.61 | 569 | 572 | 131.4 |
| C | 10 | 21 | 11282 | 81.53 | 569 | 572 | 131.4 |
| D | 13 | 114 | 1457967 | 10697.14 | 568 | 554 | 136.2 |
| D | 1 | 31 | 622772 | 4566.96 | 568 | 554 | 136.2 |
| D | 13 | 239 | 97553 | 711.95 | 568 | 554 | 136.2 |
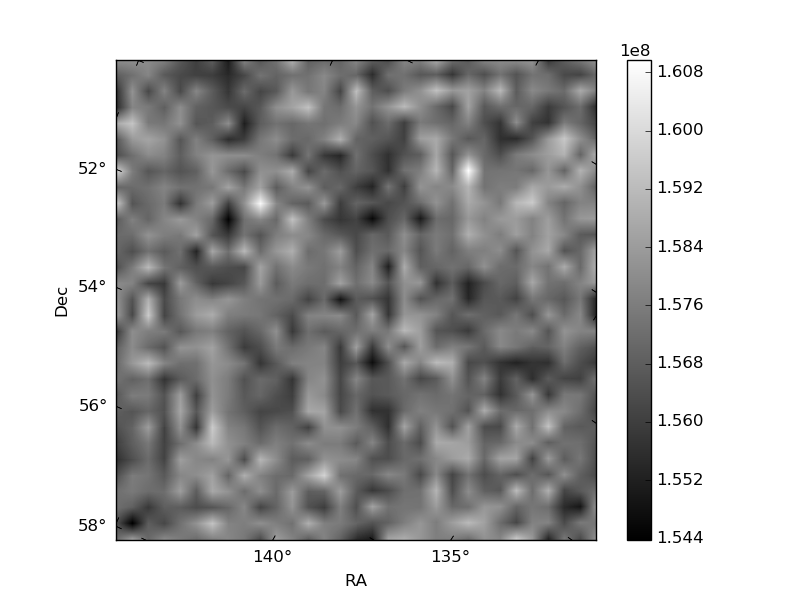
Histogram calculated using DETX and DETY for each event in the final _common_clean file
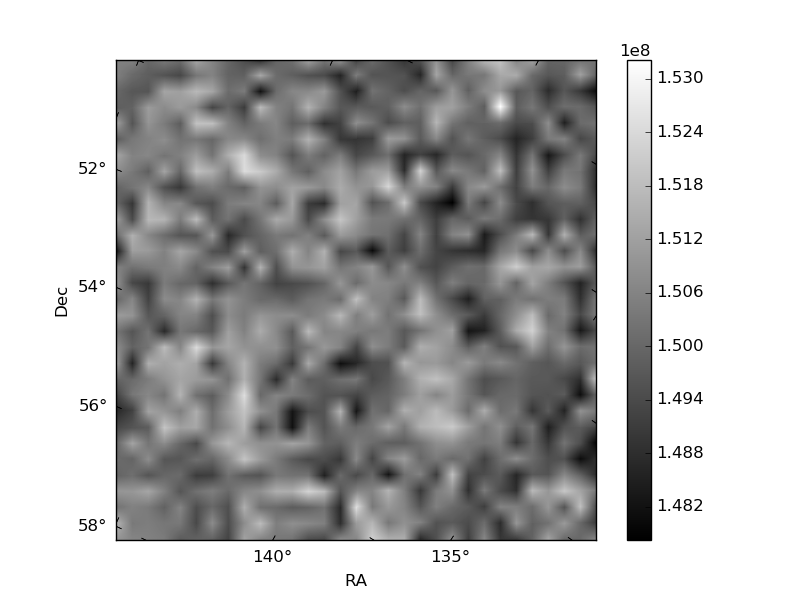
| Quadrant A | 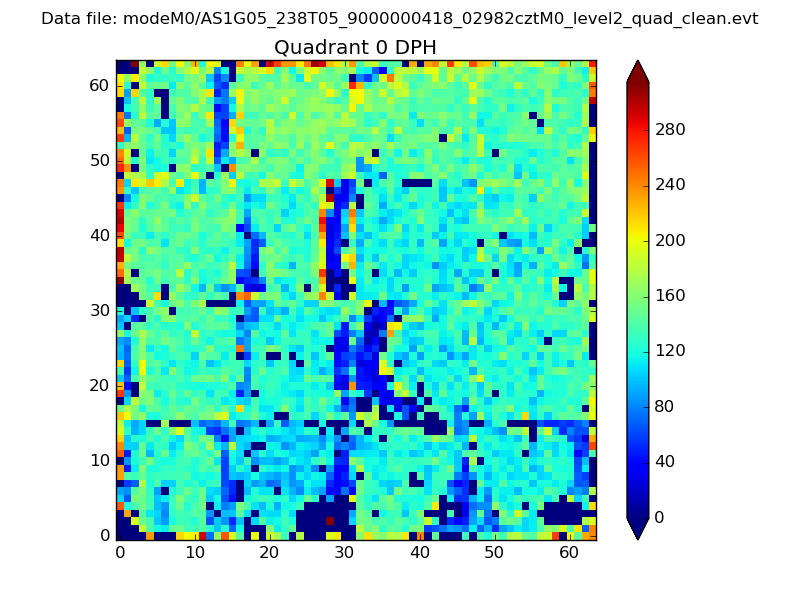 |
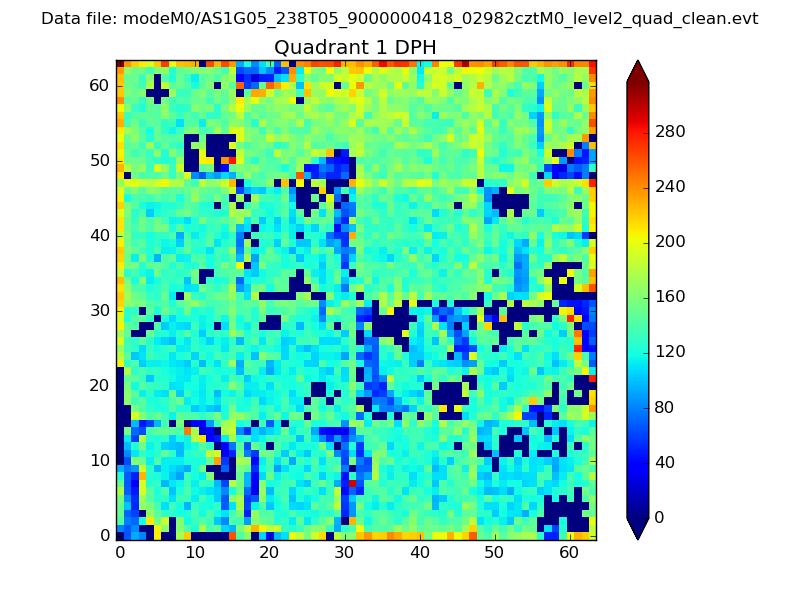 |
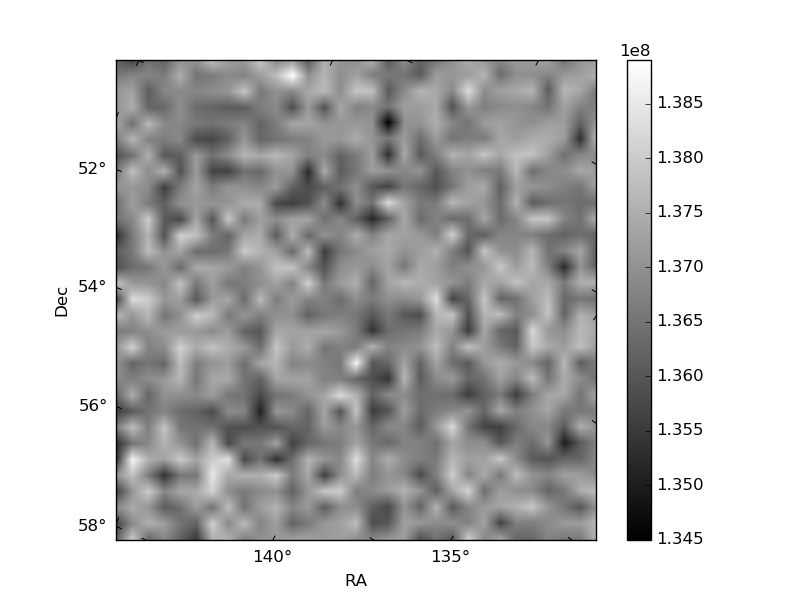
Quadrant B |
|---|---|---|---|
| Quadrant D | 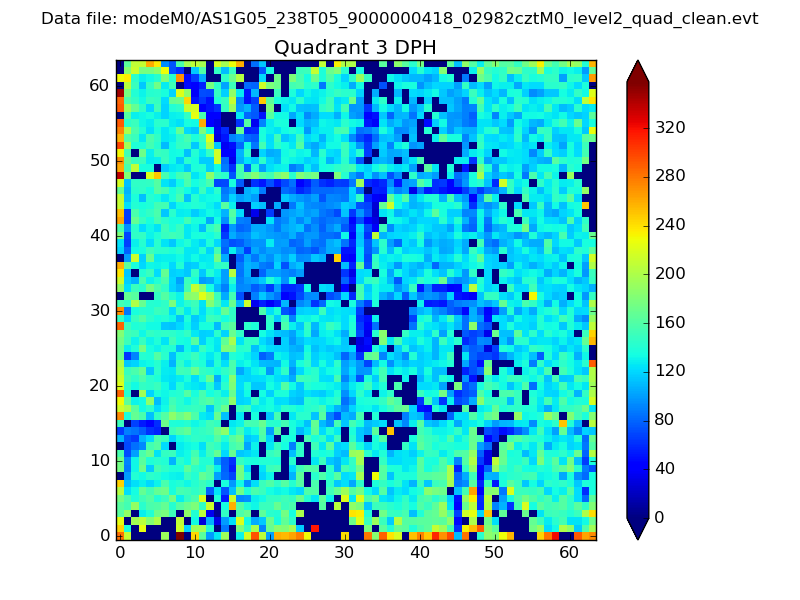 |
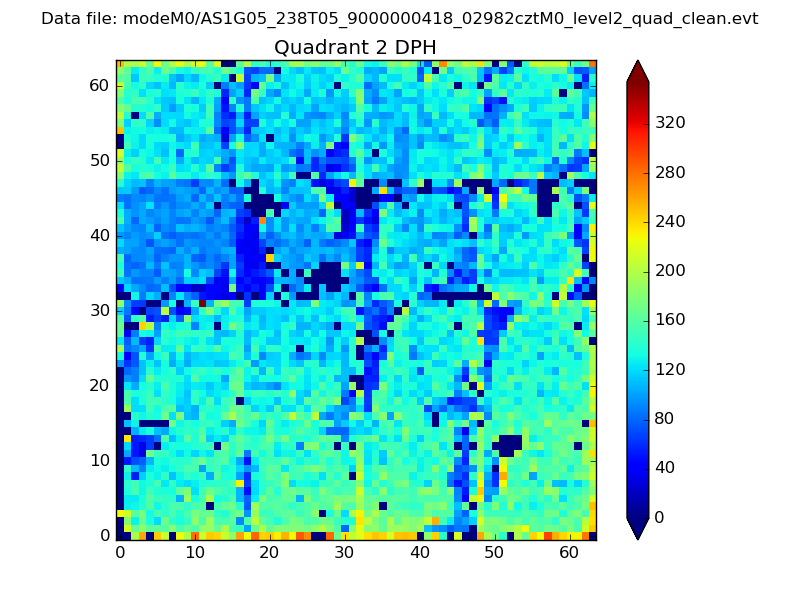 |
Quadrant C |
| Plot type | Count rate plots | Images |
|---|---|---|
| Comparison with Poisson distribution Blue bars denote a histogram of data divided into 1 sec bins. Red curve is a Poisson curve with rate = median count rate of data. |
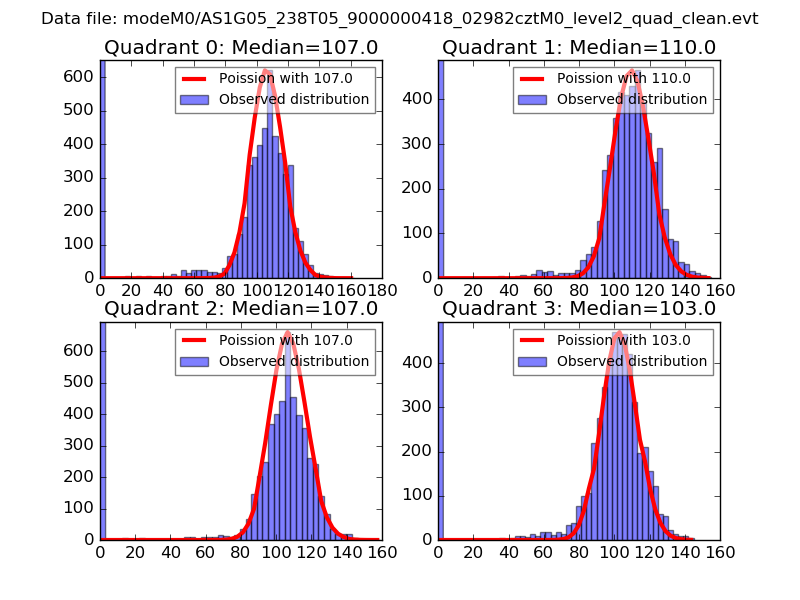 |
 |
| Quadrant-wise count rates Data is divided into 100 sec bins |
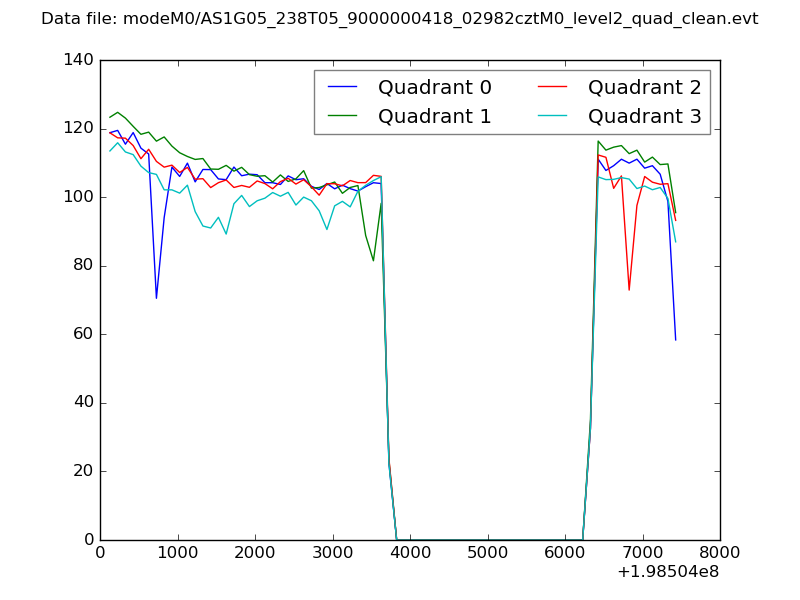 |
|
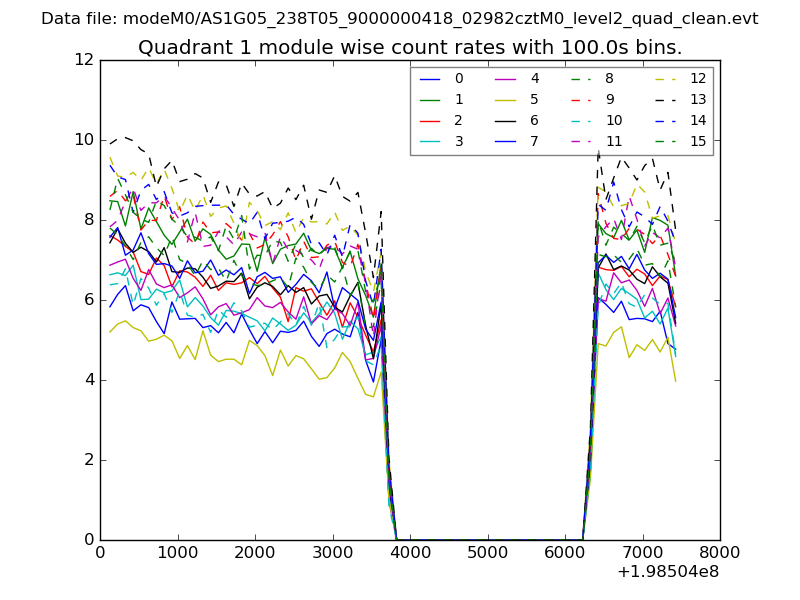
| Module-wise count rates for Quadrant A Data is divided into 100 sec bins |
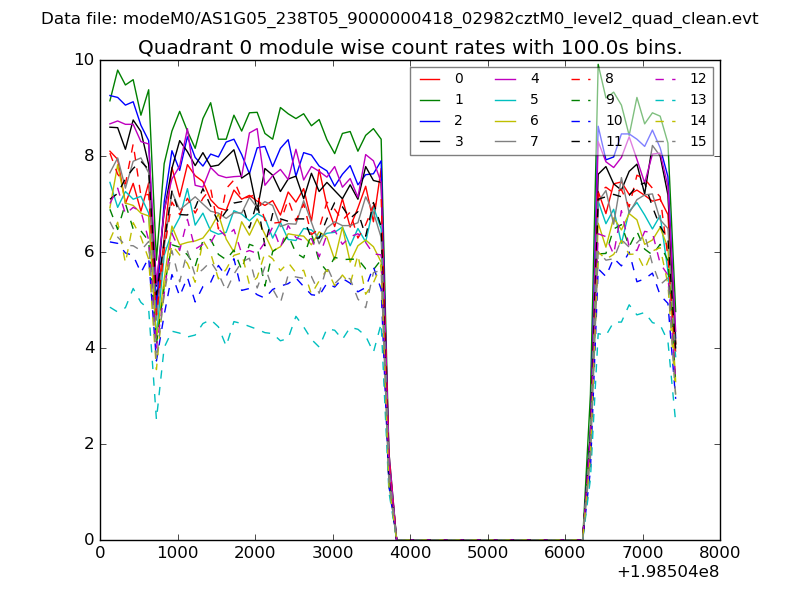 |
 |
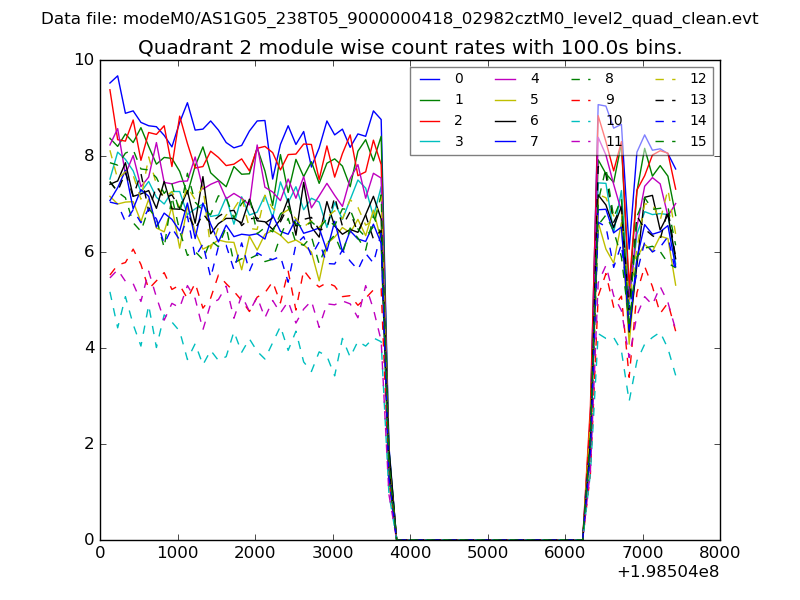
| Module-wise count rates for Quadrant B Data is divided into 100 sec bins |
 |
 |
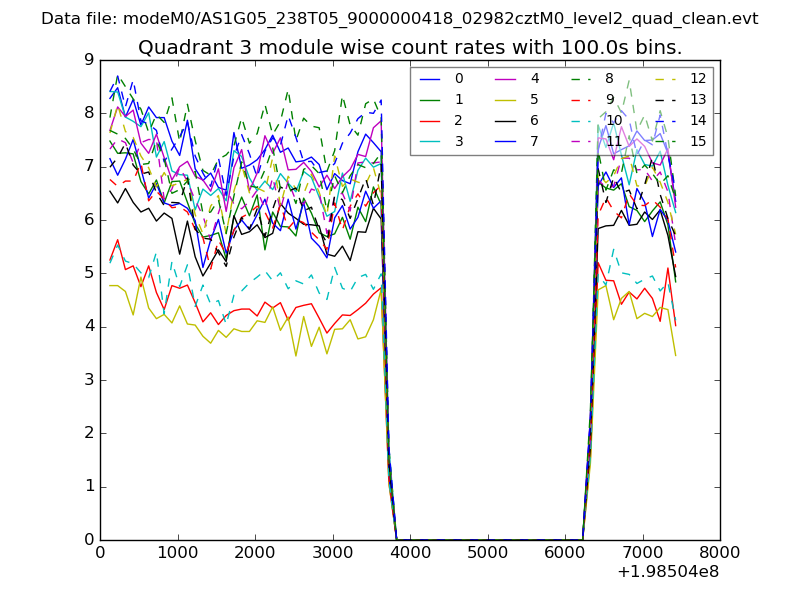
| Module-wise count rates for Quadrant C Data is divided into 100 sec bins |
 |
 |
| Module-wise count rates for Quadrant D Data is divided into 100 sec bins |
 |
 |
| Parameter | Plot |
|---|---|
| CZT HV Monitor | 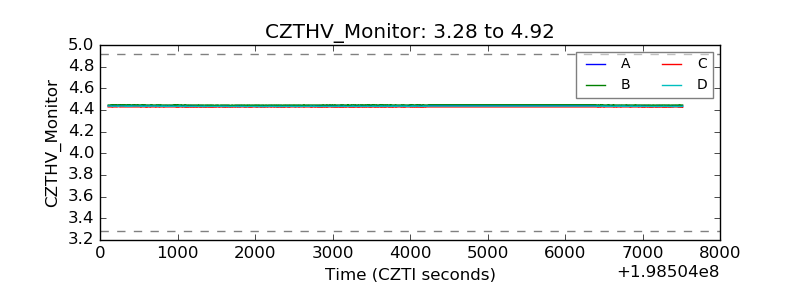 |
| D_VDD |  |
| Temperature 1 | 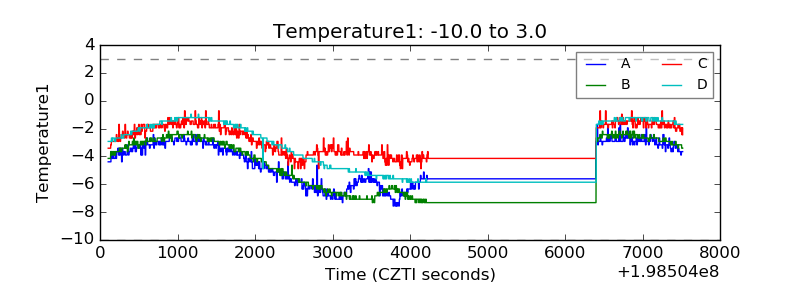 |
| Veto HV Monitor | 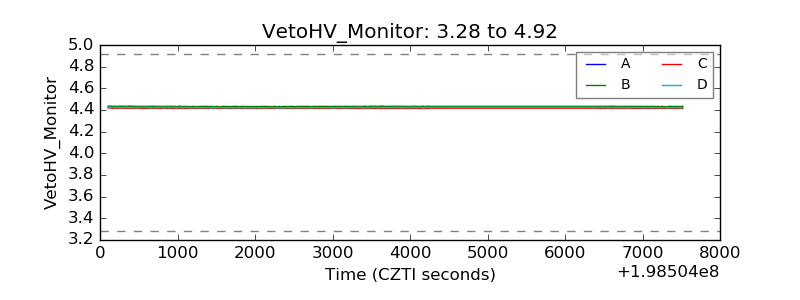 |
| Veto LLD | 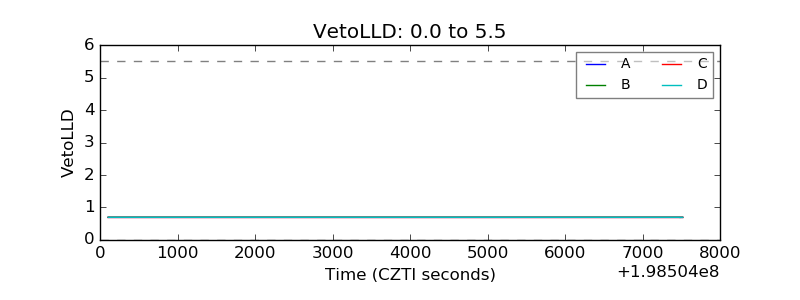 |
| Alpha Counter | 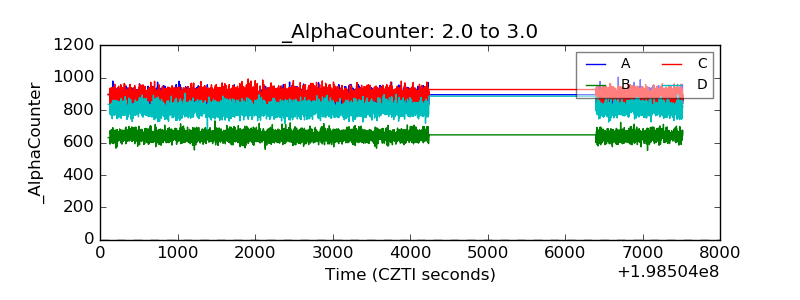 |
| _CPM_Rate | 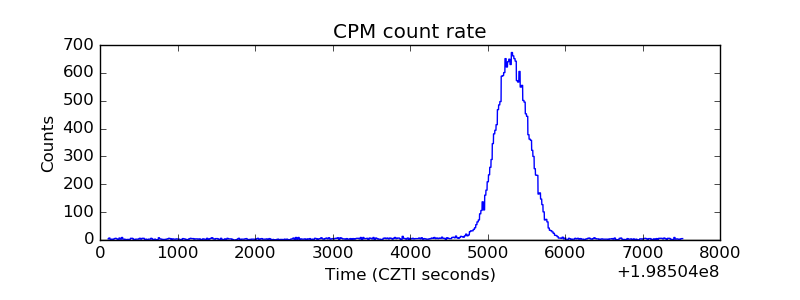 |
| CZT Counter | 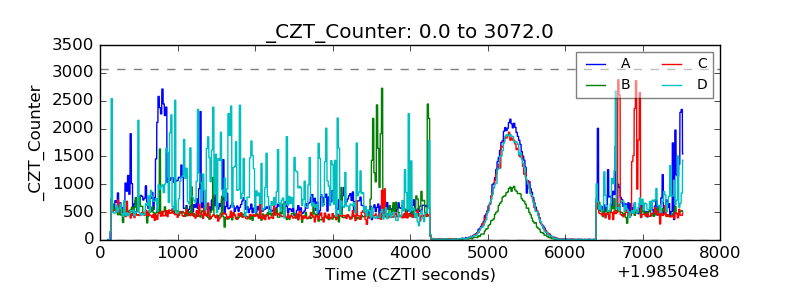 |
| +2.5 Volts monitor |  |
| +5 Volts monitor | 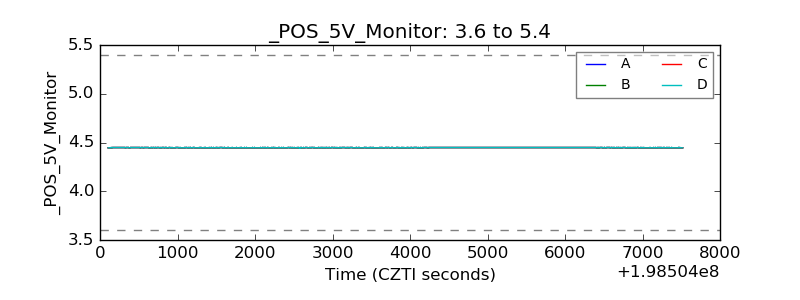 |
| _ROLL_ROT | 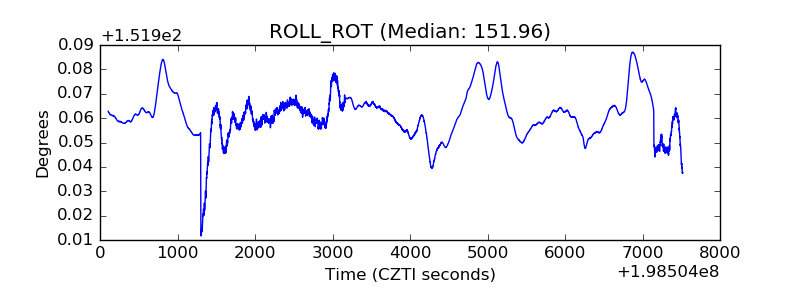 |
| _Roll_DEC | 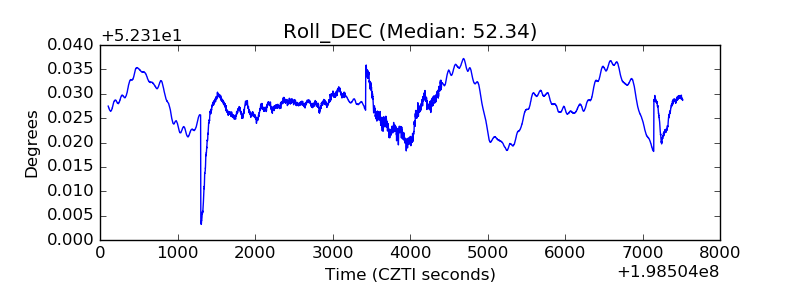 |
| _Roll_RA | 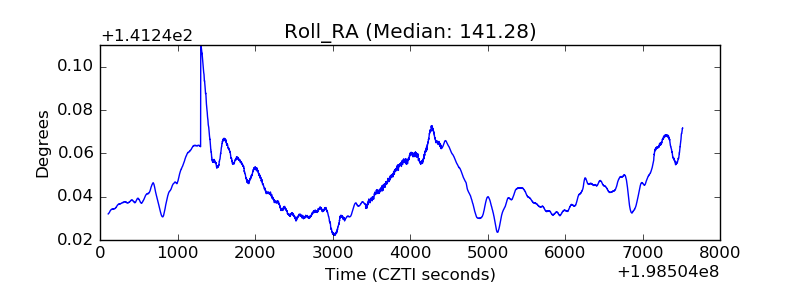 |
| Veto Counter | 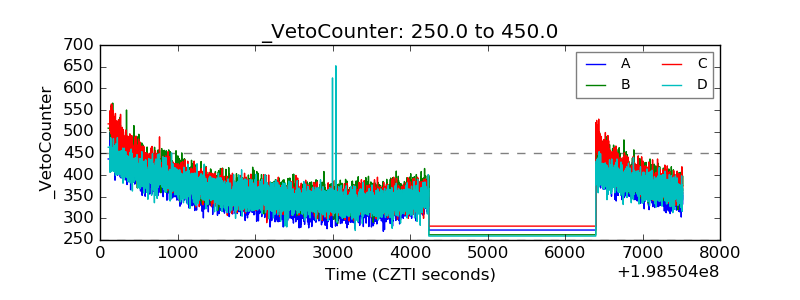 |