| Param | Original file | Final file |
|---|---|---|
| Filename | modeM0/AS1G05_238T05_9000000418_02983cztM0_level2.evt | modeM0/AS1G05_238T05_9000000418_02983cztM0_level2_quad_clean.evt |
| Size (bytes) | 428,973,120 | 66,562,560 |
| Size | 409.1 MB | 63.5 MB |
| Events in quadrant A | 4,006,025 | 409,346 |
| Events in quadrant B | 2,849,142 | 427,473 |
| Events in quadrant C | 2,580,958 | 416,211 |
| Events in quadrant D | 3,213,473 | 409,400 |
| Mode M0 | |||
|---|---|---|---|
| Quadrant | BADHDUFLAG | Total packets | Discarded packets |
| A | 0 | 15385 | 2 |
| B | 0 | 11740 | 1 |
| C | 0 | 11059 | 1 |
| D | 0 | 13052 | 1 |
| Mode M9 | |||
|---|---|---|---|
| Quadrant | BADHDUFLAG | Total packets | Discarded packets |
| A | 0 | 21 | 0 |
| B | 0 | 21 | 0 |
| C | 0 | 21 | 0 |
| D | 0 | 21 | 0 |
| Mode SS | |||
|---|---|---|---|
| Quadrant | BADHDUFLAG | Total packets | Discarded packets |
| A | 0 | 104 | 0 |
| B | 0 | 104 | 0 |
| C | 0 | 104 | 0 |
| D | 0 | 104 | 0 |
| Quadrant | Total seconds | Saturated seconds | Saturation percentage |
|---|---|---|---|
| A | 5026 | 545 | 10.843613% |
| B | 5026 | 114 | 2.268205% |
| C | 5026 | 96 | 1.910068% |
| D | 5026 | 62 | 1.233585% |
Noise dominated data is calculated using 1-second bins in cleaned event files. If a bin has >2000 counts, and if more than 50% of those come from <1% of pixels, then it is considered to be noise-dominated and hence unusable.
| Quadrant | # 1 sec bins | Bins with >0 counts | Bins with >2000 counts | High rate bins dominated by noise | Noise dominated (total time) | Noise dominated (detector-on time) | Marked lightcurve |
|---|---|---|---|---|---|---|---|
| A | 7181 | 5027 | 351 | 351 | 4.89% | 6.98% |  |
| B | 7181 | 5027 | 109 | 109 | 1.52% | 2.17% |  |
| C | 7181 | 5027 | 80 | 80 | 1.11% | 1.59% | 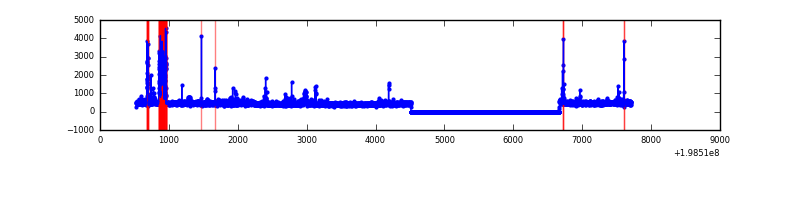 |
| D | 7181 | 5027 | 47 | 47 | 0.65% | 0.93% | 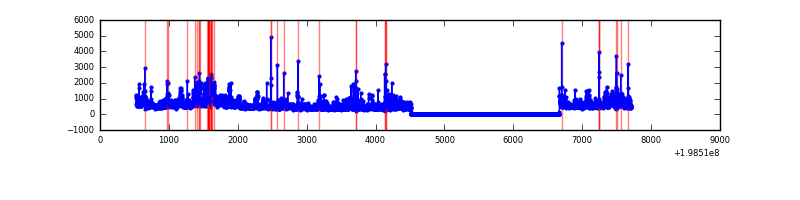 |
Top three noisy pixels from each quadrant. If the there are fewer than three noisy pixels in the level2.evt file, extra rows are filled as -1
| Pixel properties | Quadrant properties | ||||||
|---|---|---|---|---|---|---|---|
| Quadrant | DetID | PixID | Counts | Sigma | Mean | Median | Sigma |
| A | 13 | 9 | 1881775 | 17955.88 | 523 | 512 | 104.8 |
| A | 0 | 31 | 46810 | 441.9 | 523 | 512 | 104.8 |
| A | 13 | 14 | 13522 | 124.18 | 523 | 512 | 104.8 |
| B | 3 | 11 | 299269 | 2832.17 | 550 | 538 | 105.5 |
| B | 3 | 27 | 103447 | 975.64 | 550 | 538 | 105.5 |
| B | 6 | 203 | 101945 | 961.4 | 550 | 538 | 105.5 |
| C | 1 | 192 | 357776 | 2874.29 | 529 | 532 | 124.3 |
| C | 6 | 80 | 64047 | 511.02 | 529 | 532 | 124.3 |
| C | 1 | 16 | 22170 | 174.09 | 529 | 532 | 124.3 |
| D | 13 | 114 | 748001 | 5914.58 | 531 | 519 | 126.4 |
| D | 1 | 31 | 172684 | 1362.29 | 531 | 519 | 126.4 |
| D | 13 | 239 | 61836 | 485.18 | 531 | 519 | 126.4 |
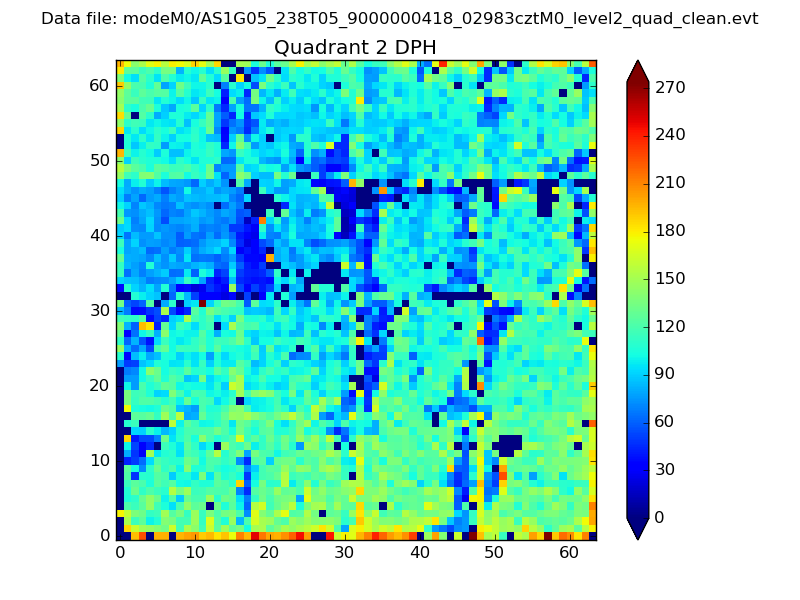
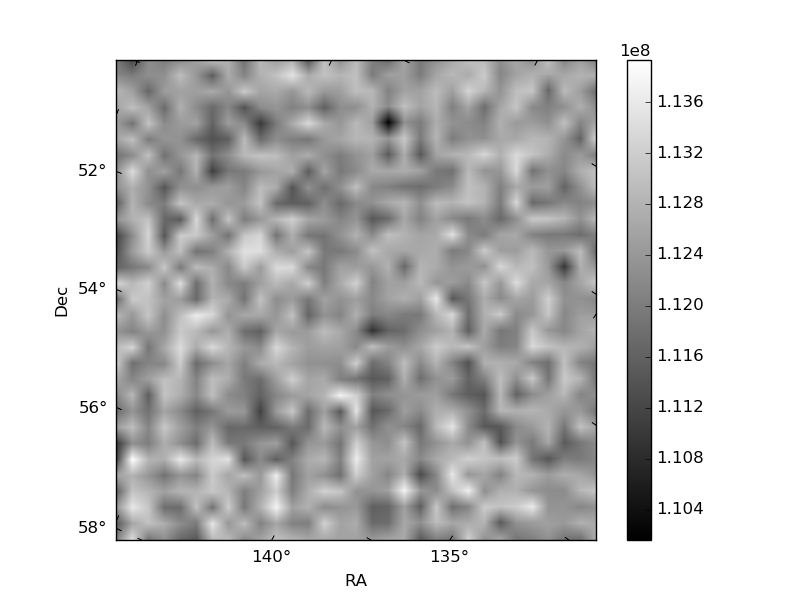
Histogram calculated using DETX and DETY for each event in the final _common_clean file
| Quadrant A | 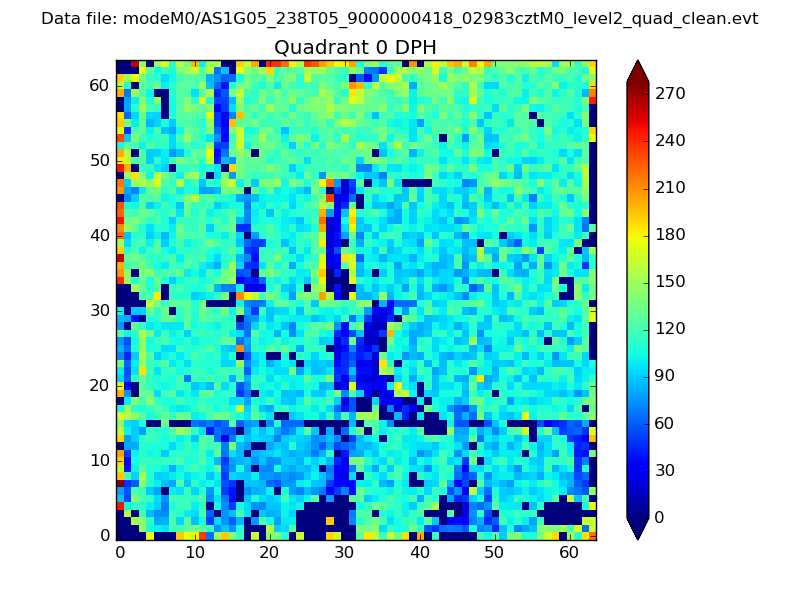 |
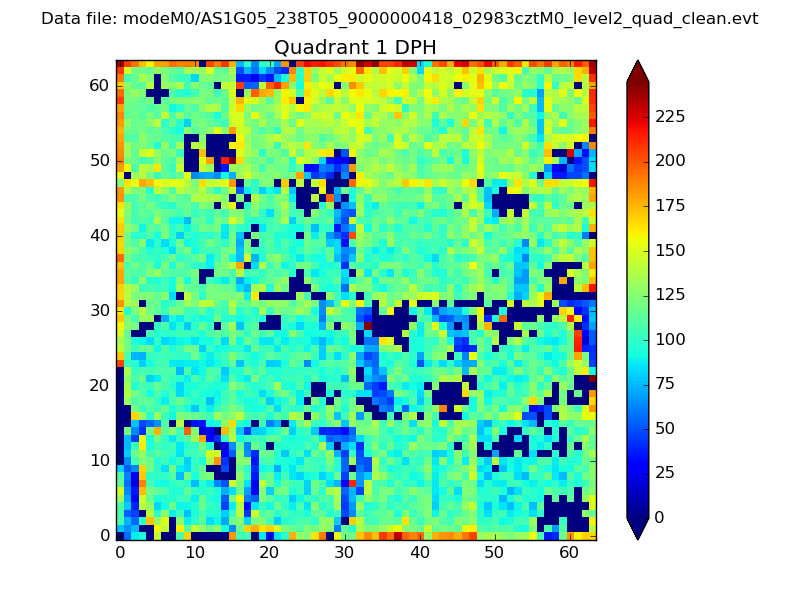 |
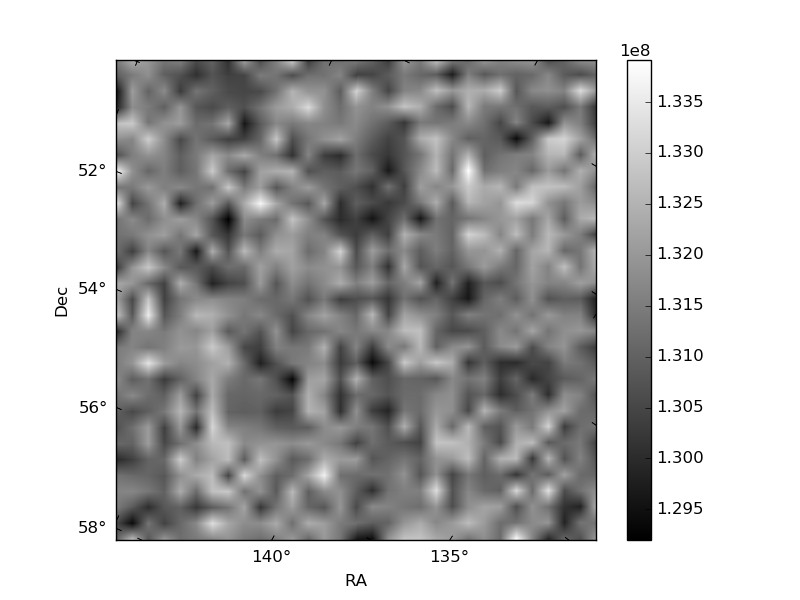
Quadrant B |
|---|---|---|---|
| Quadrant D | 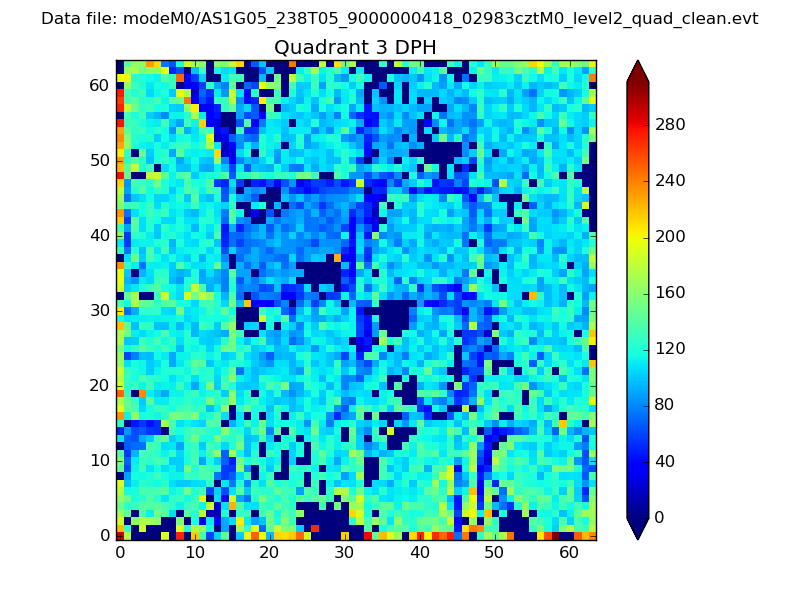 |
 |
Quadrant C |
| Plot type | Count rate plots | Images |
|---|---|---|
| Comparison with Poisson distribution Blue bars denote a histogram of data divided into 1 sec bins. Red curve is a Poisson curve with rate = median count rate of data. |
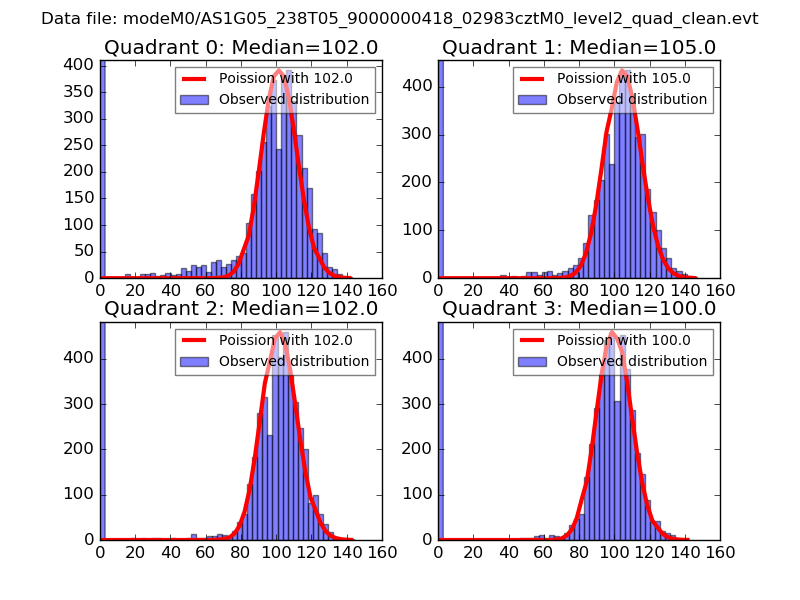 |
 |
| Quadrant-wise count rates Data is divided into 100 sec bins |
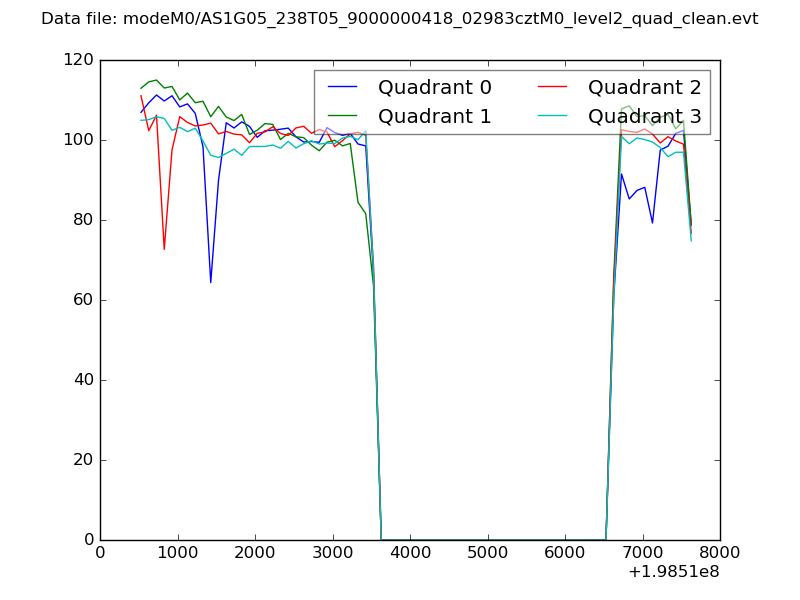 |
|
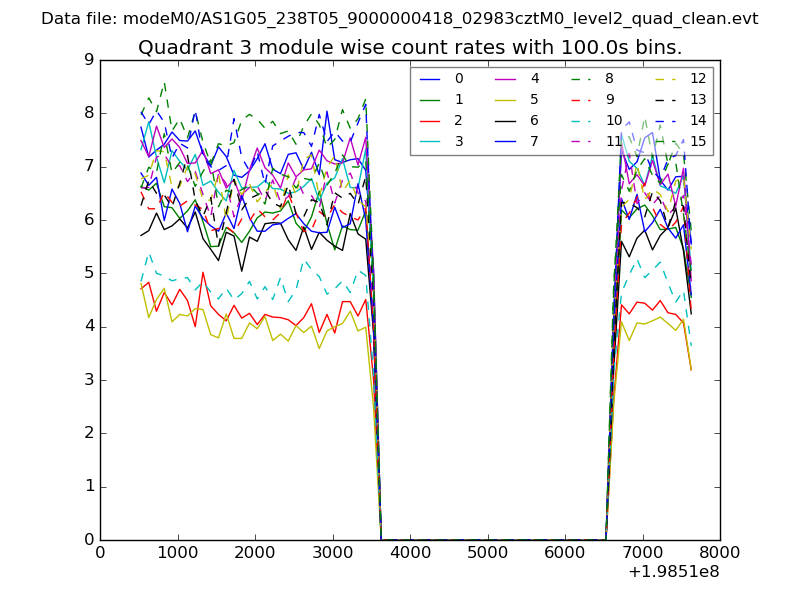
| Module-wise count rates for Quadrant A Data is divided into 100 sec bins |
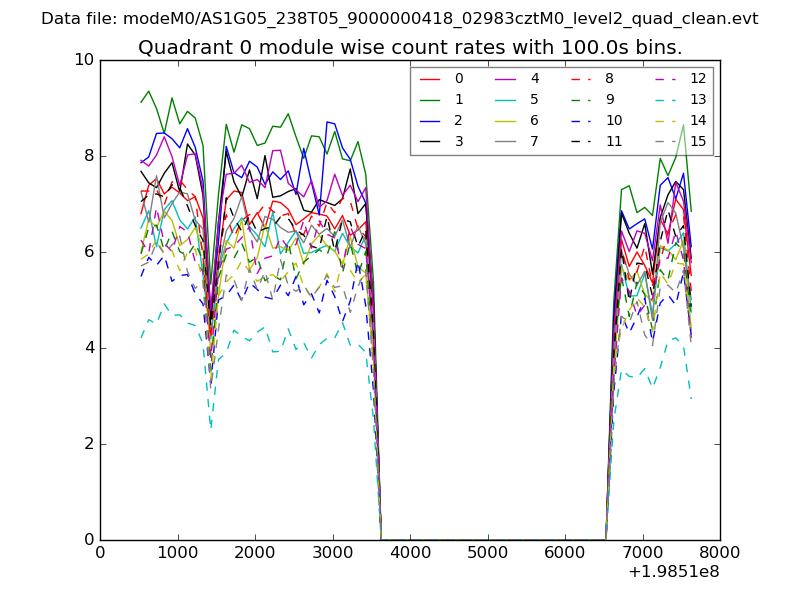 |
 |
| Module-wise count rates for Quadrant B Data is divided into 100 sec bins |
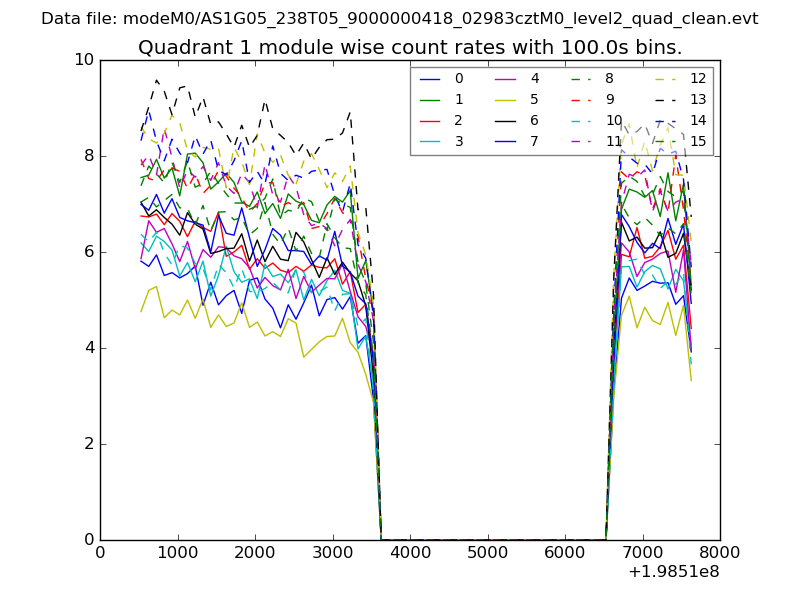 |
 |
| Module-wise count rates for Quadrant C Data is divided into 100 sec bins |
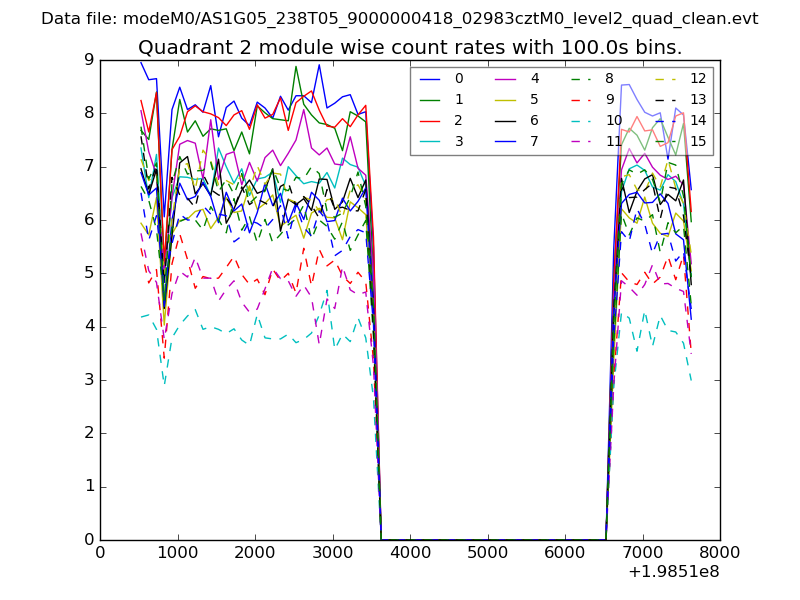 |
 |
| Module-wise count rates for Quadrant D Data is divided into 100 sec bins |
 |
 |
| Parameter | Plot |
|---|---|
| CZT HV Monitor | 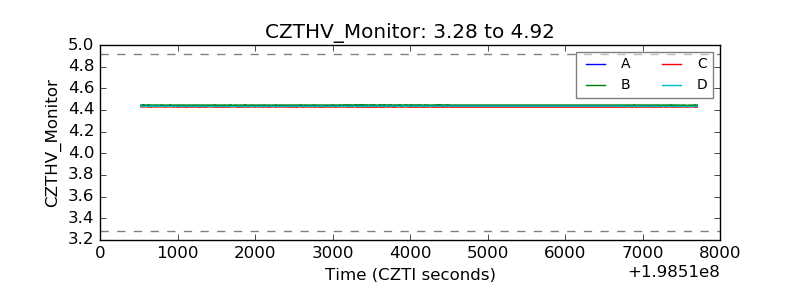 |
| D_VDD |  |
| Temperature 1 | 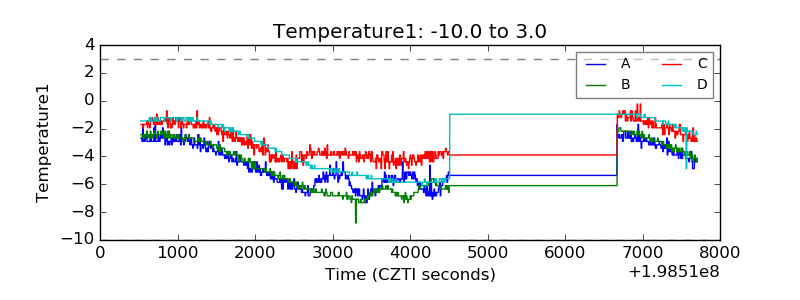 |
| Veto HV Monitor | 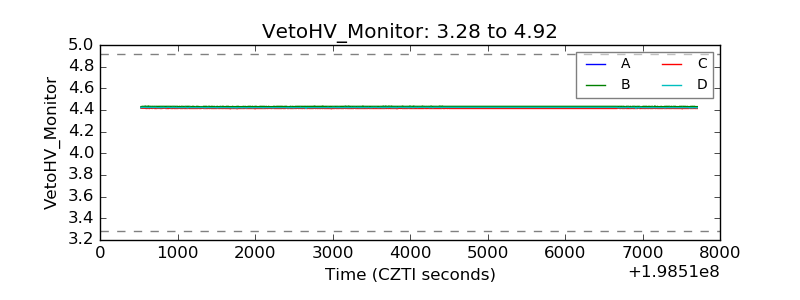 |
| Veto LLD | 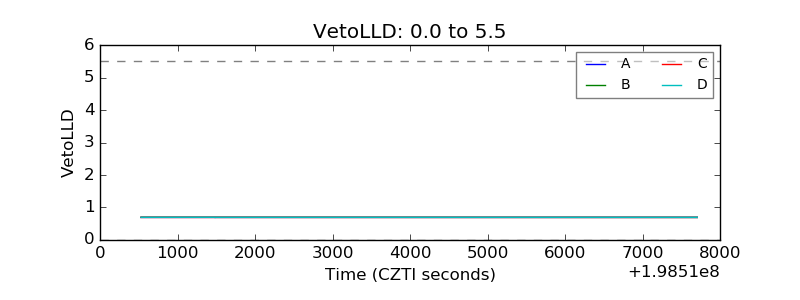 |
| Alpha Counter | 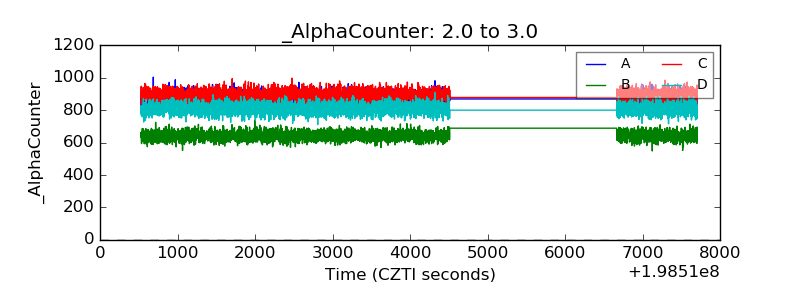 |
| _CPM_Rate | 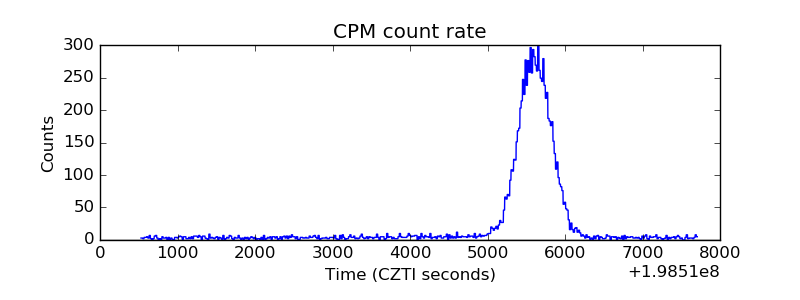 |
| CZT Counter | 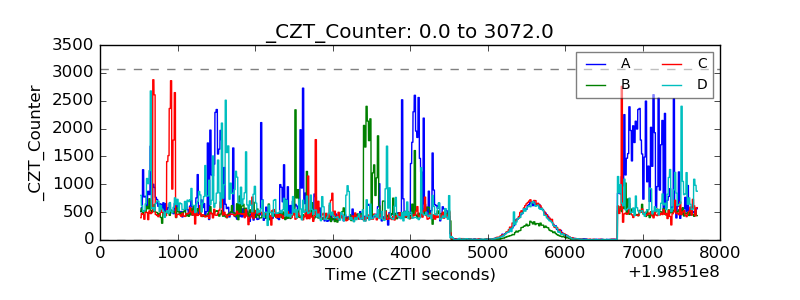 |
| +2.5 Volts monitor |  |
| +5 Volts monitor | 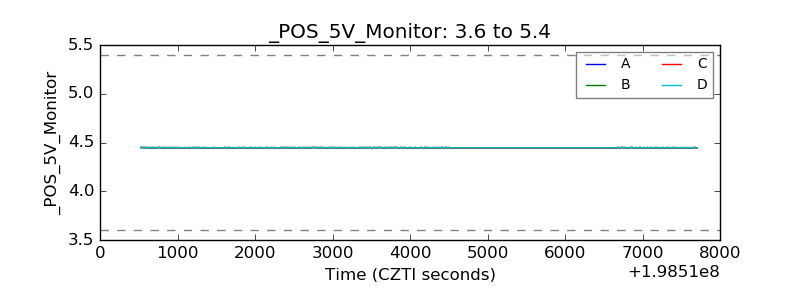 |
| _ROLL_ROT | 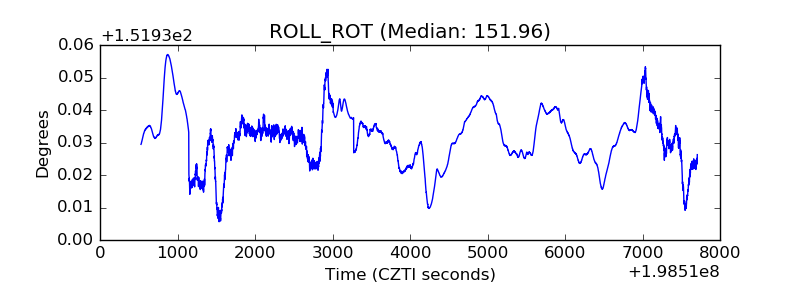 |
| _Roll_DEC | 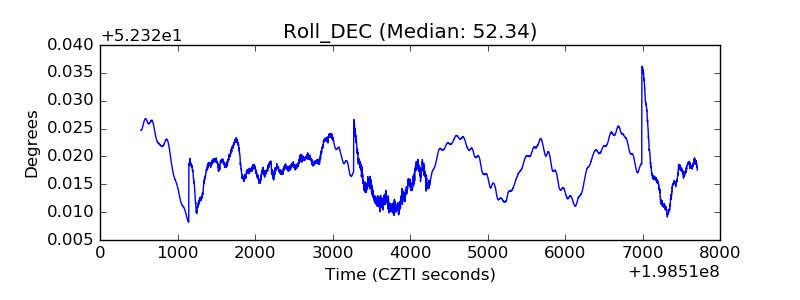 |
| _Roll_RA | 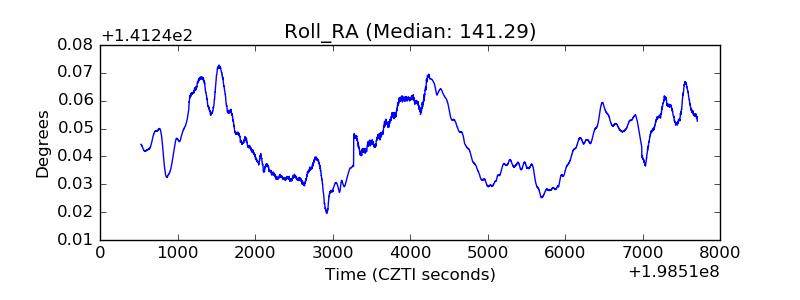 |
| Veto Counter | 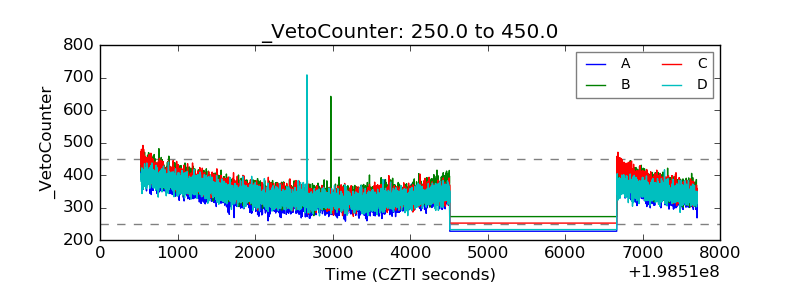 |