| Param | Original file | Final file |
|---|---|---|
| Filename | modeM0/AS1G05_238T05_9000000418_02984cztM0_level2.evt | modeM0/AS1G05_238T05_9000000418_02984cztM0_level2_quad_clean.evt |
| Size (bytes) | 414,397,440 | 57,726,720 |
| Size | 395.2 MB | 55.1 MB |
| Events in quadrant A | 3,930,397 | 341,970 |
| Events in quadrant B | 2,839,568 | 358,163 |
| Events in quadrant C | 2,317,448 | 355,120 |
| Events in quadrant D | 3,127,822 | 346,757 |
| Mode M0 | |||
|---|---|---|---|
| Quadrant | BADHDUFLAG | Total packets | Discarded packets |
| A | 0 | 15049 | 3 |
| B | 0 | 11766 | 2 |
| C | 0 | 10180 | 2 |
| D | 0 | 12695 | 2 |
| Mode M9 | |||
|---|---|---|---|
| Quadrant | BADHDUFLAG | Total packets | Discarded packets |
| A | 0 | 27 | 0 |
| B | 0 | 27 | 0 |
| C | 0 | 27 | 0 |
| D | 0 | 28 | 0 |
| Mode SS | |||
|---|---|---|---|
| Quadrant | BADHDUFLAG | Total packets | Discarded packets |
| A | 0 | 100 | 0 |
| B | 0 | 100 | 0 |
| C | 0 | 100 | 0 |
| D | 0 | 100 | 0 |
| Quadrant | Total seconds | Saturated seconds | Saturation percentage |
|---|---|---|---|
| A | 4926 | 431 | 8.749492% |
| B | 4926 | 160 | 3.248071% |
| C | 4926 | 11 | 0.223305% |
| D | 4926 | 93 | 1.887942% |
Noise dominated data is calculated using 1-second bins in cleaned event files. If a bin has >2000 counts, and if more than 50% of those come from <1% of pixels, then it is considered to be noise-dominated and hence unusable.
| Quadrant | # 1 sec bins | Bins with >0 counts | Bins with >2000 counts | High rate bins dominated by noise | Noise dominated (total time) | Noise dominated (detector-on time) | Marked lightcurve |
|---|---|---|---|---|---|---|---|
| A | 7081 | 4927 | 295 | 295 | 4.17% | 5.99% | 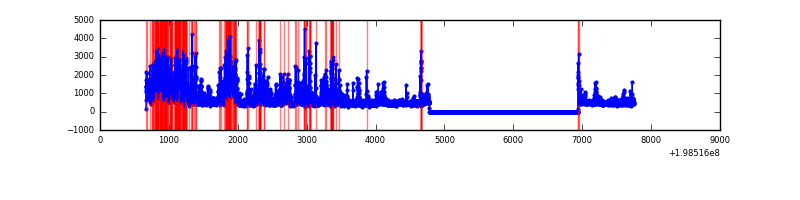 |
| B | 7081 | 4927 | 141 | 141 | 1.99% | 2.86% | 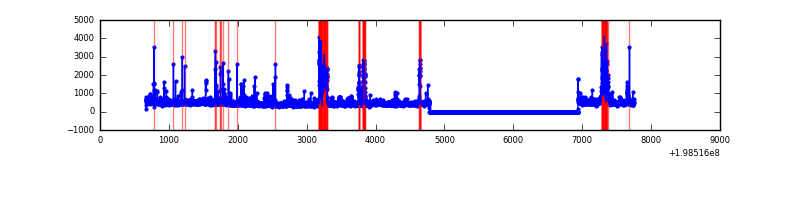 |
| C | 7081 | 4927 | 8 | 8 | 0.11% | 0.16% | 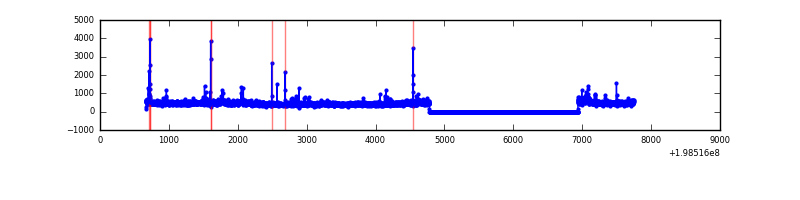 |
| D | 7081 | 4927 | 83 | 83 | 1.17% | 1.68% | 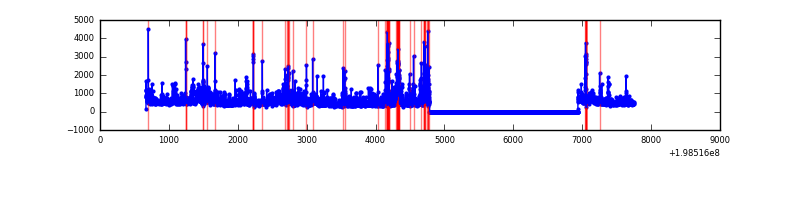 |
Top three noisy pixels from each quadrant. If the there are fewer than three noisy pixels in the level2.evt file, extra rows are filled as -1
| Pixel properties | Quadrant properties | ||||||
|---|---|---|---|---|---|---|---|
| Quadrant | DetID | PixID | Counts | Sigma | Mean | Median | Sigma |
| A | 13 | 9 | 1829103 | 17807.14 | 505 | 493 | 102.7 |
| A | 0 | 31 | 54851 | 529.34 | 505 | 493 | 102.7 |
| A | 0 | 50 | 30788 | 295.02 | 505 | 493 | 102.7 |
| B | 3 | 11 | 331432 | 3261.39 | 527 | 516 | 101.5 |
| B | 2 | 249 | 168669 | 1657.26 | 527 | 516 | 101.5 |
| B | 6 | 203 | 101084 | 991.16 | 527 | 516 | 101.5 |
| C | 1 | 192 | 154634 | 1265.27 | 512 | 515 | 121.8 |
| C | 6 | 80 | 57954 | 471.55 | 512 | 515 | 121.8 |
| C | 1 | 16 | 55627 | 452.45 | 512 | 515 | 121.8 |
| D | 1 | 31 | 469054 | 3847.92 | 506 | 494 | 121.8 |
| D | 13 | 114 | 416302 | 3414.71 | 506 | 494 | 121.8 |
| D | 15 | 35 | 59591 | 485.32 | 506 | 494 | 121.8 |
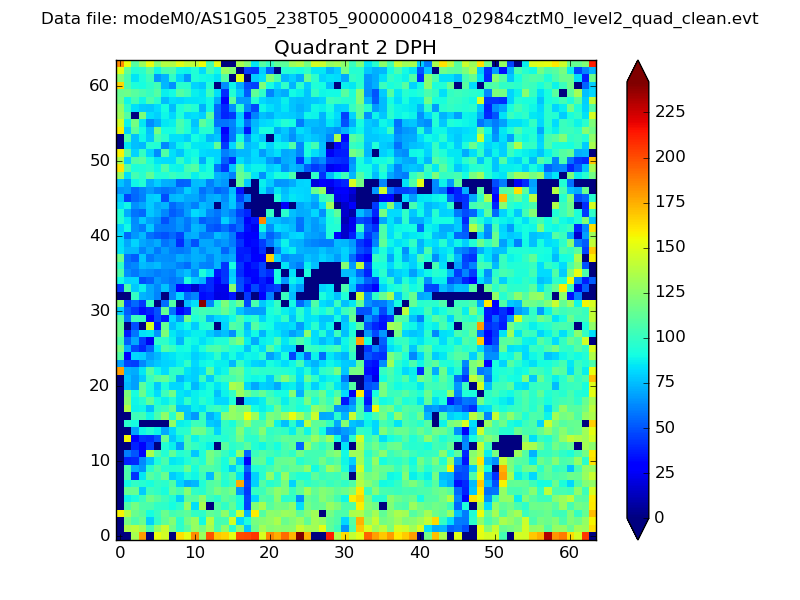
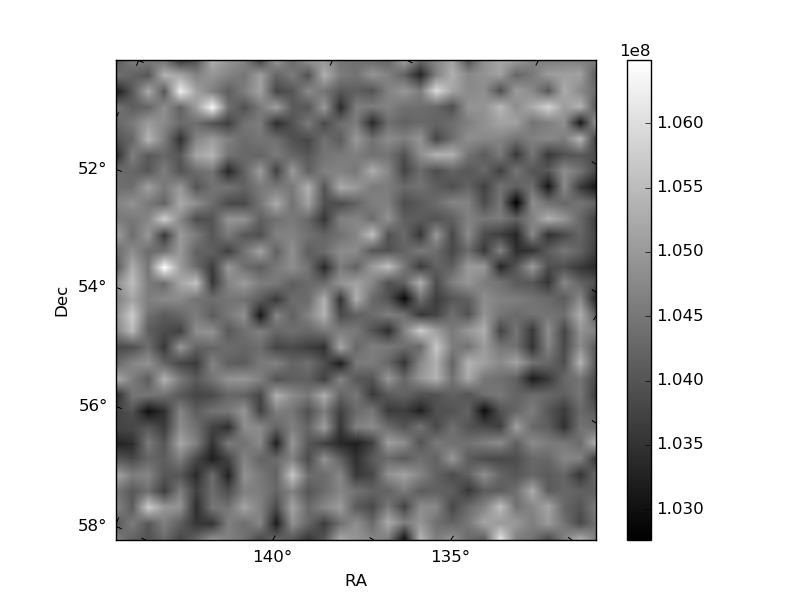
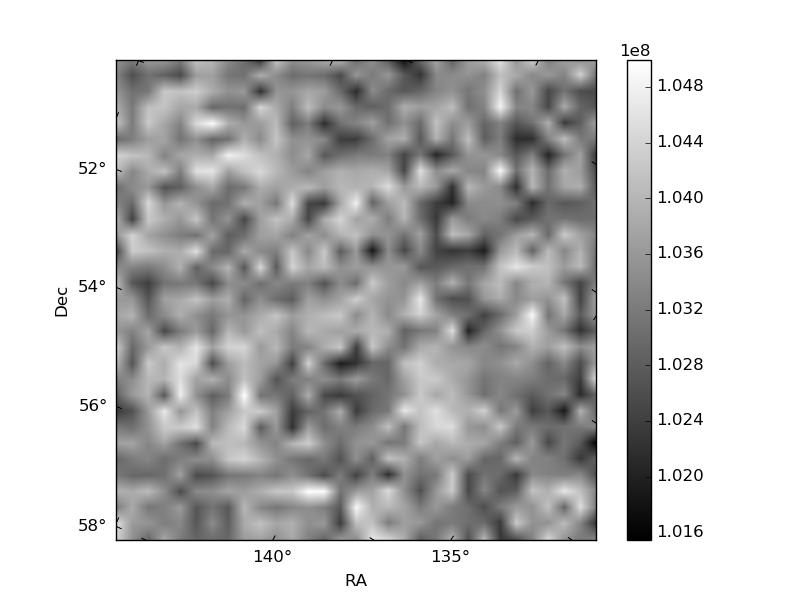
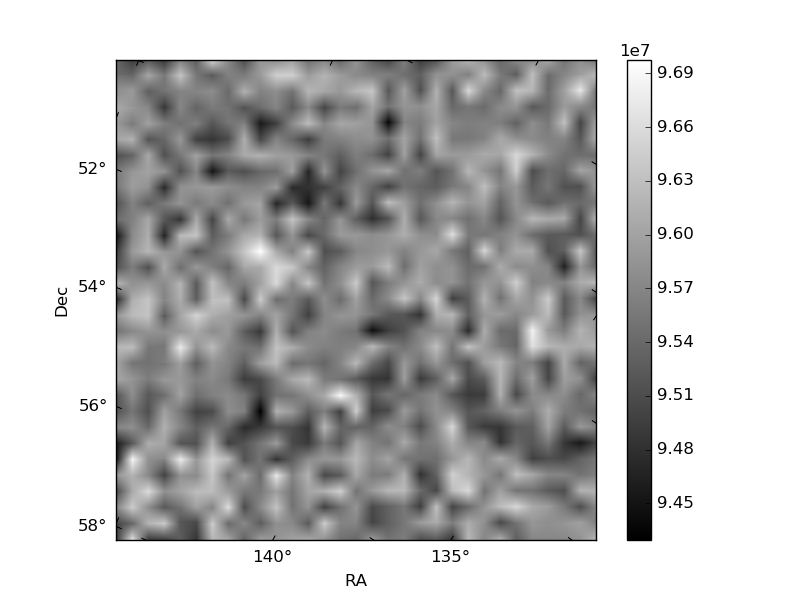
Histogram calculated using DETX and DETY for each event in the final _common_clean file
| Quadrant A | 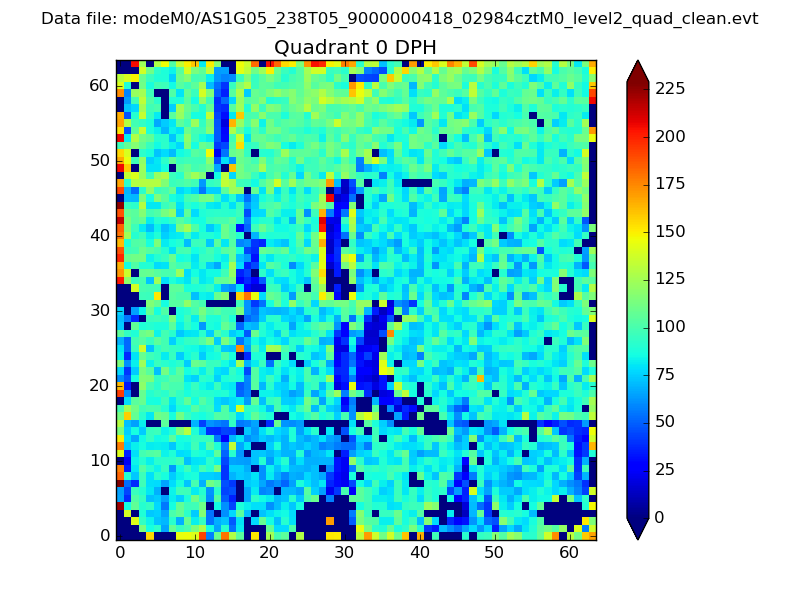 |
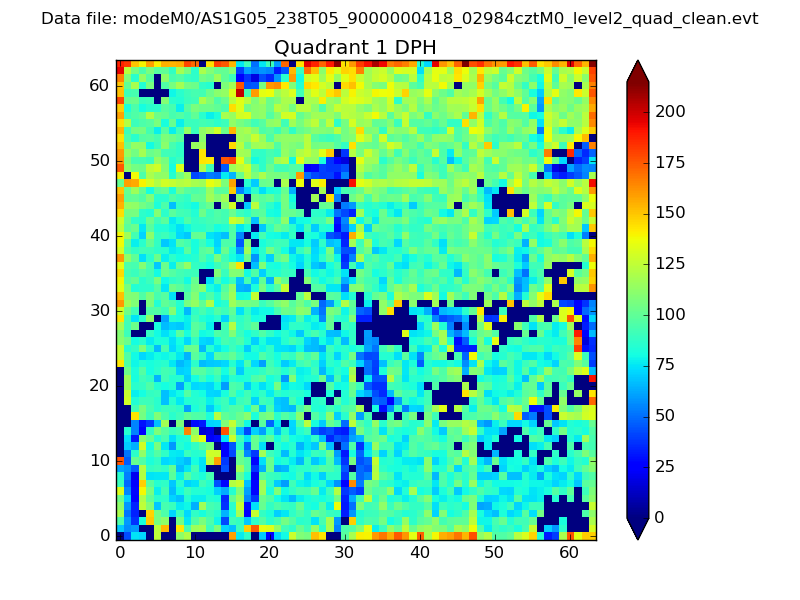 |
Quadrant B |
|---|---|---|---|
| Quadrant D | 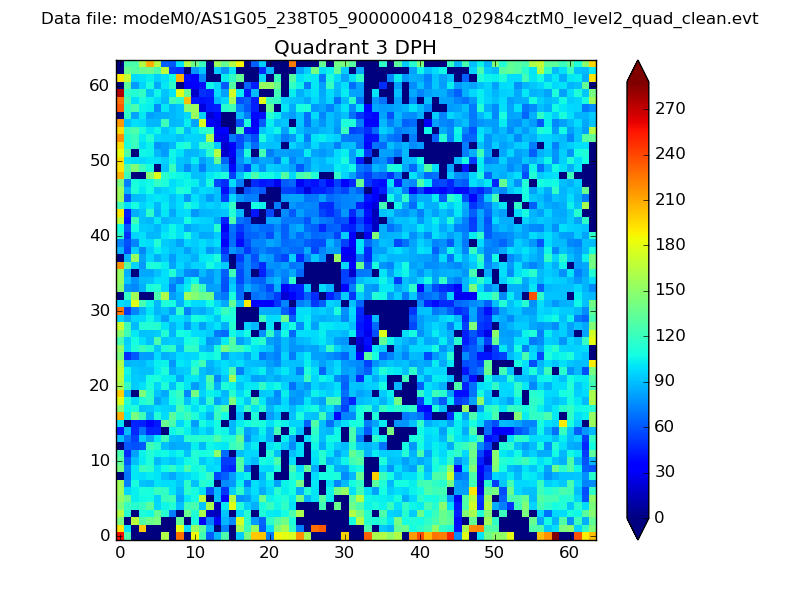 |
 |
Quadrant C |
| Plot type | Count rate plots | Images |
|---|---|---|
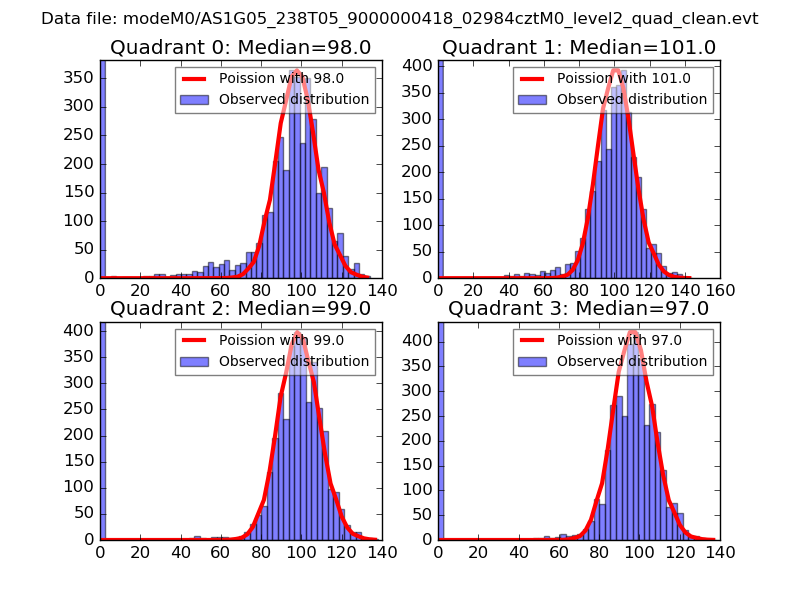
| Comparison with Poisson distribution Blue bars denote a histogram of data divided into 1 sec bins. Red curve is a Poisson curve with rate = median count rate of data. |
 |
 |
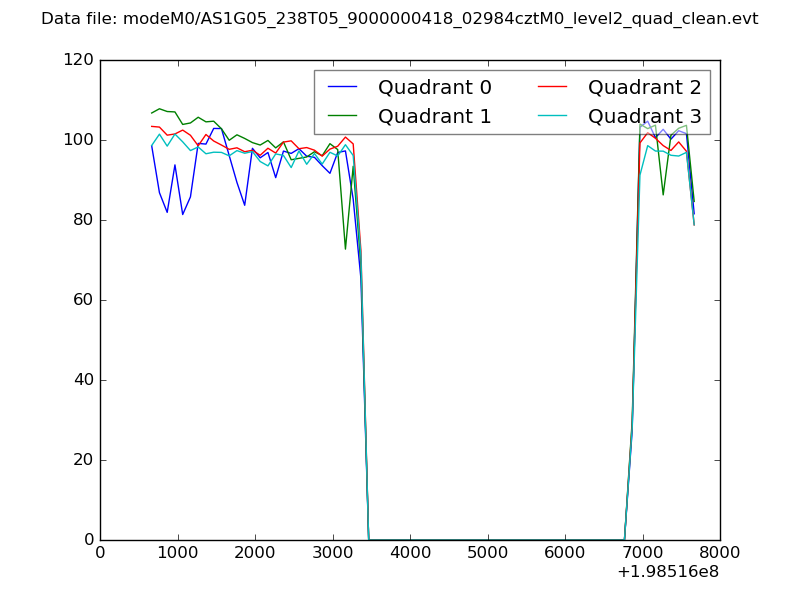
| Quadrant-wise count rates Data is divided into 100 sec bins |
 |
|
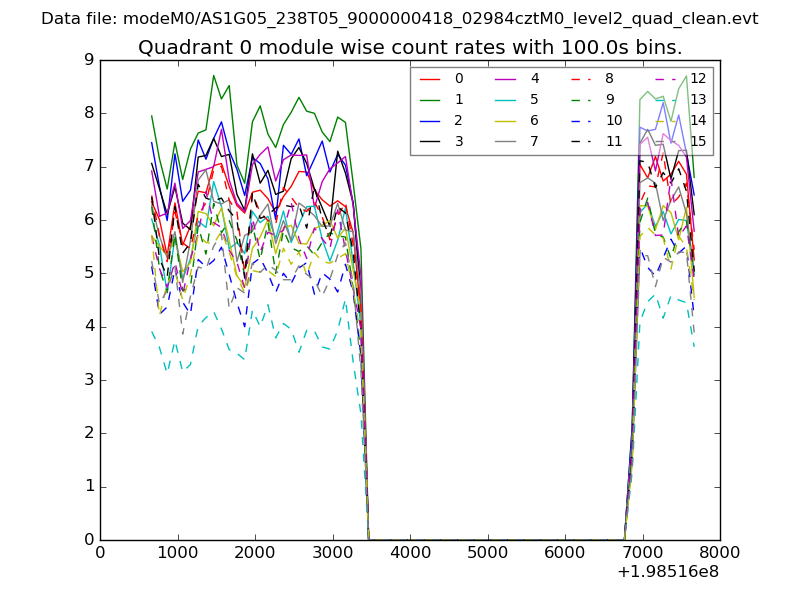
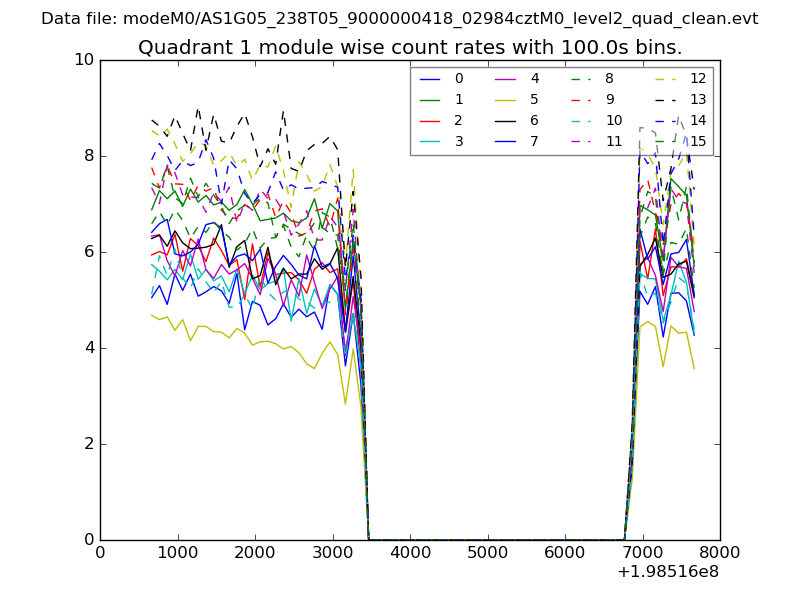
| Module-wise count rates for Quadrant A Data is divided into 100 sec bins |
 |
 |
| Module-wise count rates for Quadrant B Data is divided into 100 sec bins |
 |
 |
| Module-wise count rates for Quadrant C Data is divided into 100 sec bins |
 |
 |
| Module-wise count rates for Quadrant D Data is divided into 100 sec bins |
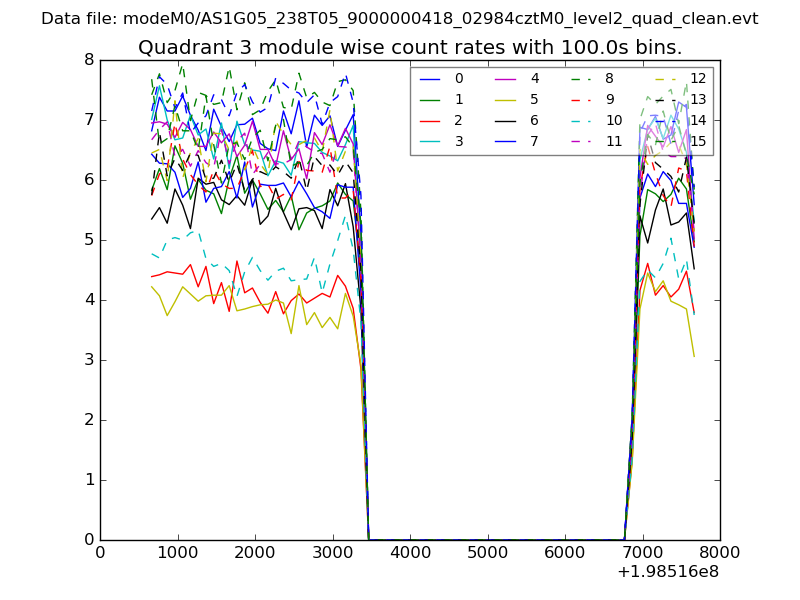 |
 |
| Parameter | Plot |
|---|---|
| CZT HV Monitor |  |
| D_VDD | 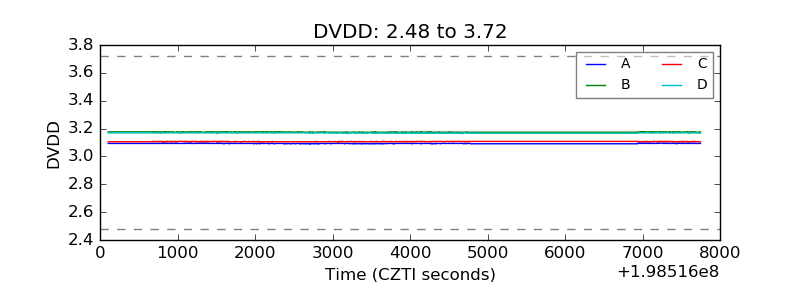 |
| Temperature 1 | 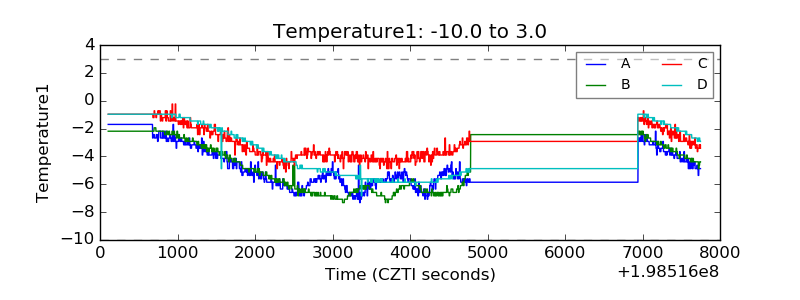 |
| Veto HV Monitor | 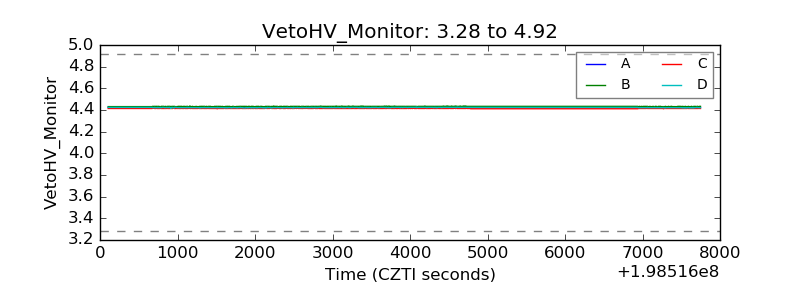 |
| Veto LLD | 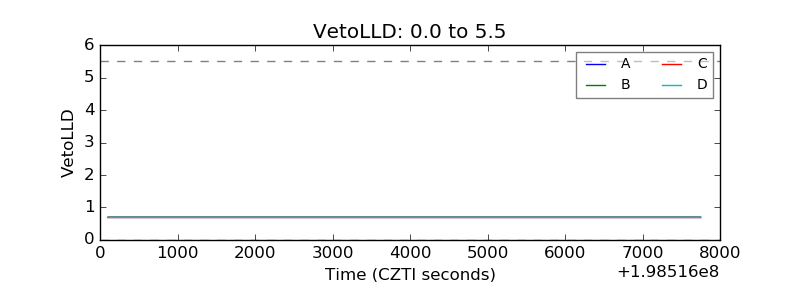 |
| Alpha Counter | 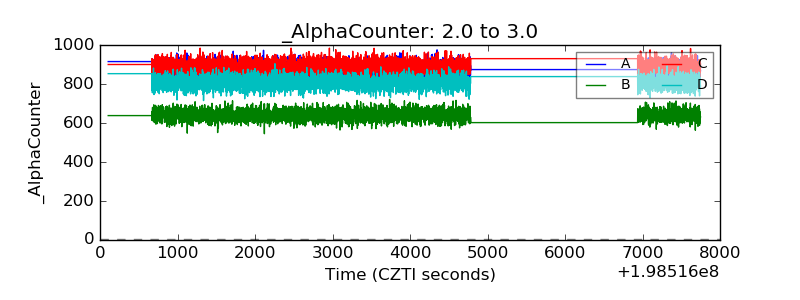 |
| _CPM_Rate | 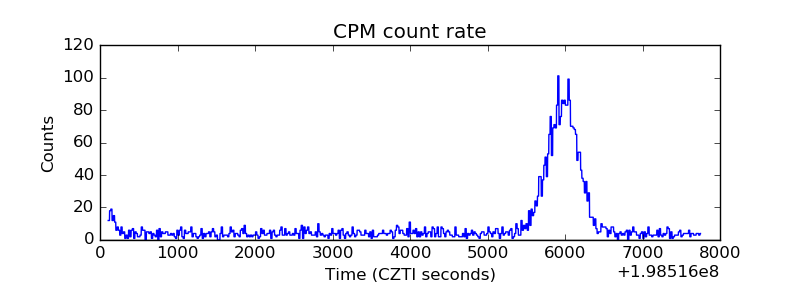 |
| CZT Counter |  |
| +2.5 Volts monitor |  |
| +5 Volts monitor | 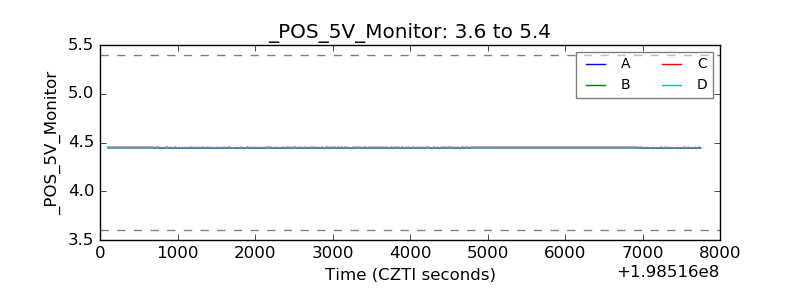 |
| _ROLL_ROT | 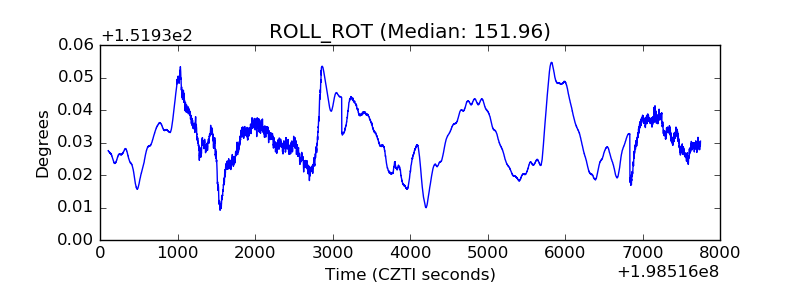 |
| _Roll_DEC | 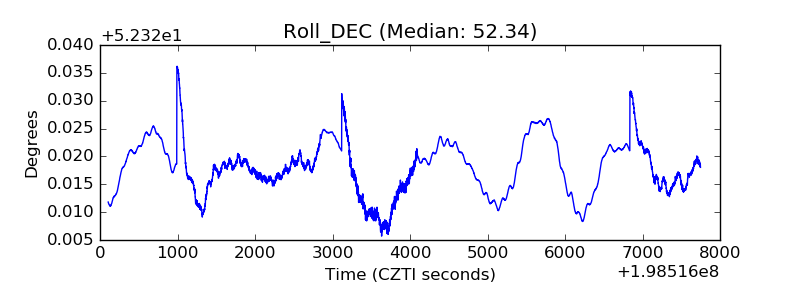 |
| _Roll_RA |  |
| Veto Counter | 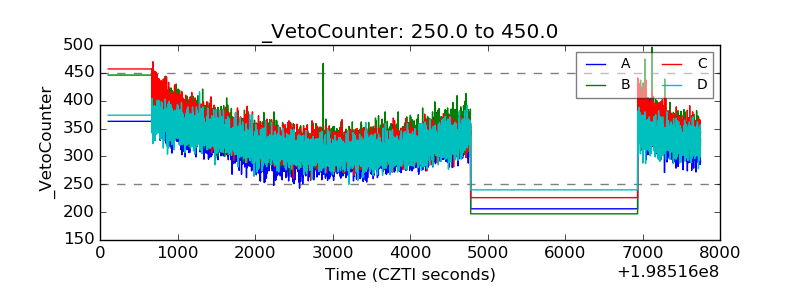 |