| Param | Original file | Final file |
|---|---|---|
| Filename | modeM0/AS1G05_238T05_9000000418_02985cztM0_level2.evt | modeM0/AS1G05_238T05_9000000418_02985cztM0_level2_quad_clean.evt |
| Size (bytes) | 349,263,360 | 52,315,200 |
| Size | 333.1 MB | 49.9 MB |
| Events in quadrant A | 2,682,908 | 308,973 |
| Events in quadrant B | 2,787,564 | 312,090 |
| Events in quadrant C | 2,154,332 | 311,050 |
| Events in quadrant D | 2,614,956 | 303,874 |
| Mode M0 | |||
|---|---|---|---|
| Quadrant | BADHDUFLAG | Total packets | Discarded packets |
| A | 0 | 11462 | 3 |
| B | 0 | 11800 | 2 |
| C | 0 | 10156 | 2 |
| D | 0 | 11329 | 2 |
| Mode M9 | |||
|---|---|---|---|
| Quadrant | BADHDUFLAG | Total packets | Discarded packets |
| A | 0 | 35 | 0 |
| B | 0 | 35 | 0 |
| C | 0 | 35 | 0 |
| D | 0 | 36 | 0 |
| Mode SS | |||
|---|---|---|---|
| Quadrant | BADHDUFLAG | Total packets | Discarded packets |
| A | 0 | 100 | 0 |
| B | 0 | 100 | 0 |
| C | 0 | 100 | 0 |
| D | 0 | 100 | 0 |
| Quadrant | Total seconds | Saturated seconds | Saturation percentage |
|---|---|---|---|
| A | 4961 | 88 | 1.773836% |
| B | 4961 | 104 | 2.096352% |
| C | 4961 | 8 | 0.161258% |
| D | 4961 | 43 | 0.866761% |
Noise dominated data is calculated using 1-second bins in cleaned event files. If a bin has >2000 counts, and if more than 50% of those come from <1% of pixels, then it is considered to be noise-dominated and hence unusable.
| Quadrant | # 1 sec bins | Bins with >0 counts | Bins with >2000 counts | High rate bins dominated by noise | Noise dominated (total time) | Noise dominated (detector-on time) | Marked lightcurve |
|---|---|---|---|---|---|---|---|
| A | 7116 | 4962 | 75 | 75 | 1.05% | 1.51% | 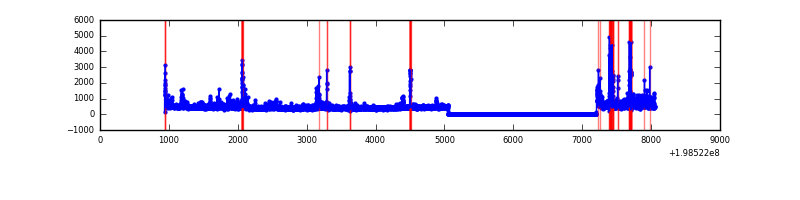 |
| B | 7116 | 4962 | 81 | 81 | 1.14% | 1.63% | 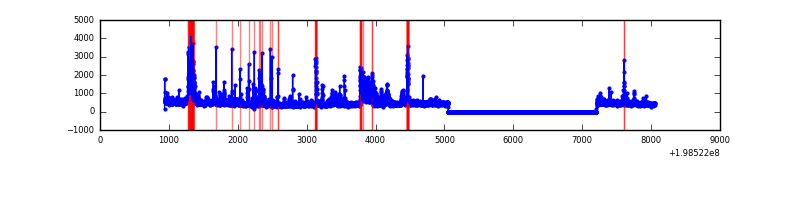 |
| C | 7116 | 4962 | 2 | 2 | 0.03% | 0.04% | 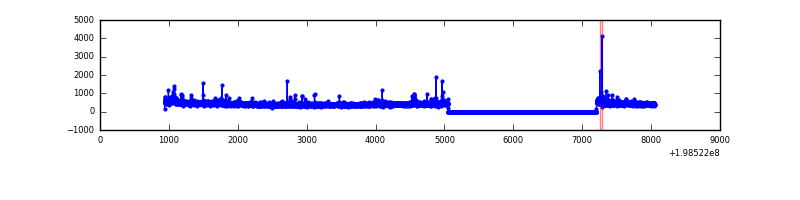 |
| D | 7116 | 4962 | 35 | 35 | 0.49% | 0.71% | 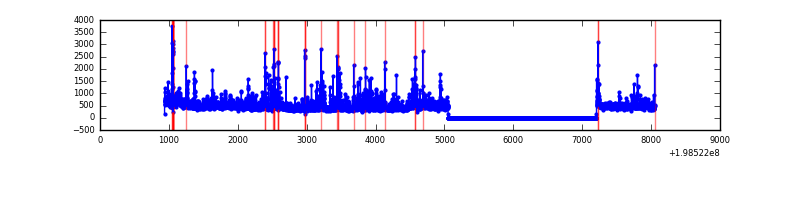 |
Top three noisy pixels from each quadrant. If the there are fewer than three noisy pixels in the level2.evt file, extra rows are filled as -1
| Pixel properties | Quadrant properties | ||||||
|---|---|---|---|---|---|---|---|
| Quadrant | DetID | PixID | Counts | Sigma | Mean | Median | Sigma |
| A | 13 | 9 | 440158 | 4193.25 | 508 | 496 | 104.8 |
| A | 0 | 50 | 167670 | 1594.41 | 508 | 496 | 104.8 |
| A | 0 | 31 | 40492 | 381.46 | 508 | 496 | 104.8 |
| B | 3 | 11 | 254476 | 2511.21 | 522 | 510 | 101.1 |
| B | 2 | 249 | 208464 | 2056.25 | 522 | 510 | 101.1 |
| B | 0 | 219 | 63111 | 619.0 | 522 | 510 | 101.1 |
| C | 6 | 80 | 51479 | 423.1 | 506 | 509 | 120.5 |
| C | 0 | 219 | 45238 | 371.3 | 506 | 509 | 120.5 |
| C | 1 | 16 | 40237 | 329.78 | 506 | 509 | 120.5 |
| D | 13 | 114 | 207473 | 1666.49 | 498 | 487 | 124.2 |
| D | 1 | 31 | 111330 | 892.42 | 498 | 487 | 124.2 |
| D | 13 | 239 | 73694 | 589.41 | 498 | 487 | 124.2 |
Histogram calculated using DETX and DETY for each event in the final _common_clean file
| Quadrant A | 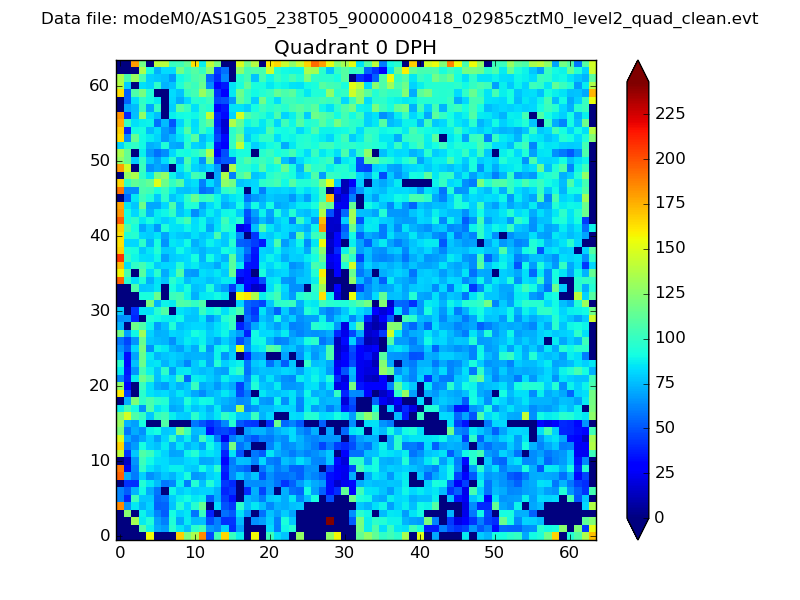 |
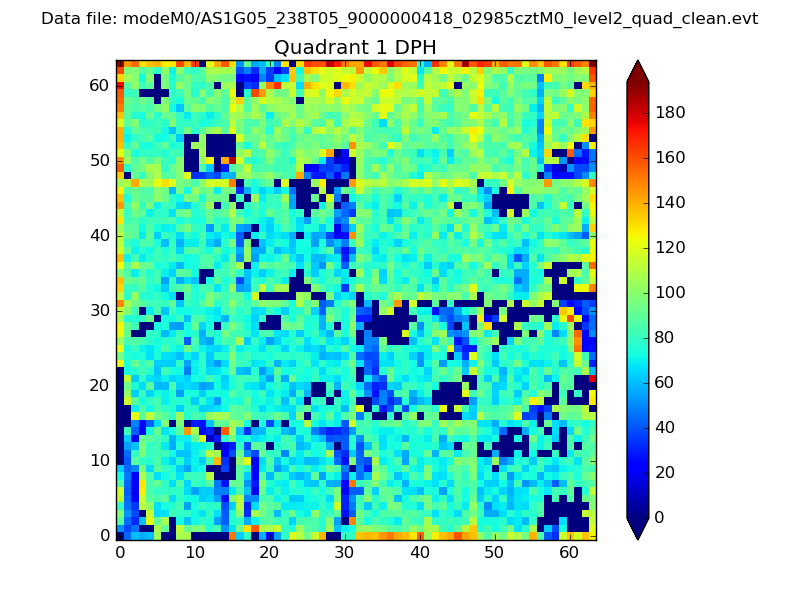 |
Quadrant B |
|---|---|---|---|
| Quadrant D | 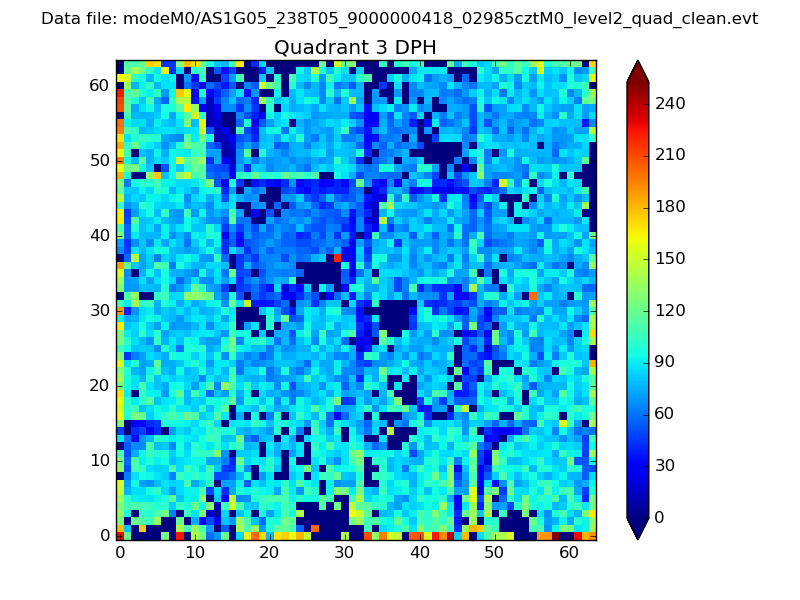 |
 |
Quadrant C |
| Plot type | Count rate plots | Images |
|---|---|---|
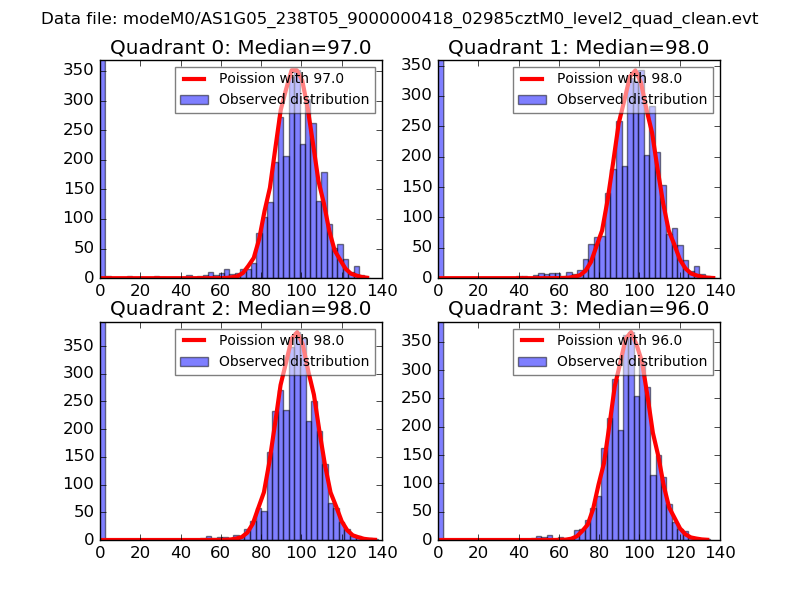
| Comparison with Poisson distribution Blue bars denote a histogram of data divided into 1 sec bins. Red curve is a Poisson curve with rate = median count rate of data. |
 |
 |
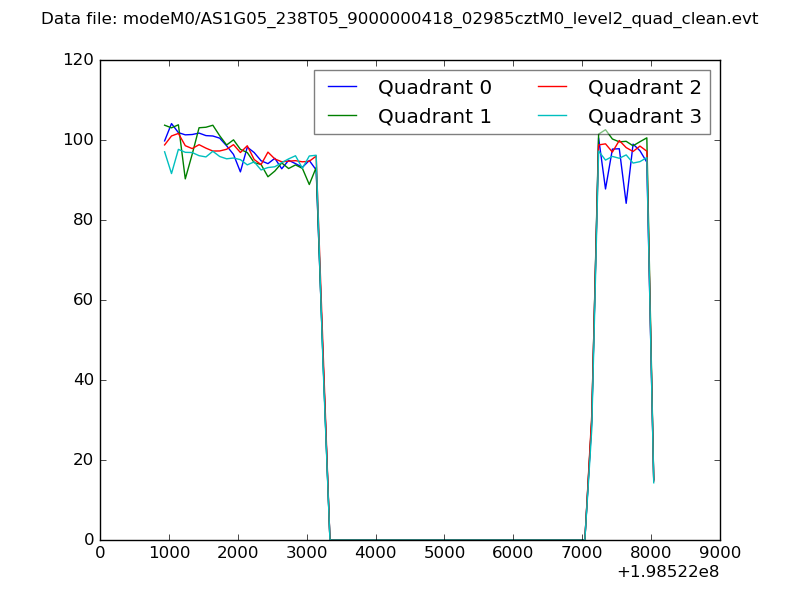
| Quadrant-wise count rates Data is divided into 100 sec bins |
 |
|
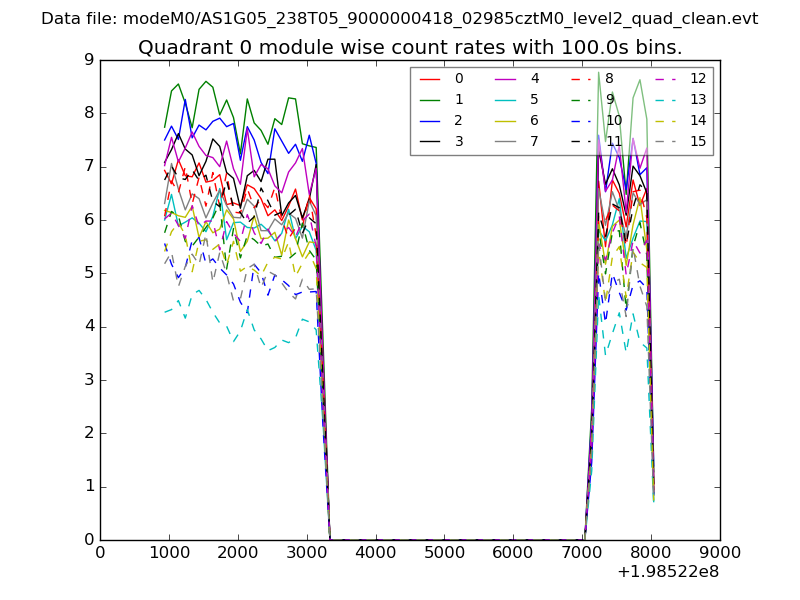
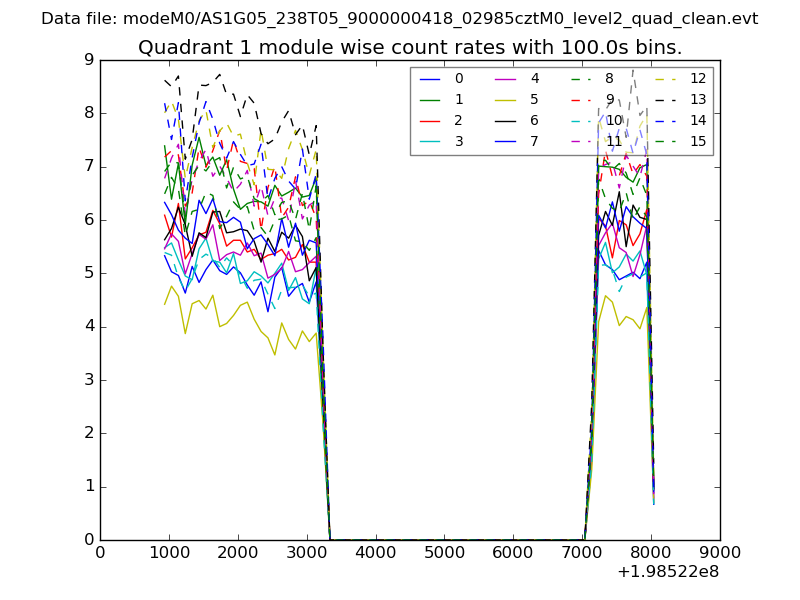
| Module-wise count rates for Quadrant A Data is divided into 100 sec bins |
 |
 |
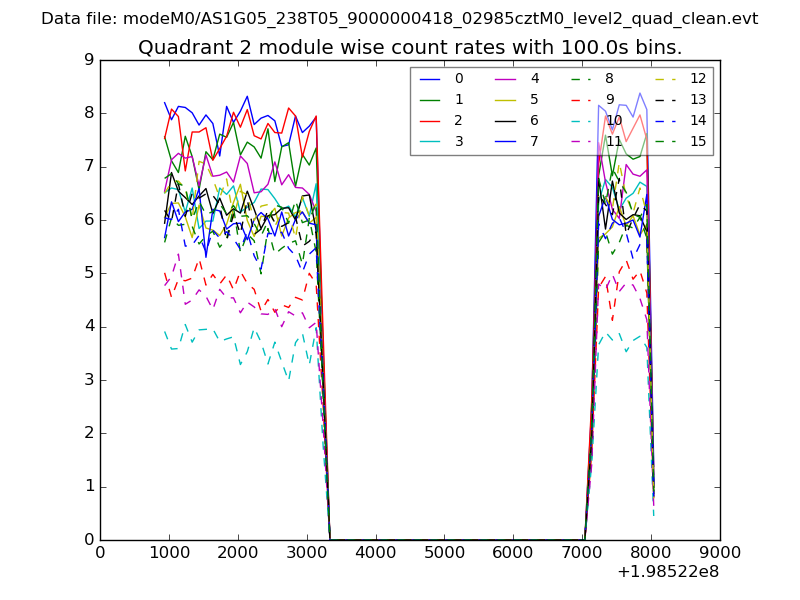
| Module-wise count rates for Quadrant B Data is divided into 100 sec bins |
 |
 |
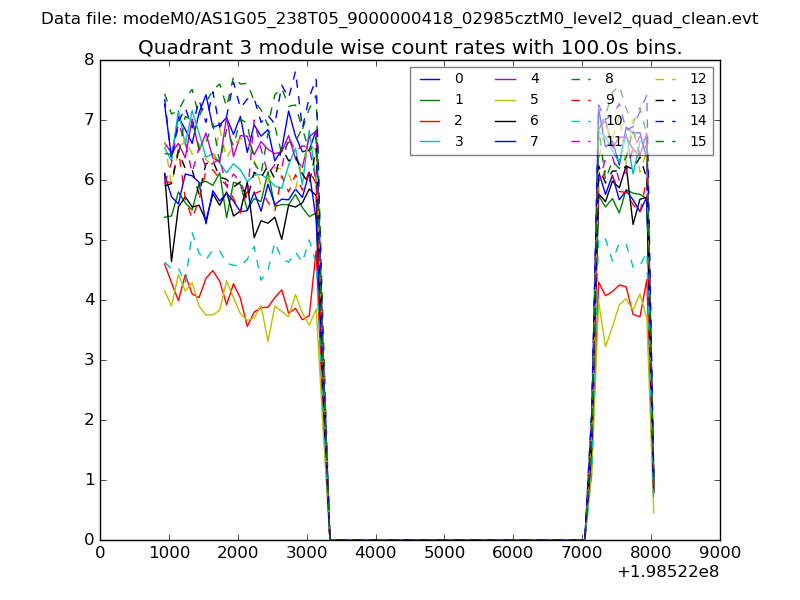
| Module-wise count rates for Quadrant C Data is divided into 100 sec bins |
 |
 |
| Module-wise count rates for Quadrant D Data is divided into 100 sec bins |
 |
 |
| Parameter | Plot |
|---|---|
| CZT HV Monitor | 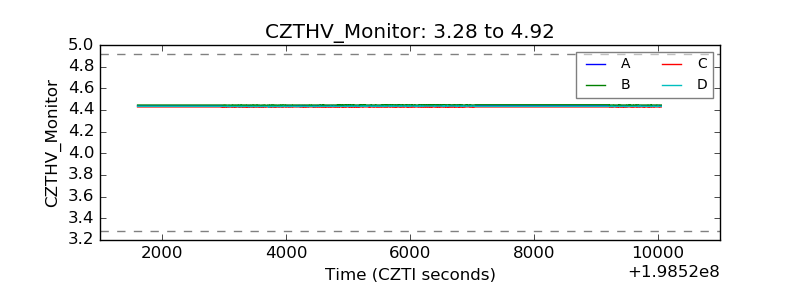 |
| D_VDD |  |
| Temperature 1 | 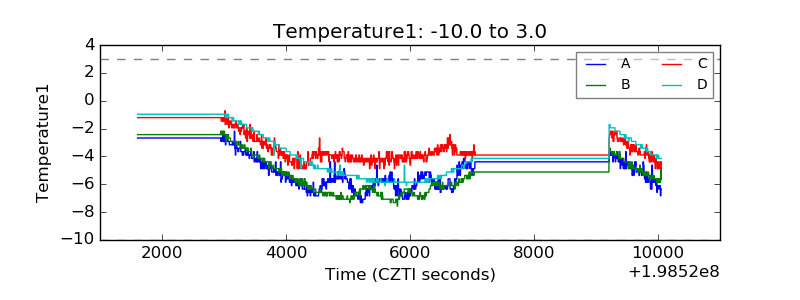 |
| Veto HV Monitor | 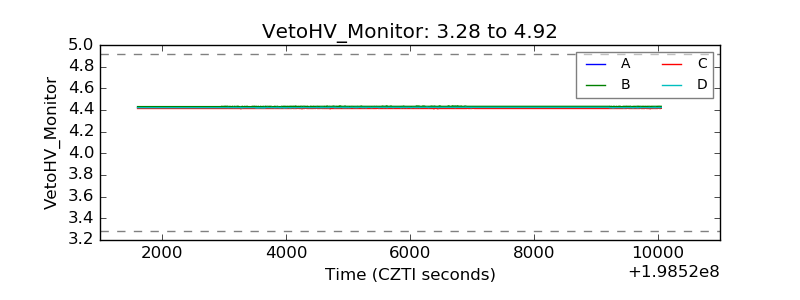 |
| Veto LLD | 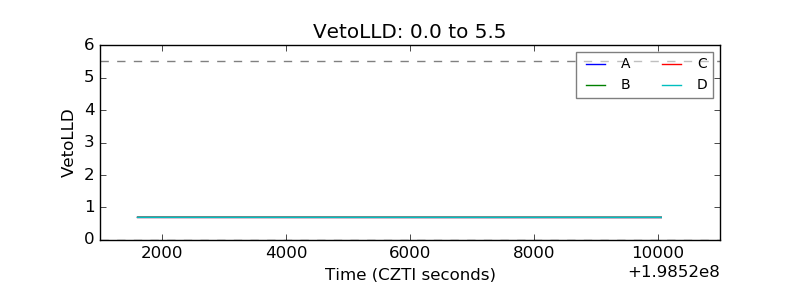 |
| Alpha Counter | 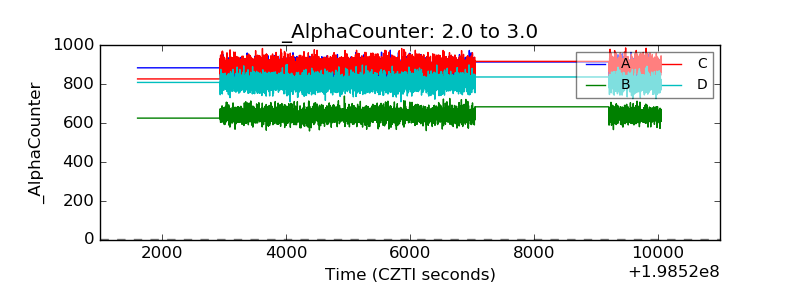 |
| _CPM_Rate | 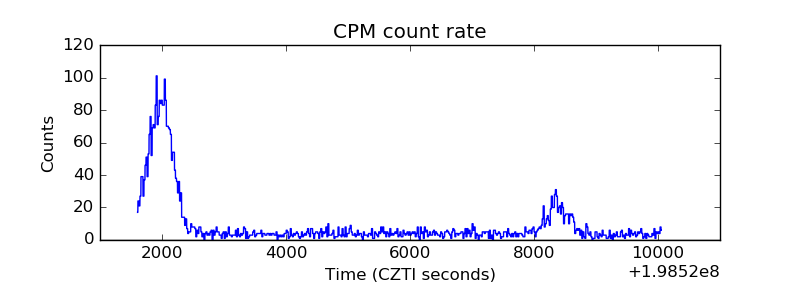 |
| CZT Counter |  |
| +2.5 Volts monitor |  |
| +5 Volts monitor |  |
| _ROLL_ROT | 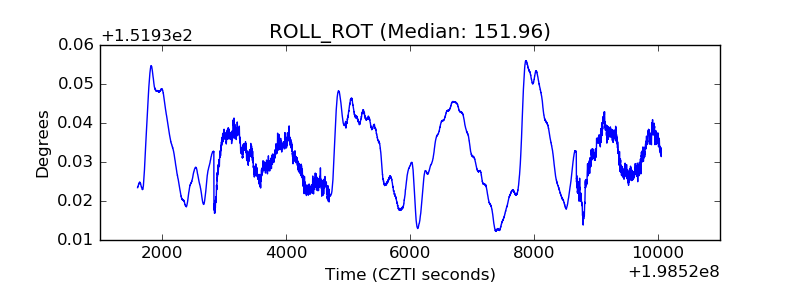 |
| _Roll_DEC | 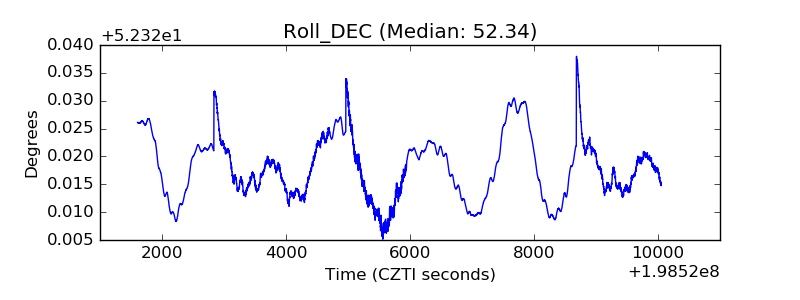 |
| _Roll_RA |  |
| Veto Counter | 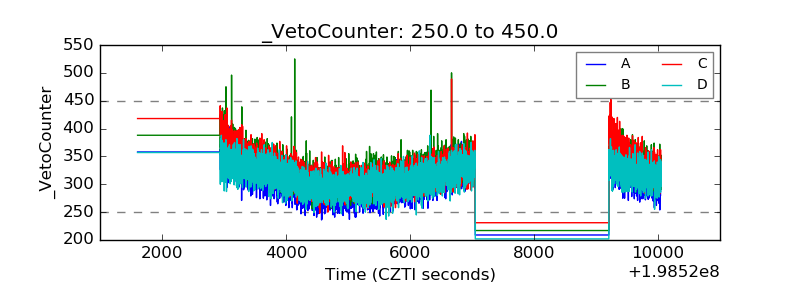 |