| Param | Original file | Final file |
|---|---|---|
| Filename | modeM0/AS1G05_238T05_9000000418_02986cztM0_level2.evt | modeM0/AS1G05_238T05_9000000418_02986cztM0_level2_quad_clean.evt |
| Size (bytes) | 351,187,200 | 48,398,400 |
| Size | 334.9 MB | 46.2 MB |
| Events in quadrant A | 3,244,247 | 273,826 |
| Events in quadrant B | 2,280,677 | 285,087 |
| Events in quadrant C | 2,119,909 | 285,387 |
| Events in quadrant D | 2,656,207 | 275,938 |
| Mode M0 | |||
|---|---|---|---|
| Quadrant | BADHDUFLAG | Total packets | Discarded packets |
| A | 0 | 13163 | 3 |
| B | 0 | 10338 | 2 |
| C | 0 | 10077 | 2 |
| D | 0 | 11516 | 2 |
| Mode M9 | |||
|---|---|---|---|
| Quadrant | BADHDUFLAG | Total packets | Discarded packets |
| A | 0 | 29 | 0 |
| B | 0 | 29 | 0 |
| C | 0 | 29 | 0 |
| D | 0 | 30 | 0 |
| Mode SS | |||
|---|---|---|---|
| Quadrant | BADHDUFLAG | Total packets | Discarded packets |
| A | 0 | 100 | 0 |
| B | 0 | 100 | 0 |
| C | 0 | 100 | 0 |
| D | 0 | 100 | 0 |
| Quadrant | Total seconds | Saturated seconds | Saturation percentage |
|---|---|---|---|
| A | 4914 | 169 | 3.439153% |
| B | 4914 | 18 | 0.366300% |
| C | 4914 | 10 | 0.203500% |
| D | 4914 | 58 | 1.180301% |
Noise dominated data is calculated using 1-second bins in cleaned event files. If a bin has >2000 counts, and if more than 50% of those come from <1% of pixels, then it is considered to be noise-dominated and hence unusable.
| Quadrant | # 1 sec bins | Bins with >0 counts | Bins with >2000 counts | High rate bins dominated by noise | Noise dominated (total time) | Noise dominated (detector-on time) | Marked lightcurve |
|---|---|---|---|---|---|---|---|
| A | 7069 | 4915 | 147 | 147 | 2.08% | 2.99% | 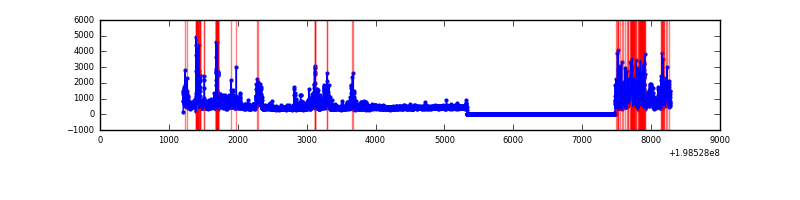 |
| B | 7069 | 4915 | 14 | 14 | 0.20% | 0.28% | 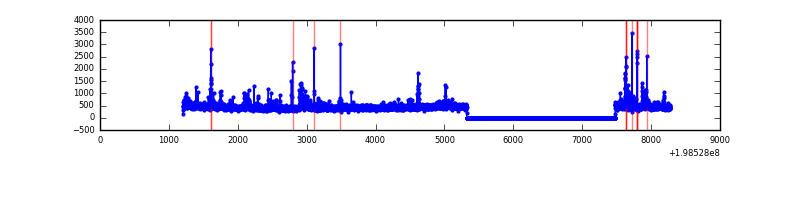 |
| C | 7069 | 4915 | 7 | 7 | 0.10% | 0.14% | 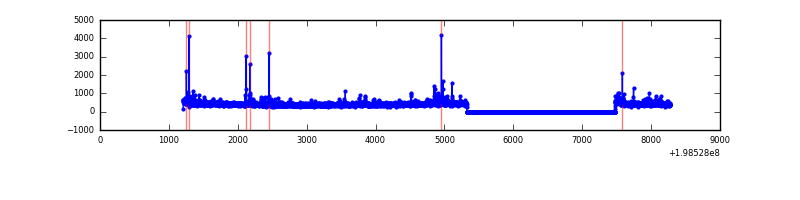 |
| D | 7069 | 4915 | 62 | 62 | 0.88% | 1.26% | 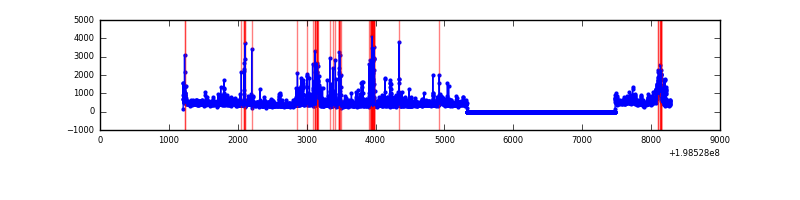 |
Top three noisy pixels from each quadrant. If the there are fewer than three noisy pixels in the level2.evt file, extra rows are filled as -1
| Pixel properties | Quadrant properties | ||||||
|---|---|---|---|---|---|---|---|
| Quadrant | DetID | PixID | Counts | Sigma | Mean | Median | Sigma |
| A | 13 | 9 | 973221 | 9530.78 | 495 | 483 | 102.1 |
| A | 0 | 50 | 163378 | 1596.03 | 495 | 483 | 102.1 |
| A | 0 | 31 | 142746 | 1393.88 | 495 | 483 | 102.1 |
| B | 0 | 219 | 89188 | 890.9 | 517 | 505 | 99.5 |
| B | 2 | 249 | 48033 | 477.46 | 517 | 505 | 99.5 |
| B | 15 | 85 | 37621 | 372.87 | 517 | 505 | 99.5 |
| C | 6 | 80 | 87260 | 734.75 | 500 | 502 | 118.1 |
| C | 1 | 16 | 22687 | 187.88 | 500 | 502 | 118.1 |
| C | 10 | 21 | 10650 | 85.94 | 500 | 502 | 118.1 |
| D | 13 | 114 | 166630 | 1260.19 | 489 | 477 | 131.8 |
| D | 13 | 239 | 117236 | 885.56 | 489 | 477 | 131.8 |
| D | 9 | 35 | 114194 | 862.49 | 489 | 477 | 131.8 |
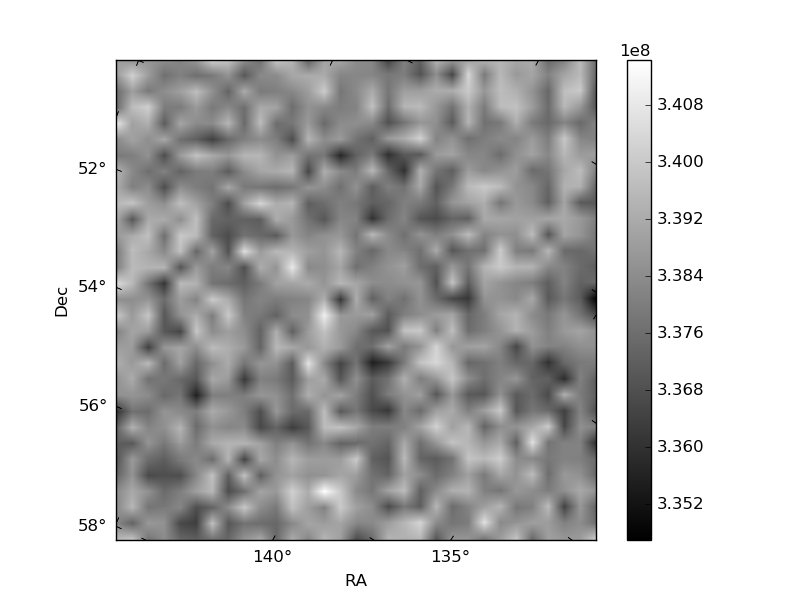
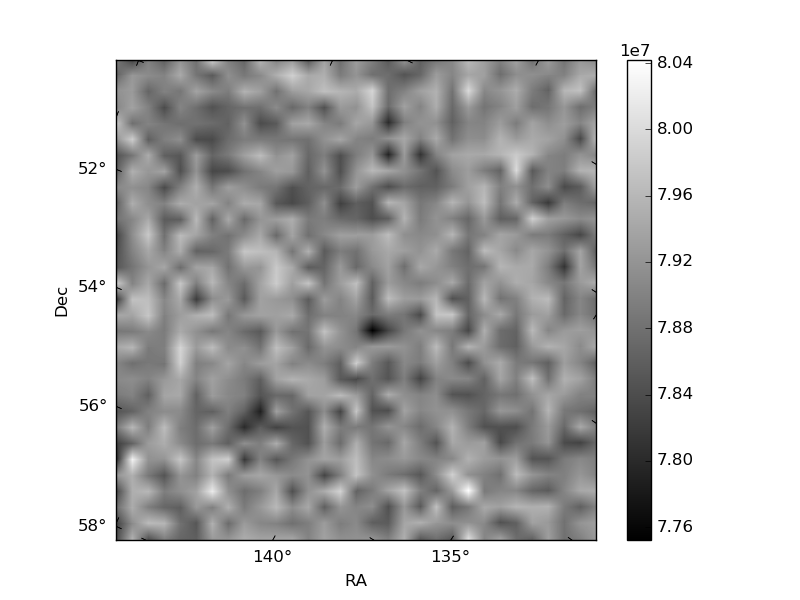
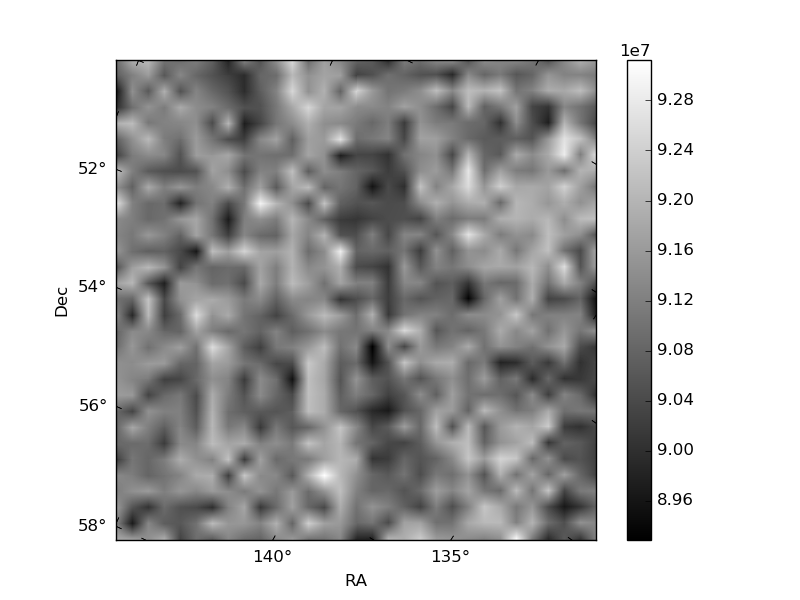
Histogram calculated using DETX and DETY for each event in the final _common_clean file
| Quadrant A | 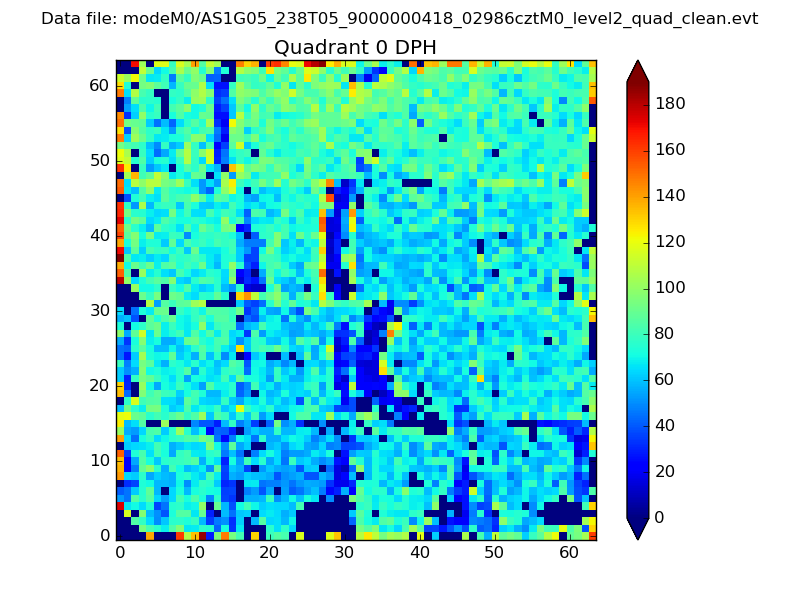 |
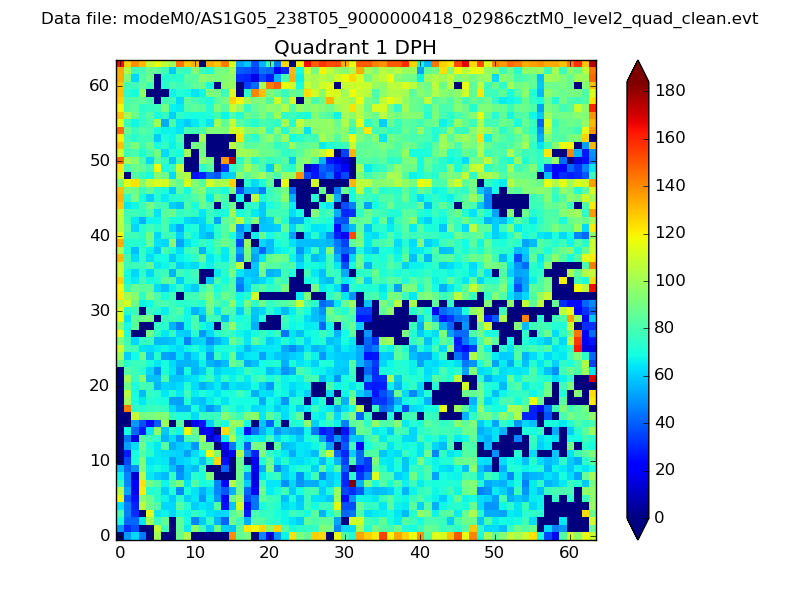 |
Quadrant B |
|---|---|---|---|
| Quadrant D | 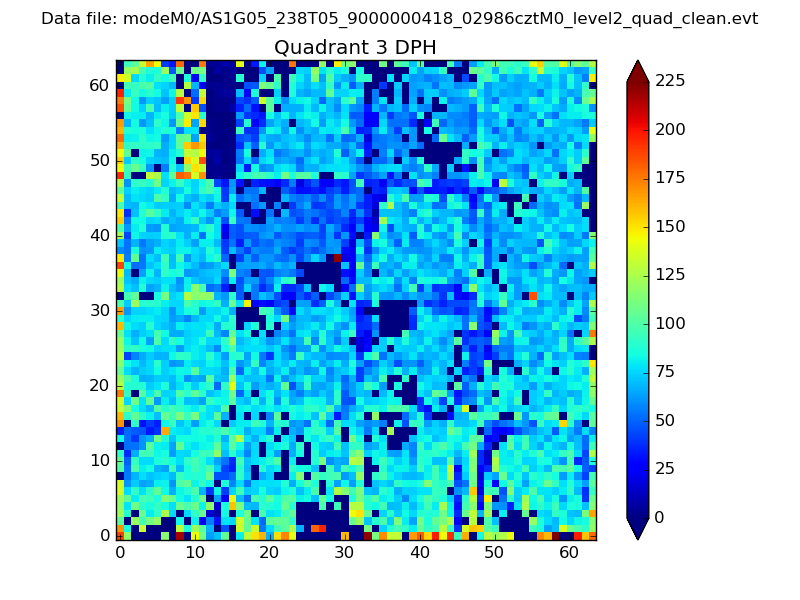 |
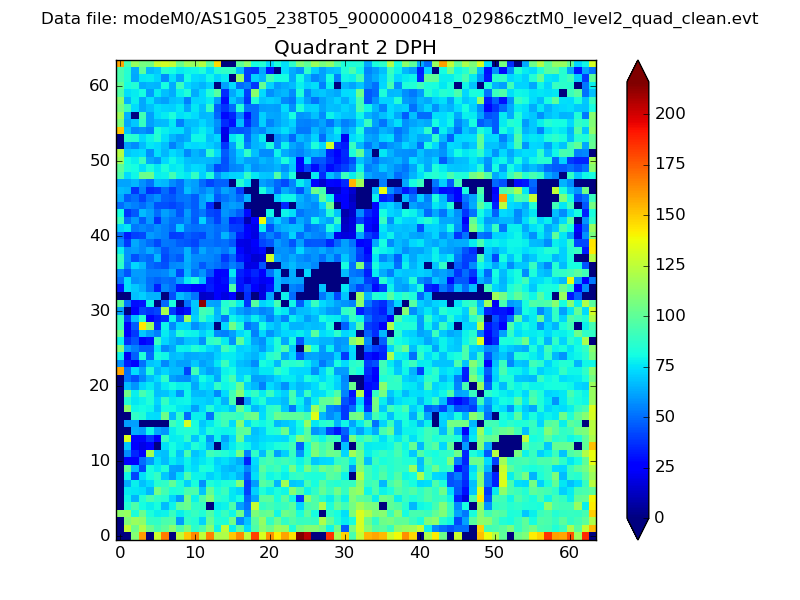 |
Quadrant C |
| Plot type | Count rate plots | Images |
|---|---|---|
| Comparison with Poisson distribution Blue bars denote a histogram of data divided into 1 sec bins. Red curve is a Poisson curve with rate = median count rate of data. |
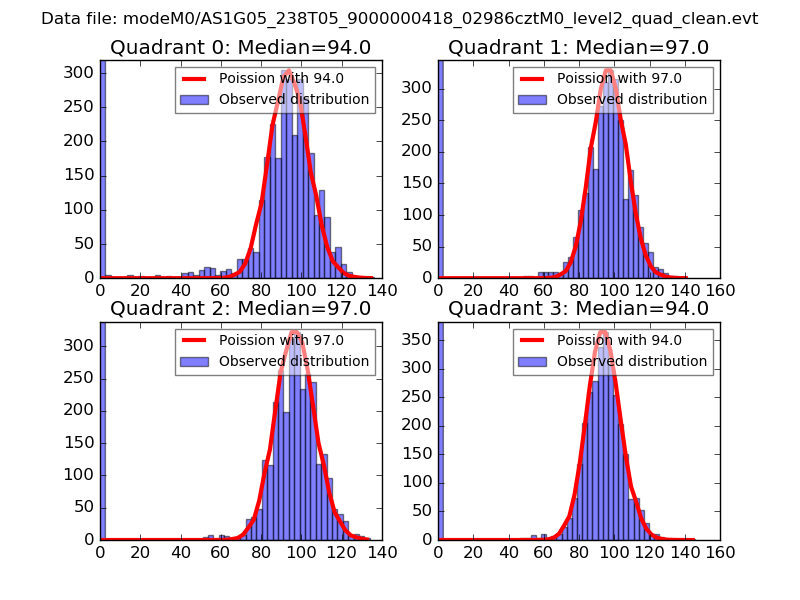 |
 |
| Quadrant-wise count rates Data is divided into 100 sec bins |
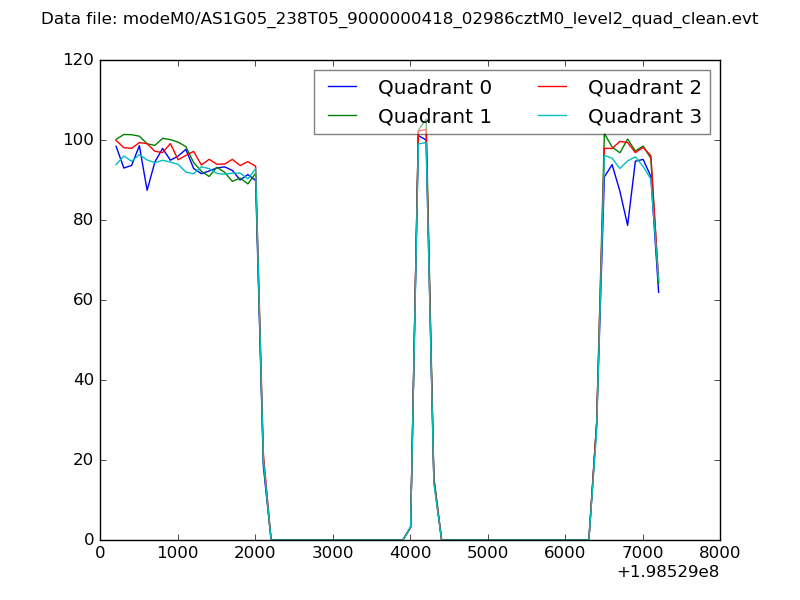 |
|
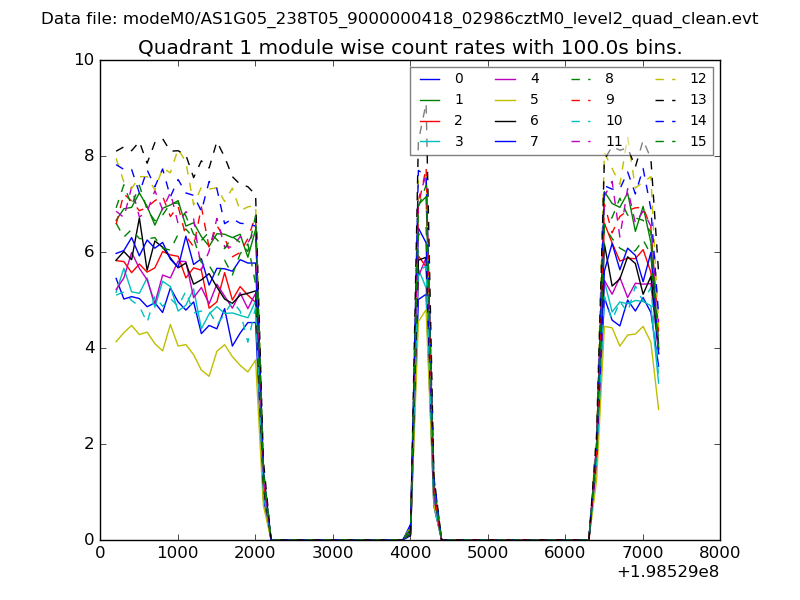
| Module-wise count rates for Quadrant A Data is divided into 100 sec bins |
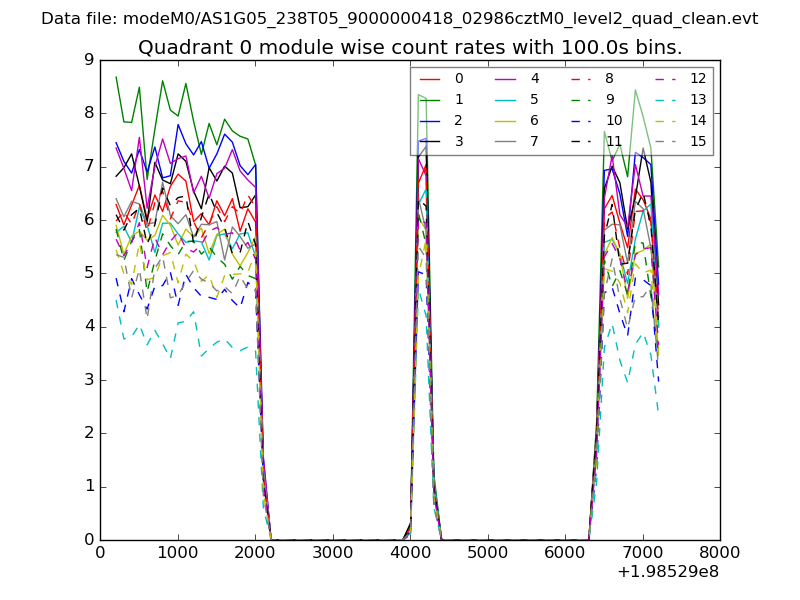 |
 |
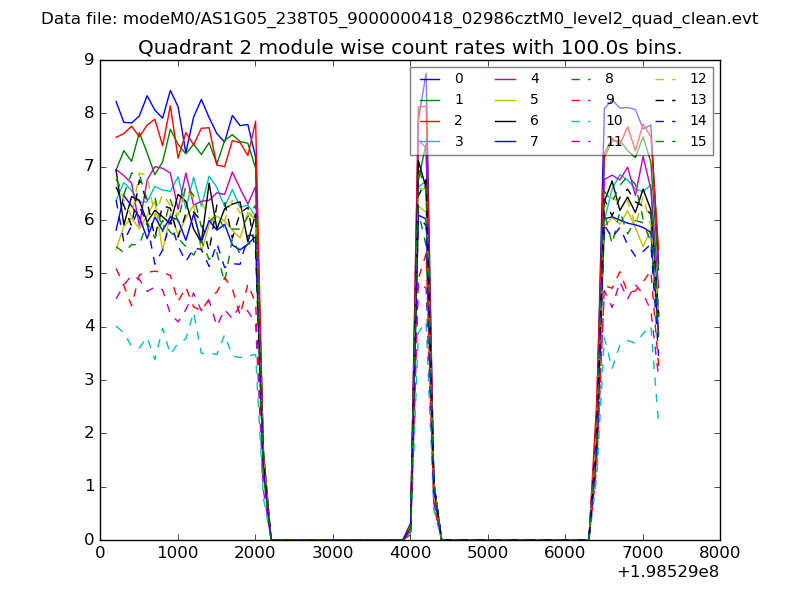
| Module-wise count rates for Quadrant B Data is divided into 100 sec bins |
 |
 |
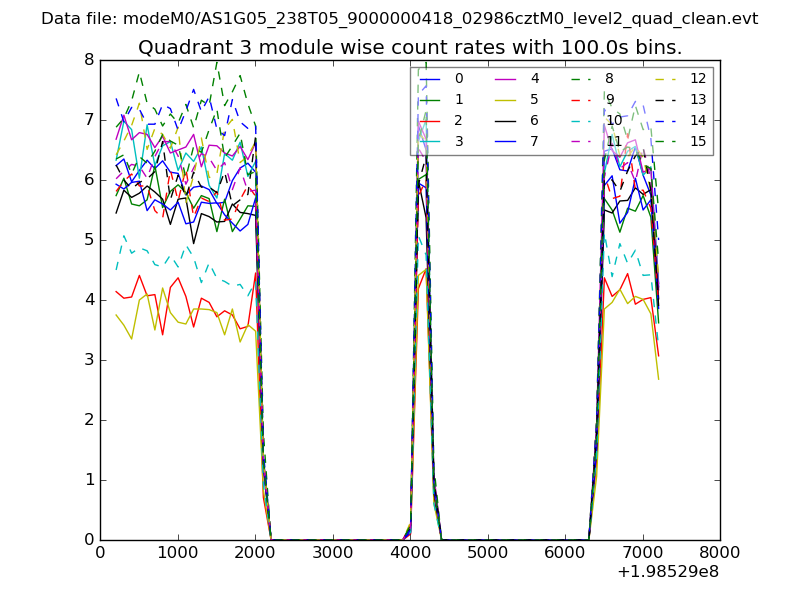
| Module-wise count rates for Quadrant C Data is divided into 100 sec bins |
 |
 |
| Module-wise count rates for Quadrant D Data is divided into 100 sec bins |
 |
 |
| Parameter | Plot |
|---|---|
| CZT HV Monitor | 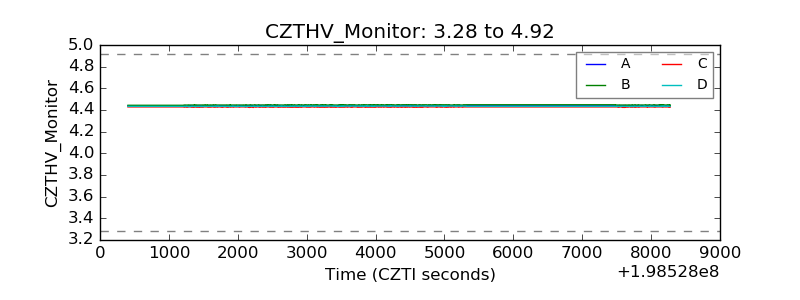 |
| D_VDD | 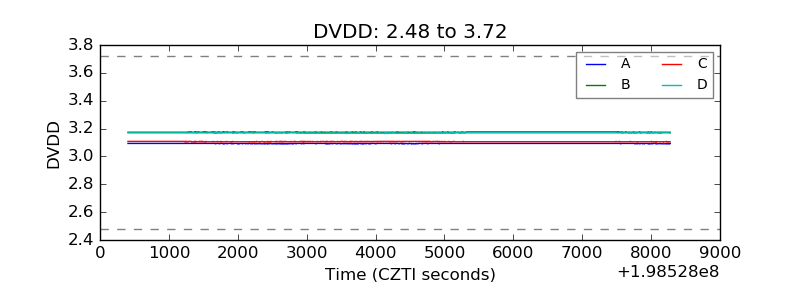 |
| Temperature 1 | 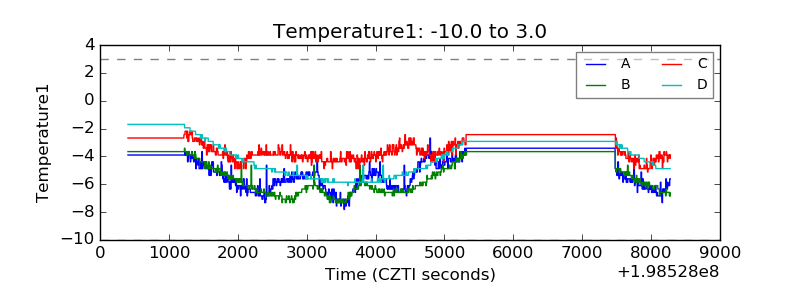 |
| Veto HV Monitor | 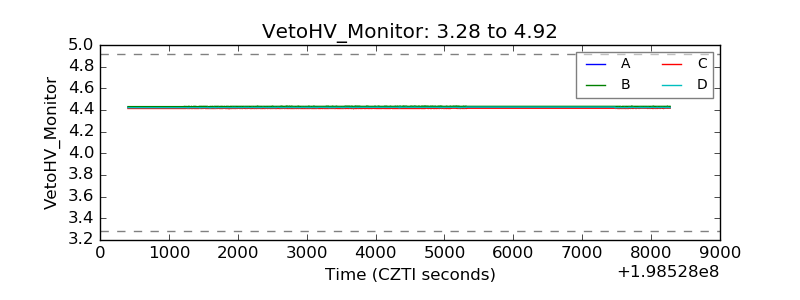 |
| Veto LLD | 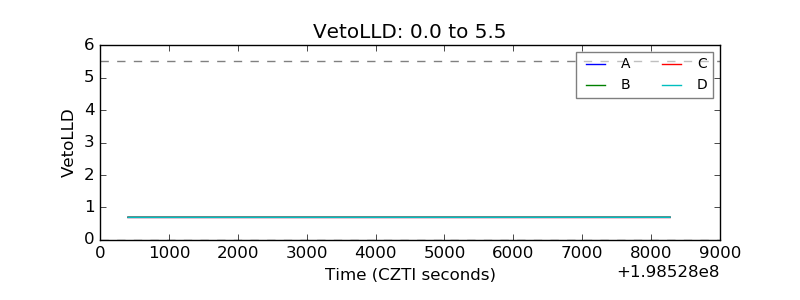 |
| Alpha Counter | 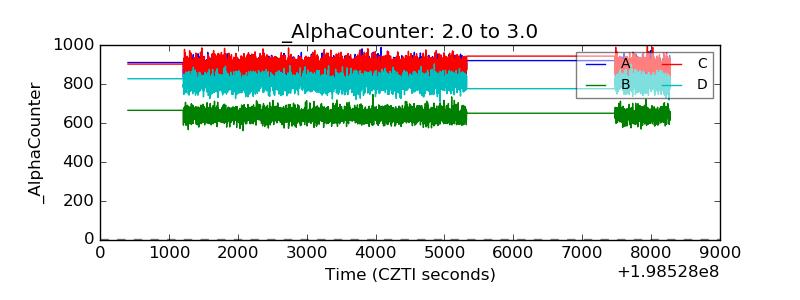 |
| _CPM_Rate | 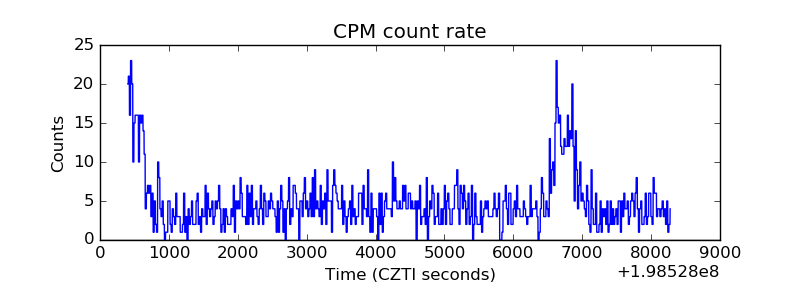 |
| CZT Counter | 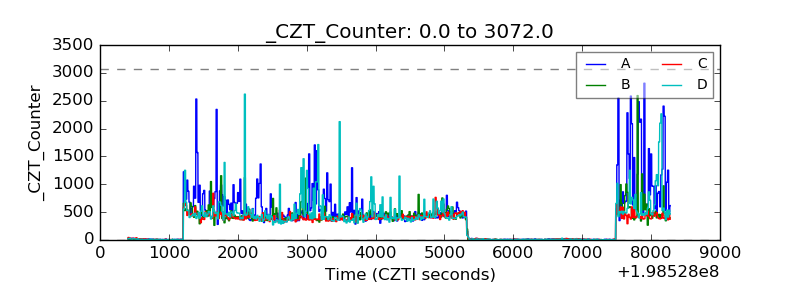 |
| +2.5 Volts monitor | 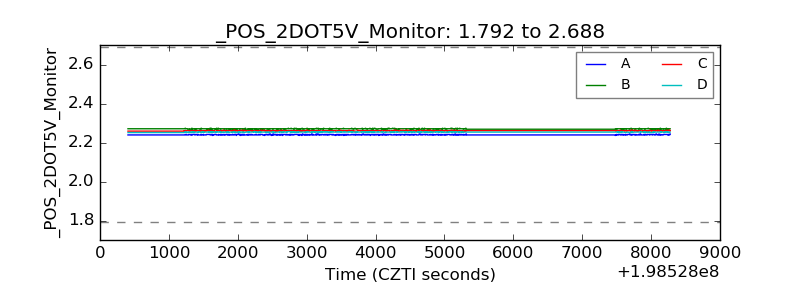 |
| +5 Volts monitor |  |
| _ROLL_ROT | 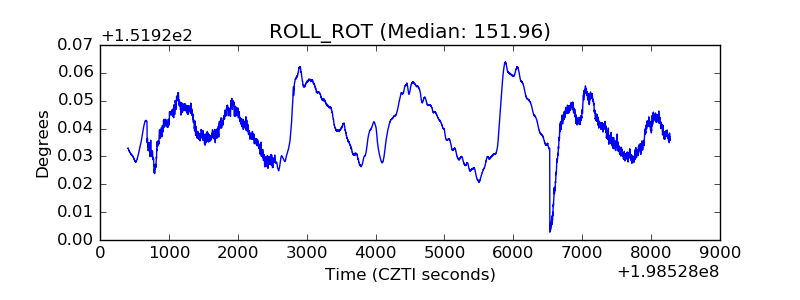 |
| _Roll_DEC | 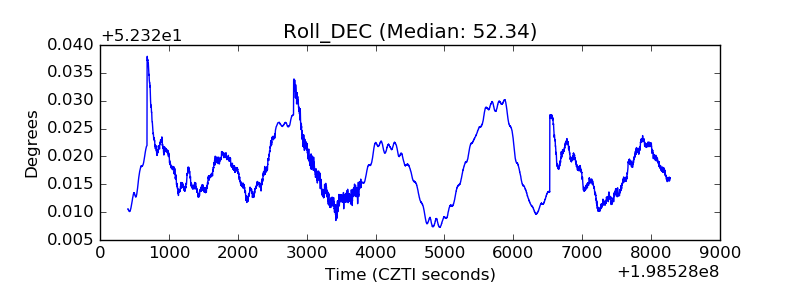 |
| _Roll_RA | 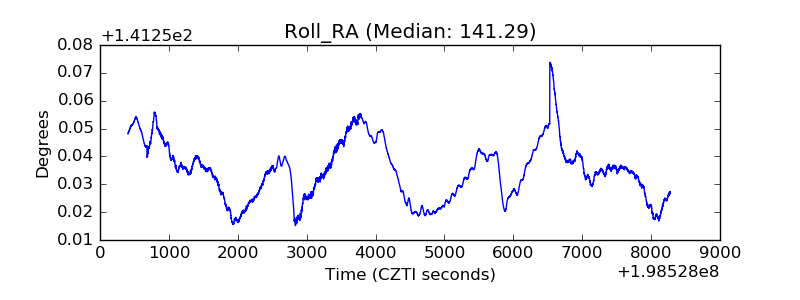 |
| Veto Counter | 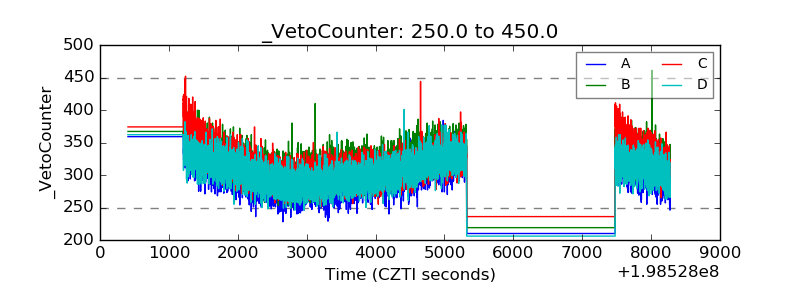 |