| Param | Original file | Final file |
|---|---|---|
| Filename | modeM0/AS1G05_238T05_9000000418_02987cztM0_level2.evt | modeM0/AS1G05_238T05_9000000418_02987cztM0_level2_quad_clean.evt |
| Size (bytes) | 373,129,920 | 51,742,080 |
| Size | 355.8 MB | 49.3 MB |
| Events in quadrant A | 3,653,869 | 295,695 |
| Events in quadrant B | 2,431,896 | 305,708 |
| Events in quadrant C | 2,259,328 | 306,306 |
| Events in quadrant D | 2,604,896 | 298,049 |
| Mode M0 | |||
|---|---|---|---|
| Quadrant | BADHDUFLAG | Total packets | Discarded packets |
| A | 0 | 14414 | 3 |
| B | 0 | 11018 | 2 |
| C | 0 | 10696 | 2 |
| D | 0 | 11529 | 2 |
| Mode M9 | |||
|---|---|---|---|
| Quadrant | BADHDUFLAG | Total packets | Discarded packets |
| A | 0 | 35 | 0 |
| B | 0 | 35 | 0 |
| C | 0 | 35 | 0 |
| D | 0 | 36 | 0 |
| Mode SS | |||
|---|---|---|---|
| Quadrant | BADHDUFLAG | Total packets | Discarded packets |
| A | 0 | 104 | 0 |
| B | 0 | 104 | 0 |
| C | 0 | 104 | 0 |
| D | 0 | 104 | 0 |
| Quadrant | Total seconds | Saturated seconds | Saturation percentage |
|---|---|---|---|
| A | 5148 | 163 | 3.166278% |
| B | 5148 | 41 | 0.796426% |
| C | 5148 | 28 | 0.543901% |
| D | 5148 | 24 | 0.466200% |
Noise dominated data is calculated using 1-second bins in cleaned event files. If a bin has >2000 counts, and if more than 50% of those come from <1% of pixels, then it is considered to be noise-dominated and hence unusable.
| Quadrant | # 1 sec bins | Bins with >0 counts | Bins with >2000 counts | High rate bins dominated by noise | Noise dominated (total time) | Noise dominated (detector-on time) | Marked lightcurve |
|---|---|---|---|---|---|---|---|
| A | 7302 | 5149 | 144 | 144 | 1.97% | 2.80% | 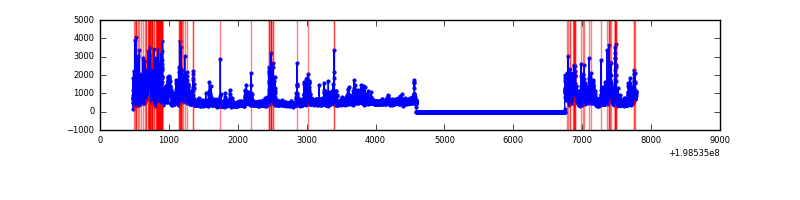 |
| B | 7302 | 5149 | 34 | 34 | 0.47% | 0.66% | 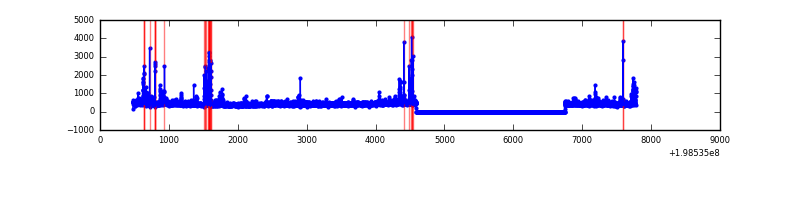 |
| C | 7302 | 5149 | 23 | 23 | 0.31% | 0.45% | 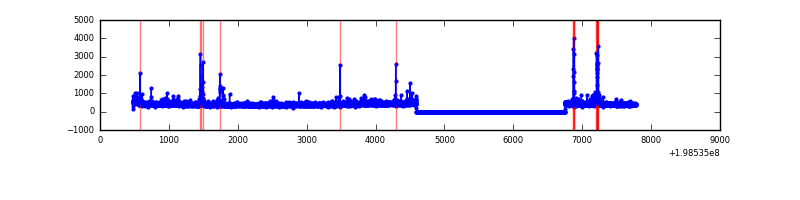 |
| D | 7302 | 5149 | 24 | 24 | 0.33% | 0.47% | 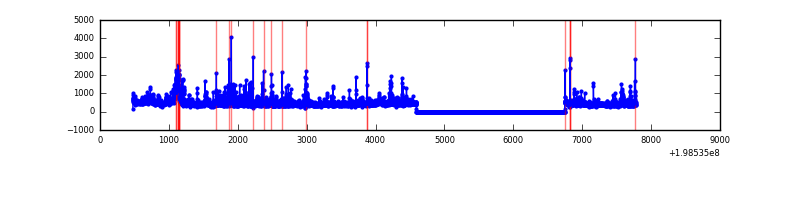 |
Top three noisy pixels from each quadrant. If the there are fewer than three noisy pixels in the level2.evt file, extra rows are filled as -1
| Pixel properties | Quadrant properties | ||||||
|---|---|---|---|---|---|---|---|
| Quadrant | DetID | PixID | Counts | Sigma | Mean | Median | Sigma |
| A | 13 | 9 | 1205214 | 11261.64 | 521 | 509 | 107.0 |
| A | 0 | 31 | 180888 | 1686.19 | 521 | 509 | 107.0 |
| A | 12 | 247 | 131178 | 1221.5 | 521 | 509 | 107.0 |
| B | 0 | 219 | 118622 | 1128.6 | 541 | 528 | 104.6 |
| B | 2 | 249 | 99446 | 945.34 | 541 | 528 | 104.6 |
| B | 14 | 50 | 40136 | 378.53 | 541 | 528 | 104.6 |
| C | 6 | 80 | 94423 | 759.69 | 522 | 524 | 123.6 |
| C | 10 | 21 | 36584 | 291.74 | 522 | 524 | 123.6 |
| C | 15 | 208 | 35625 | 283.98 | 522 | 524 | 123.6 |
| D | 13 | 114 | 136323 | 1083.68 | 513 | 498 | 125.3 |
| D | 9 | 35 | 135729 | 1078.94 | 513 | 498 | 125.3 |
| D | 12 | 17 | 116465 | 925.24 | 513 | 498 | 125.3 |
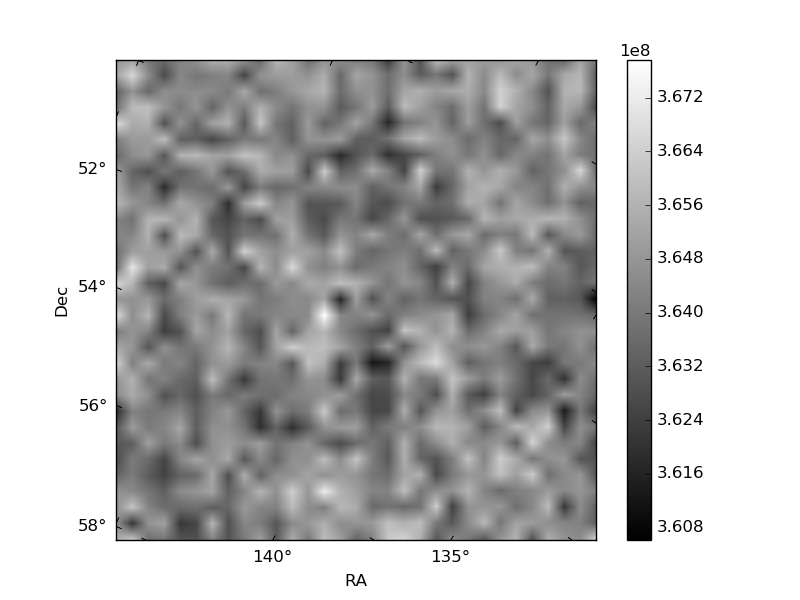
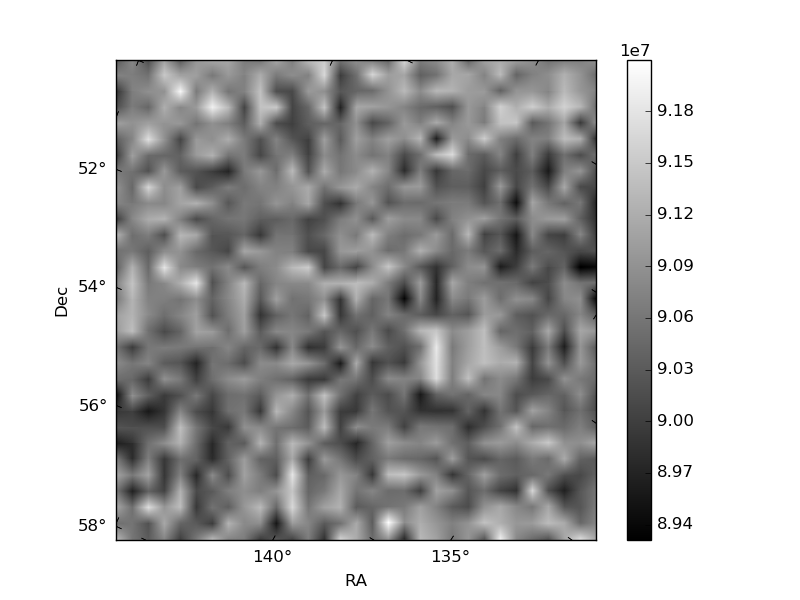
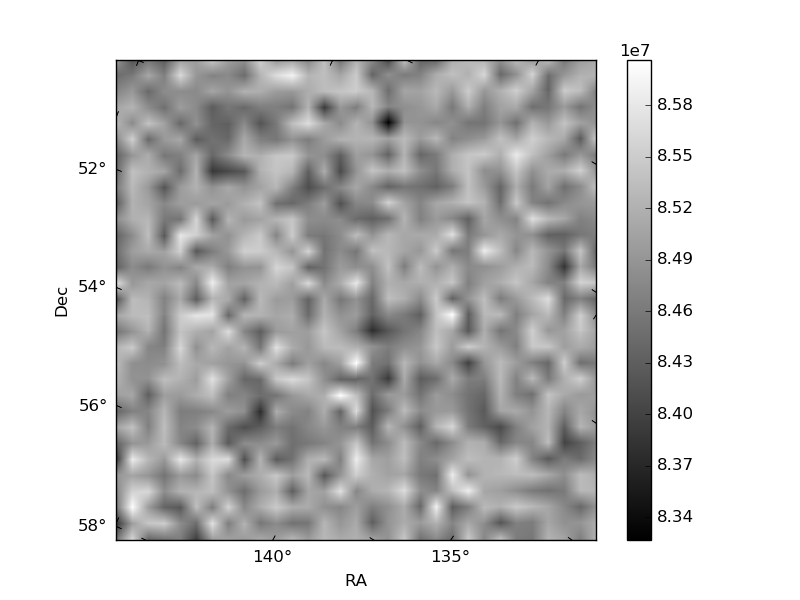
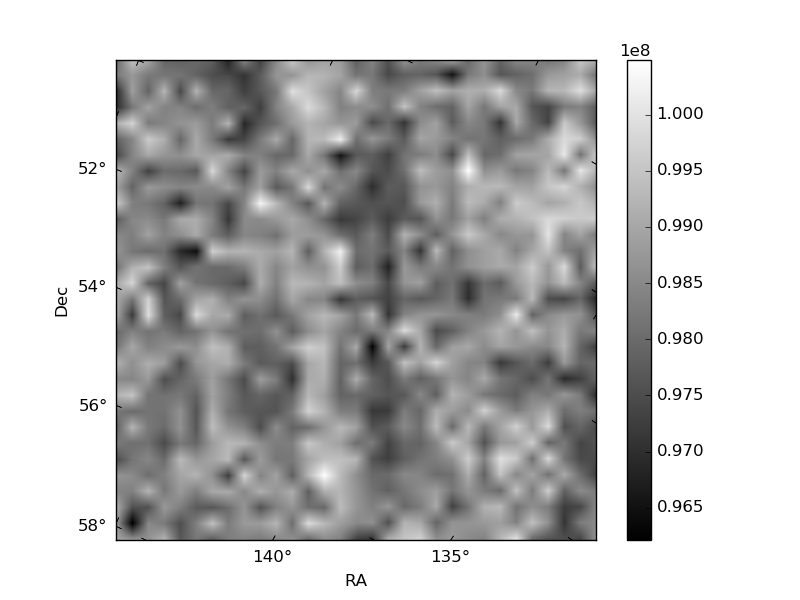
Histogram calculated using DETX and DETY for each event in the final _common_clean file
| Quadrant A | 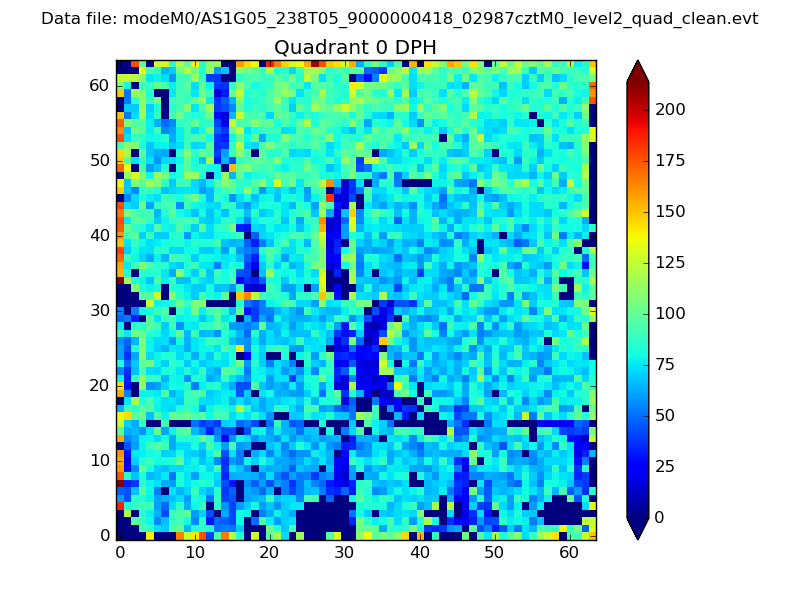 |
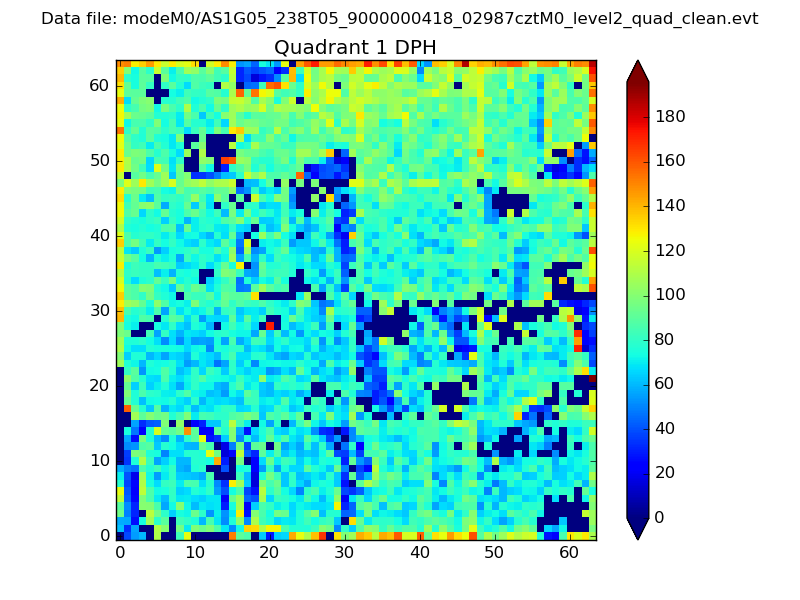 |
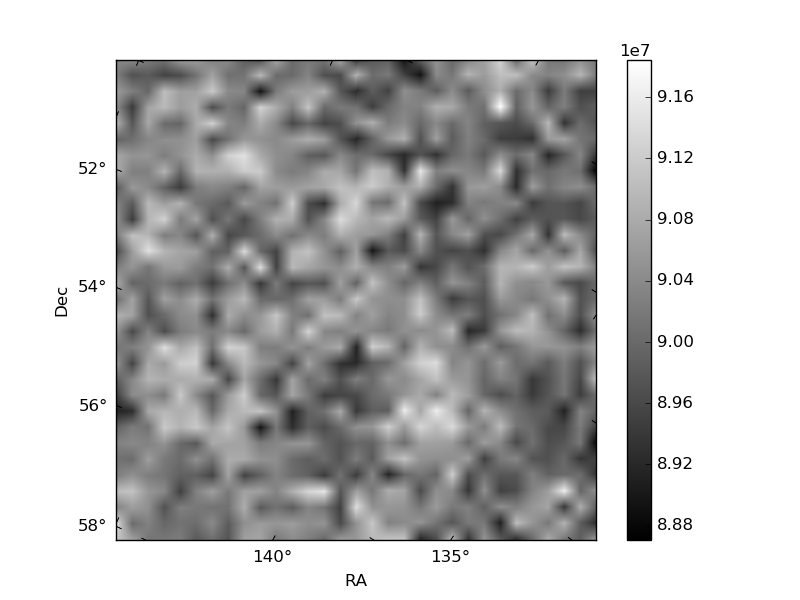
Quadrant B |
|---|---|---|---|
| Quadrant D | 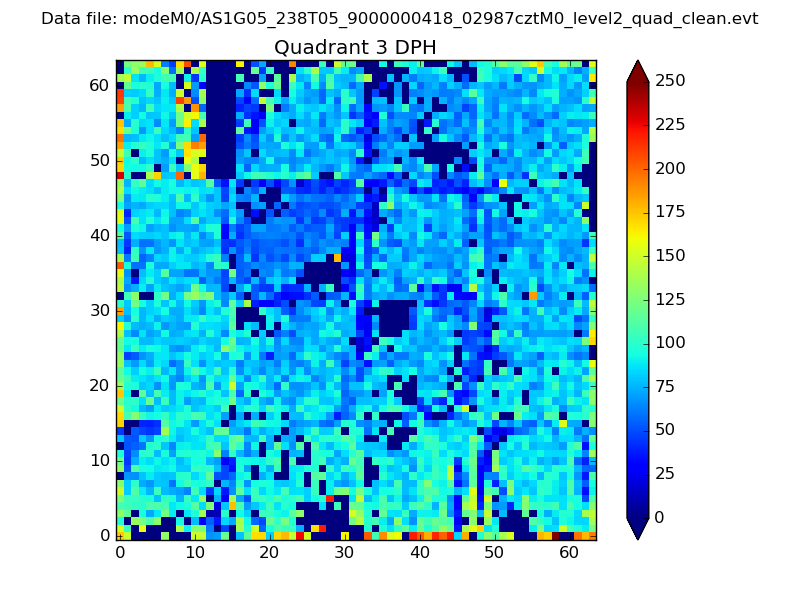 |
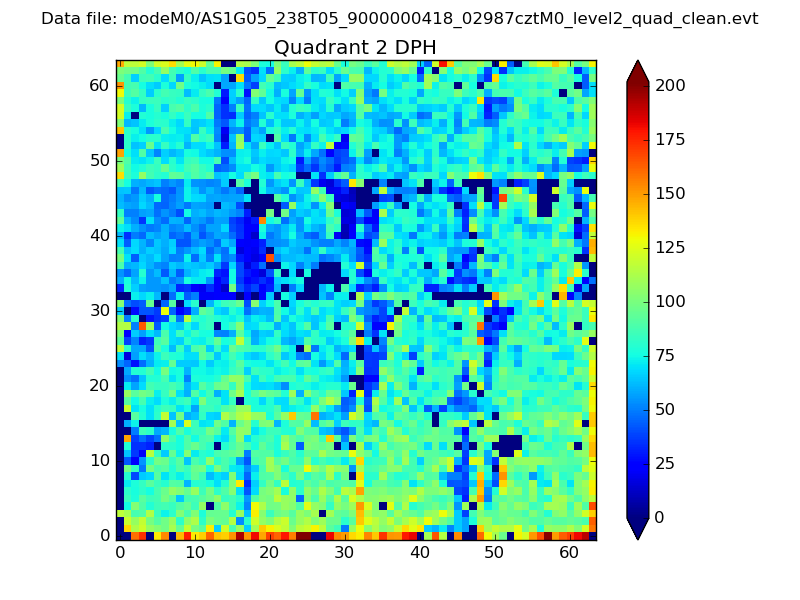 |
Quadrant C |
| Plot type | Count rate plots | Images |
|---|---|---|
| Comparison with Poisson distribution Blue bars denote a histogram of data divided into 1 sec bins. Red curve is a Poisson curve with rate = median count rate of data. |
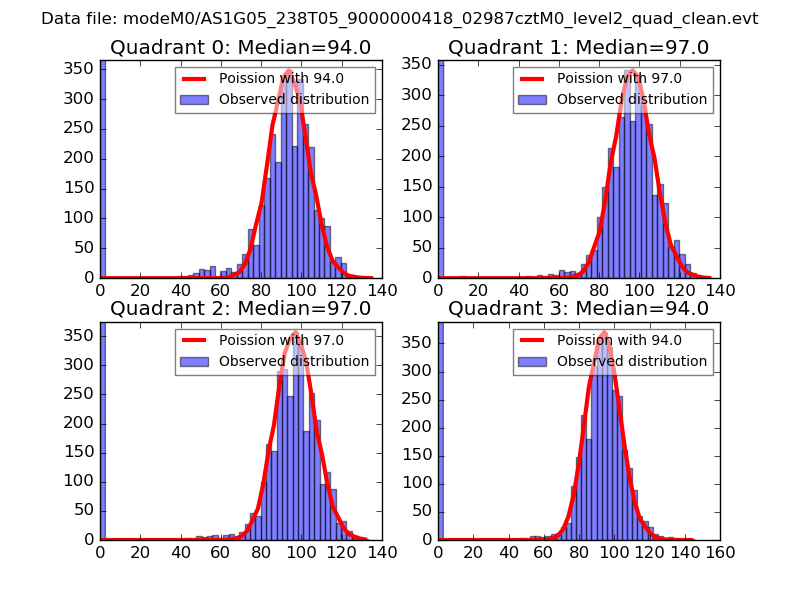 |
 |
| Quadrant-wise count rates Data is divided into 100 sec bins |
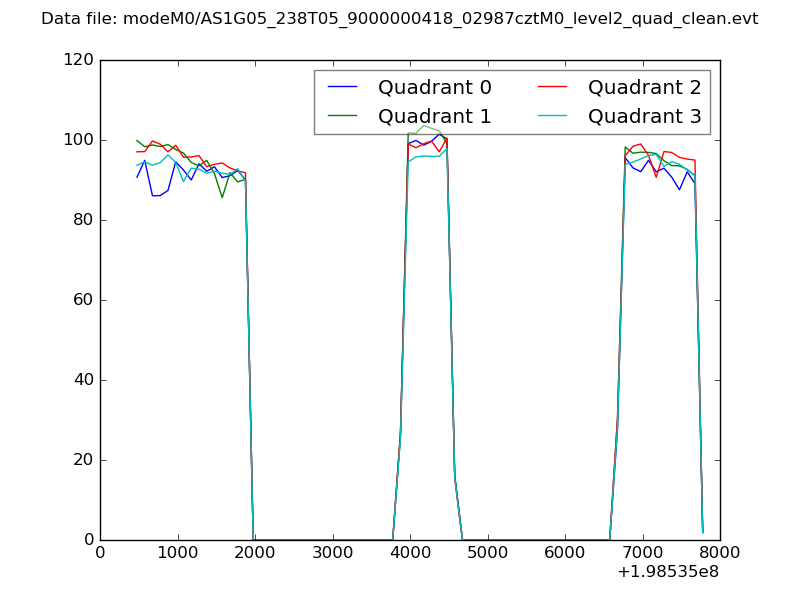 |
|
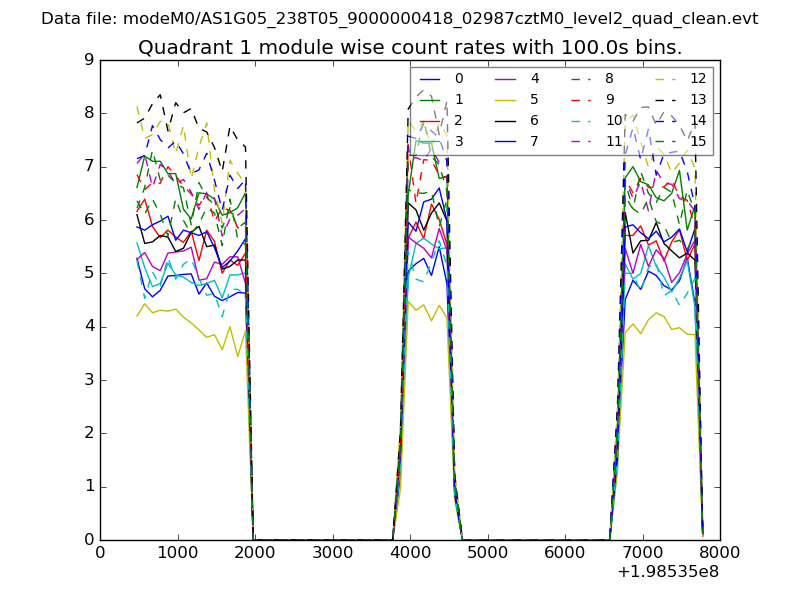
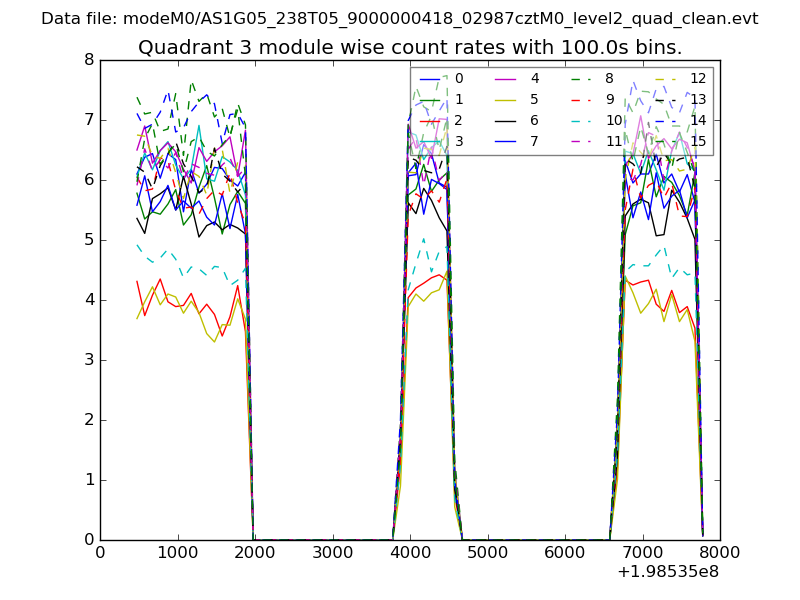
| Module-wise count rates for Quadrant A Data is divided into 100 sec bins |
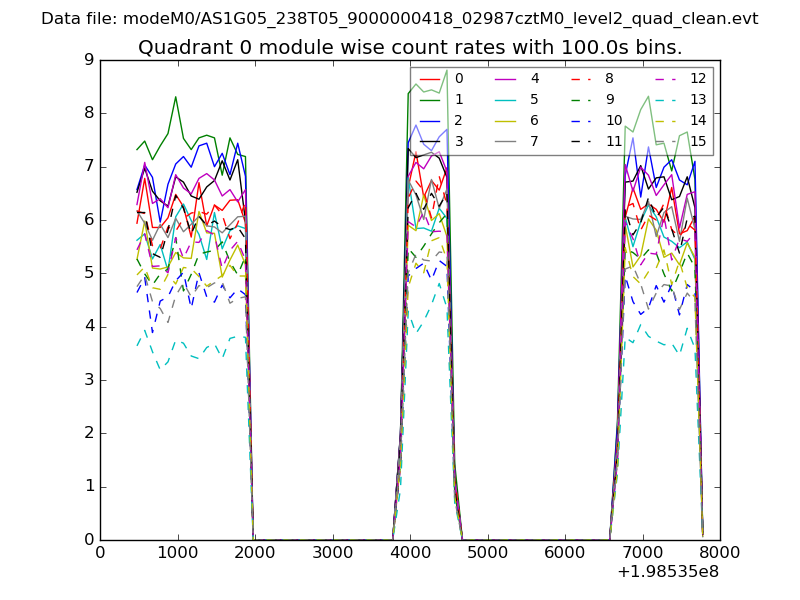 |
 |
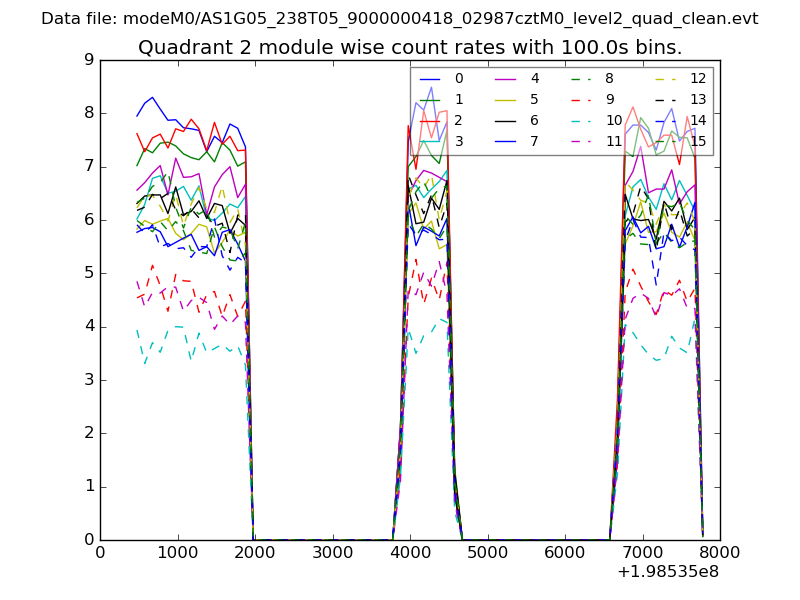
| Module-wise count rates for Quadrant B Data is divided into 100 sec bins |
 |
 |
| Module-wise count rates for Quadrant C Data is divided into 100 sec bins |
 |
 |
| Module-wise count rates for Quadrant D Data is divided into 100 sec bins |
 |
 |
| Parameter | Plot |
|---|---|
| CZT HV Monitor | 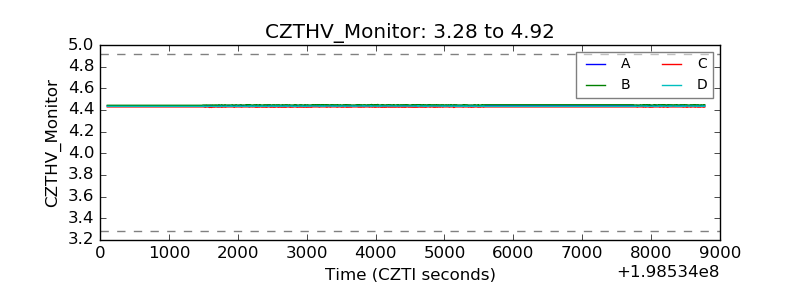 |
| D_VDD | 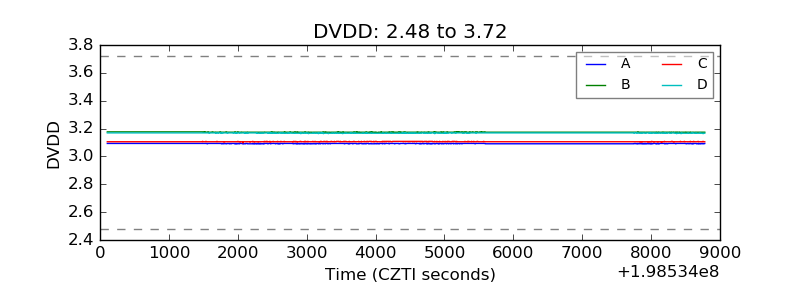 |
| Temperature 1 | 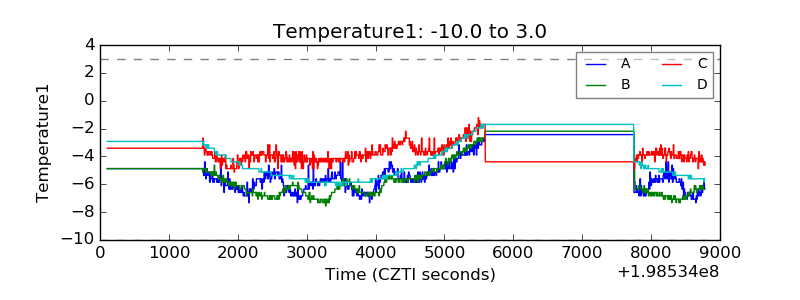 |
| Veto HV Monitor | 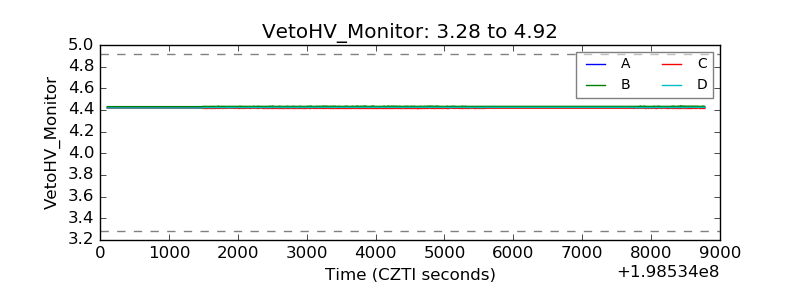 |
| Veto LLD | 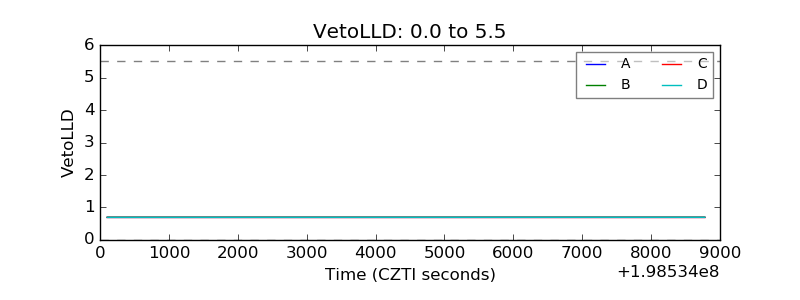 |
| Alpha Counter | 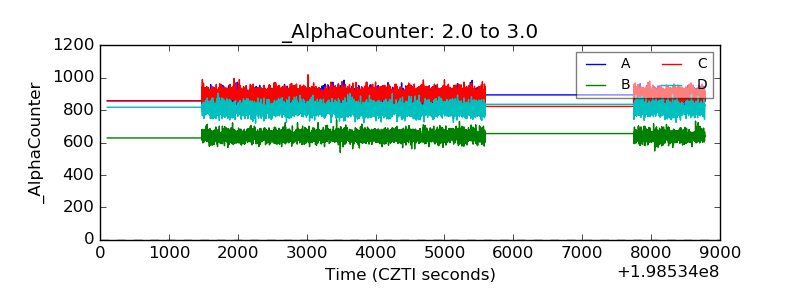 |
| _CPM_Rate | 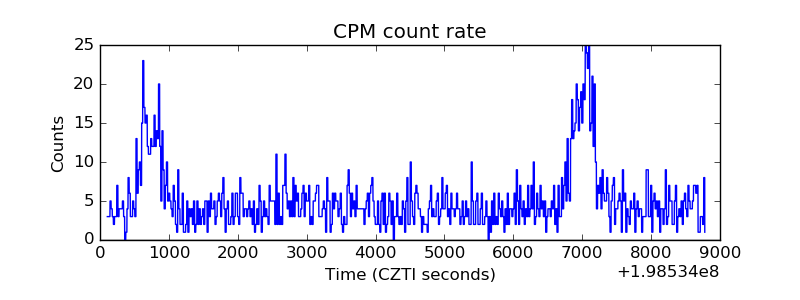 |
| CZT Counter | 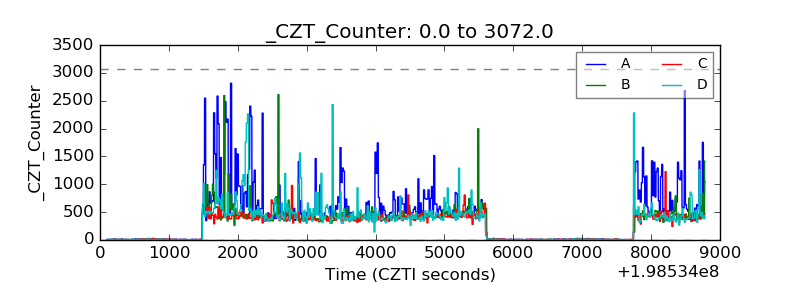 |
| +2.5 Volts monitor |  |
| +5 Volts monitor |  |
| _ROLL_ROT | 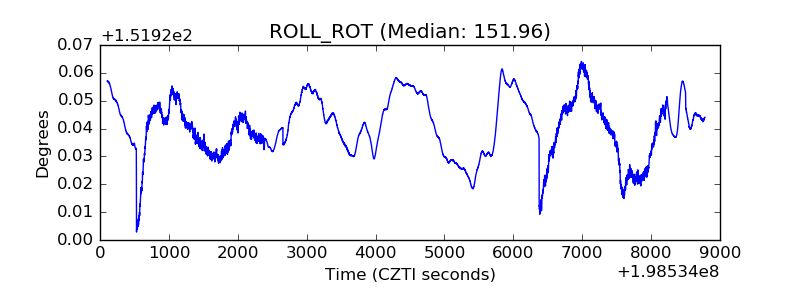 |
| _Roll_DEC |  |
| _Roll_RA | 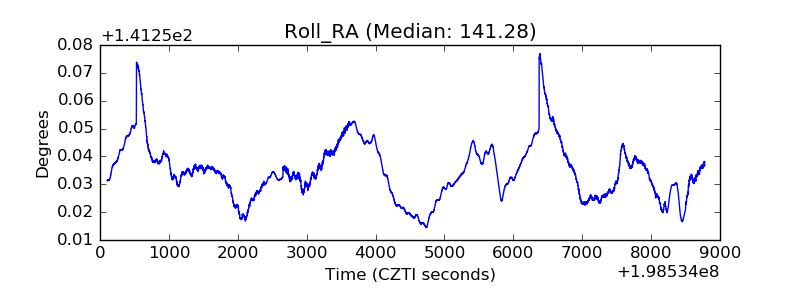 |
| Veto Counter | 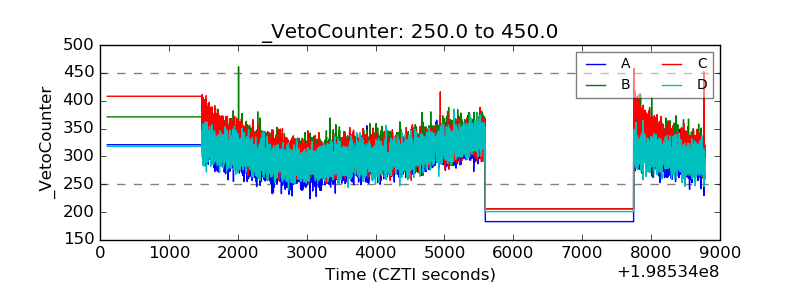 |