| Param | Original file | Final file |
|---|---|---|
| Filename | modeM0/AS1G05_238T05_9000000418_02990cztM0_level2.evt | modeM0/AS1G05_238T05_9000000418_02990cztM0_level2_quad_clean.evt |
| Size (bytes) | 922,256,640 | 112,530,240 |
| Size | 879.5 MB | 107.3 MB |
| Events in quadrant A | 8,202,212 | 618,479 |
| Events in quadrant B | 6,574,644 | 632,503 |
| Events in quadrant C | 5,794,639 | 624,266 |
| Events in quadrant D | 6,446,945 | 601,284 |
| Mode M0 | |||
|---|---|---|---|
| Quadrant | BADHDUFLAG | Total packets | Discarded packets |
| A | 0 | 33733 | 5 |
| B | 0 | 29268 | 4 |
| C | 0 | 27586 | 4 |
| D | 0 | 29659 | 4 |
| Mode M9 | |||
|---|---|---|---|
| Quadrant | BADHDUFLAG | Total packets | Discarded packets |
| A | 0 | 85 | 0 |
| B | 0 | 85 | 0 |
| C | 0 | 85 | 0 |
| D | 0 | 86 | 0 |
| Mode SS | |||
|---|---|---|---|
| Quadrant | BADHDUFLAG | Total packets | Discarded packets |
| A | 0 | 274 | 0 |
| B | 0 | 274 | 0 |
| C | 0 | 274 | 0 |
| D | 0 | 274 | 0 |
| Quadrant | Total seconds | Saturated seconds | Saturation percentage |
|---|---|---|---|
| A | 13479 | 246 | 1.825061% |
| B | 13479 | 148 | 1.098004% |
| C | 13479 | 38 | 0.281920% |
| D | 13479 | 198 | 1.468952% |
Noise dominated data is calculated using 1-second bins in cleaned event files. If a bin has >2000 counts, and if more than 50% of those come from <1% of pixels, then it is considered to be noise-dominated and hence unusable.
| Quadrant | # 1 sec bins | Bins with >0 counts | Bins with >2000 counts | High rate bins dominated by noise | Noise dominated (total time) | Noise dominated (detector-on time) | Marked lightcurve |
|---|---|---|---|---|---|---|---|
| A | 19944 | 13482 | 193 | 193 | 0.97% | 1.43% | 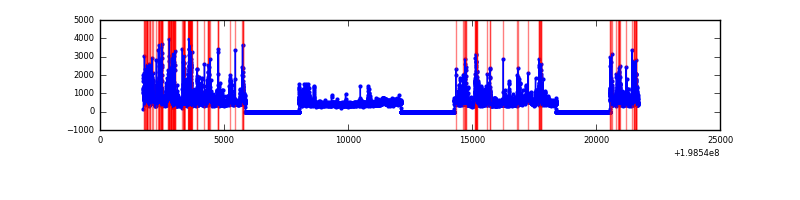 |
| B | 19944 | 13482 | 109 | 109 | 0.55% | 0.81% | 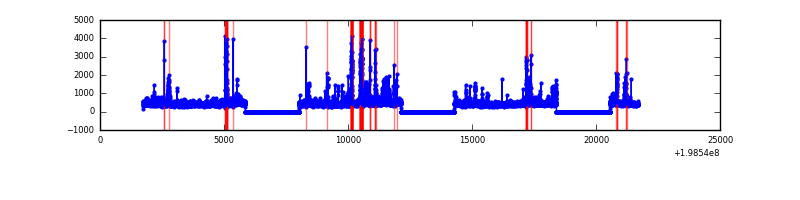 |
| C | 19944 | 13482 | 31 | 31 | 0.16% | 0.23% | 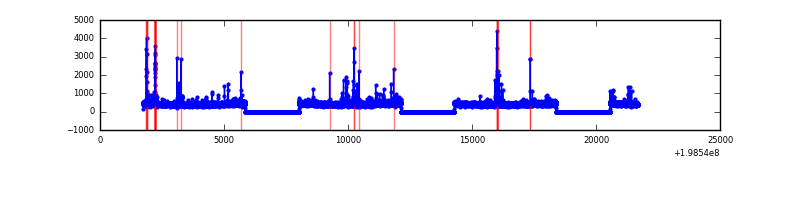 |
| D | 19944 | 13482 | 177 | 177 | 0.89% | 1.31% | 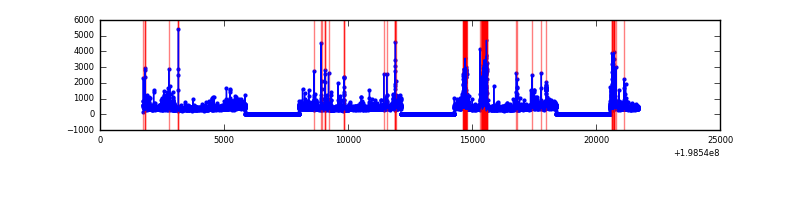 |
Top three noisy pixels from each quadrant. If the there are fewer than three noisy pixels in the level2.evt file, extra rows are filled as -1
| Pixel properties | Quadrant properties | ||||||
|---|---|---|---|---|---|---|---|
| Quadrant | DetID | PixID | Counts | Sigma | Mean | Median | Sigma |
| A | 13 | 9 | 2466068 | 8633.77 | 1411 | 1380 | 285.5 |
| A | 0 | 31 | 44572 | 151.3 | 1411 | 1380 | 285.5 |
| A | 8 | 15 | 37153 | 125.31 | 1411 | 1380 | 285.5 |
| B | 2 | 249 | 313523 | 1104.33 | 1455 | 1424 | 282.6 |
| B | 0 | 219 | 189267 | 664.66 | 1455 | 1424 | 282.6 |
| B | 4 | 81 | 122272 | 427.61 | 1455 | 1424 | 282.6 |
| C | 6 | 80 | 172701 | 531.09 | 1383 | 1388 | 322.6 |
| C | 1 | 192 | 67402 | 204.65 | 1383 | 1388 | 322.6 |
| C | 15 | 208 | 59772 | 181.0 | 1383 | 1388 | 322.6 |
| D | 5 | 239 | 357796 | 1060.09 | 1368 | 1327 | 336.3 |
| D | 7 | 223 | 148362 | 437.26 | 1368 | 1327 | 336.3 |
| D | 13 | 239 | 104972 | 308.23 | 1368 | 1327 | 336.3 |
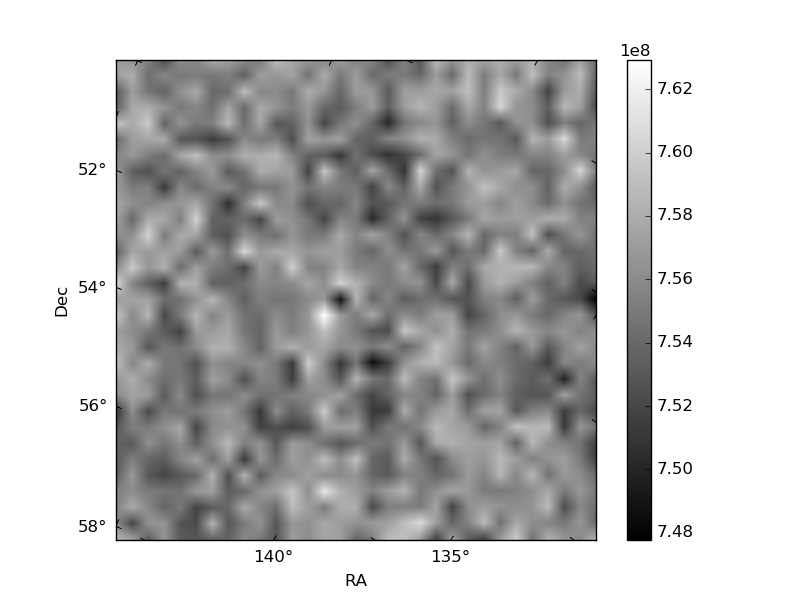
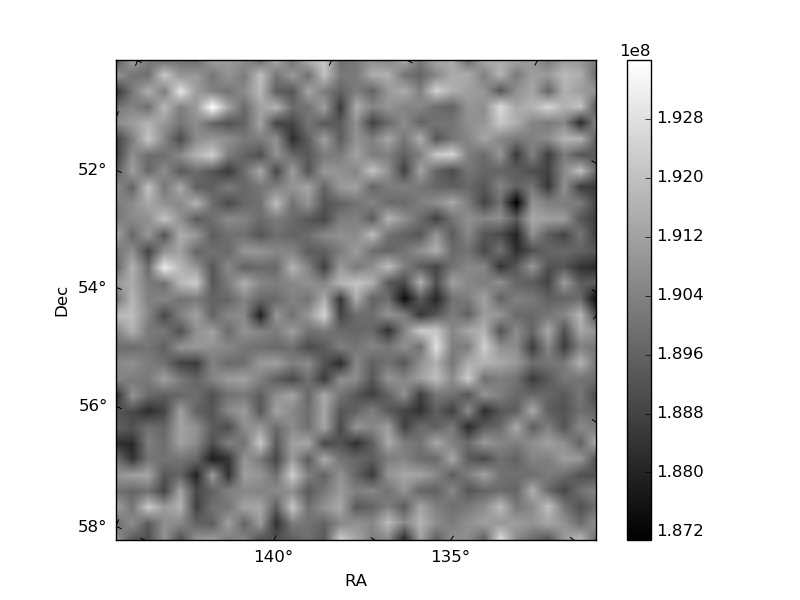
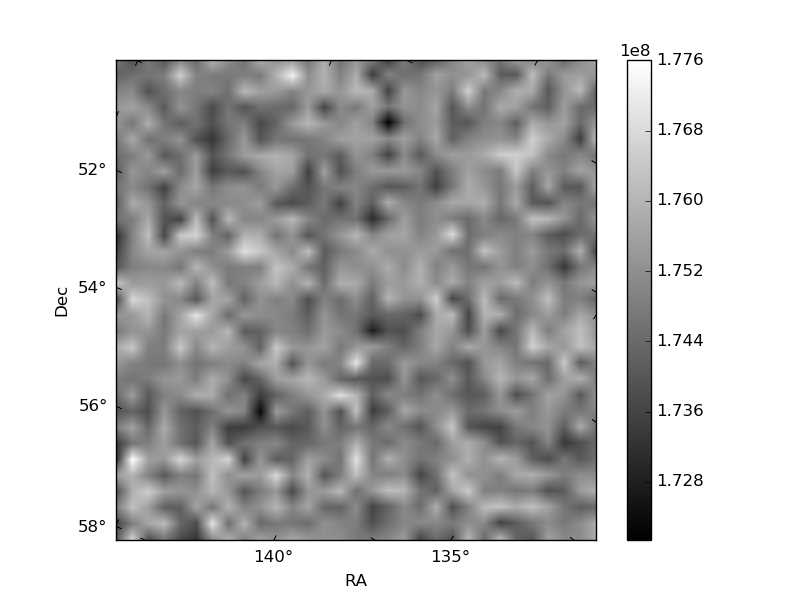
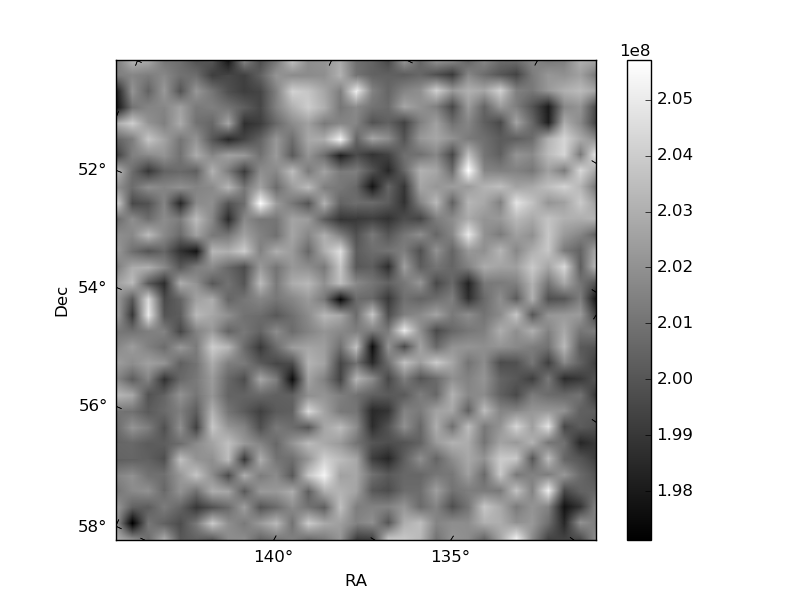
Histogram calculated using DETX and DETY for each event in the final _common_clean file
| Quadrant A | 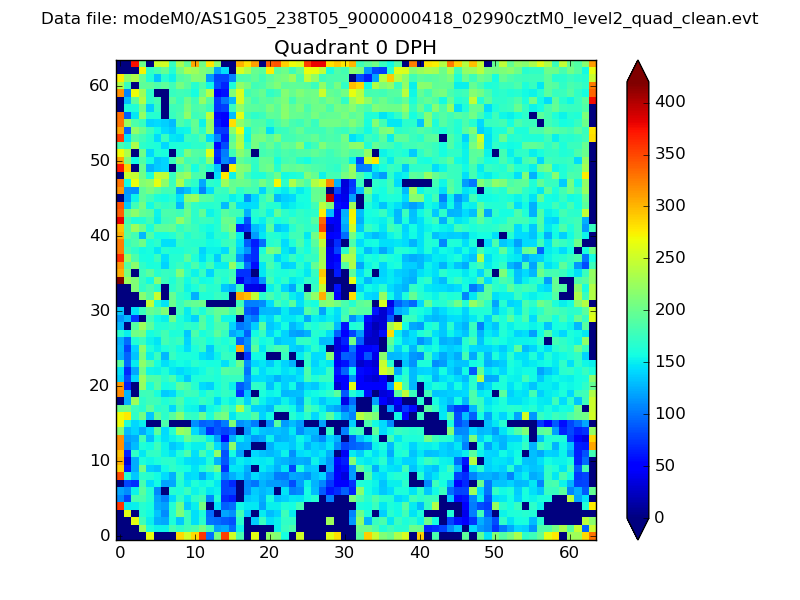 |
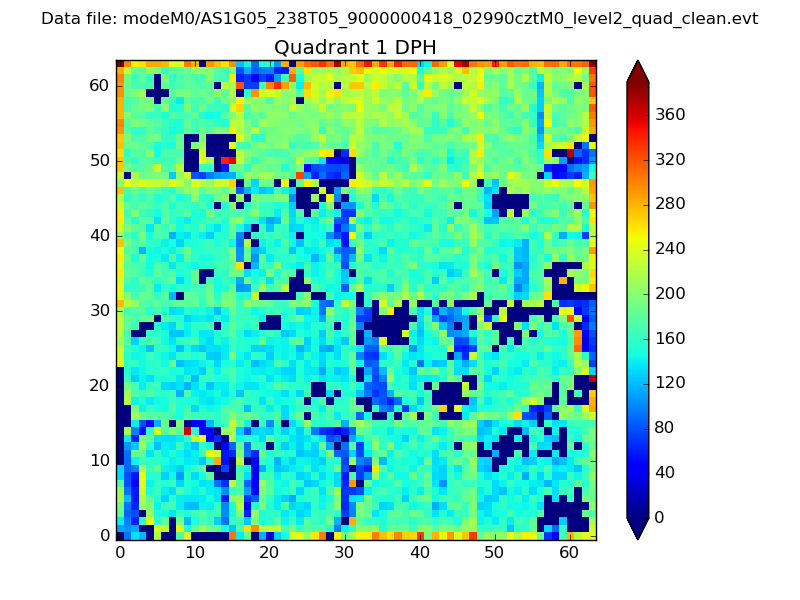 |
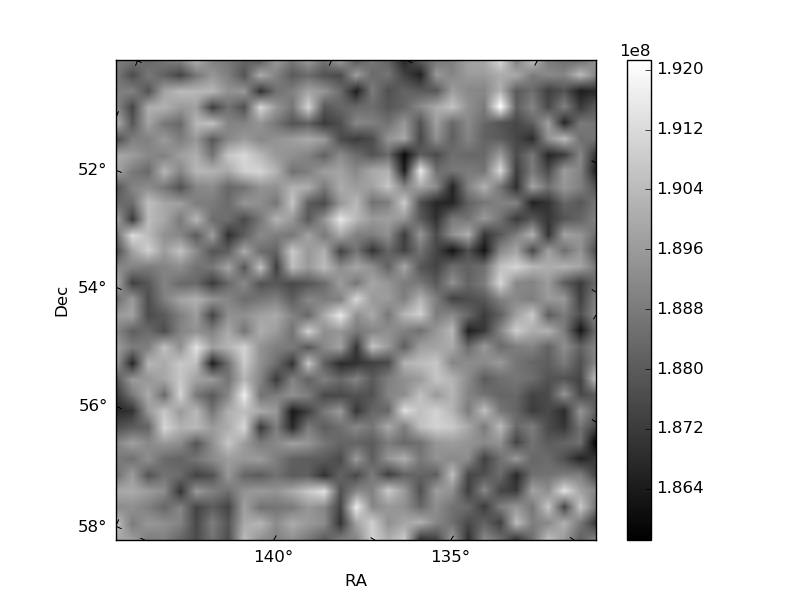
Quadrant B |
|---|---|---|---|
| Quadrant D | 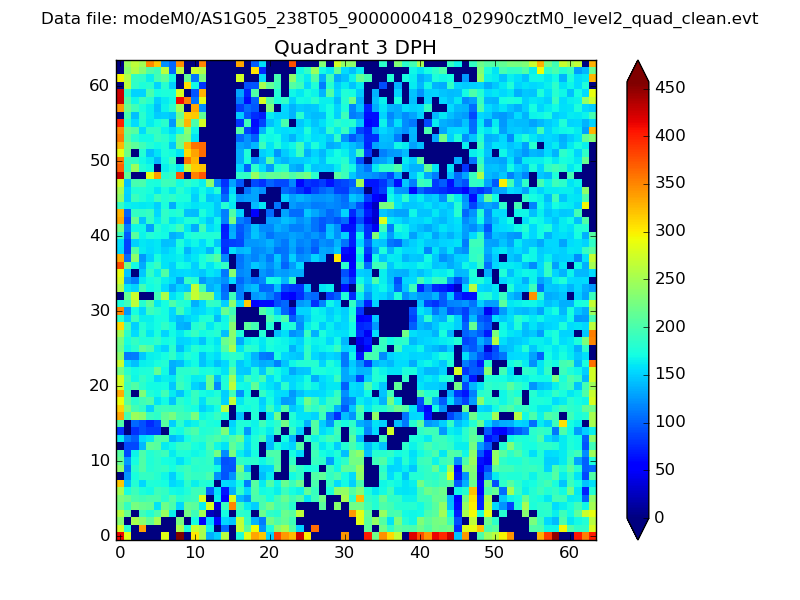 |
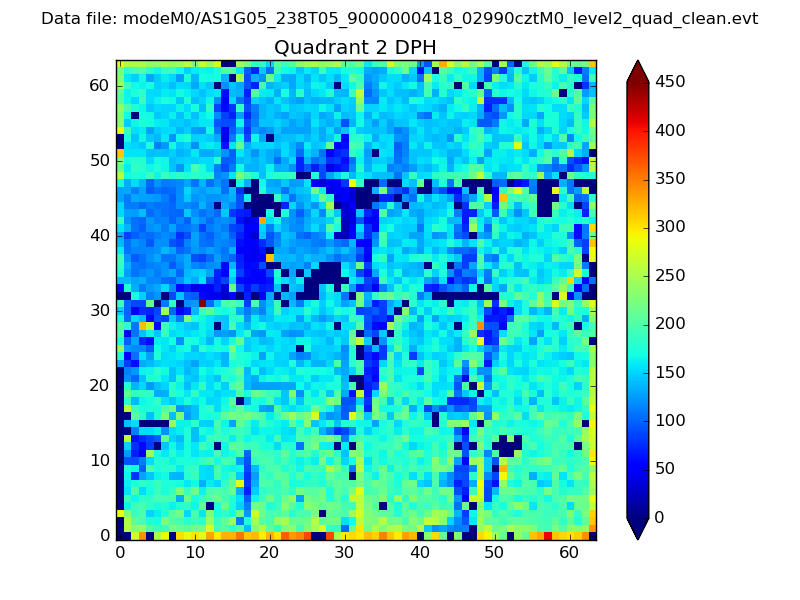 |
Quadrant C |
| Plot type | Count rate plots | Images |
|---|---|---|
| Comparison with Poisson distribution Blue bars denote a histogram of data divided into 1 sec bins. Red curve is a Poisson curve with rate = median count rate of data. |
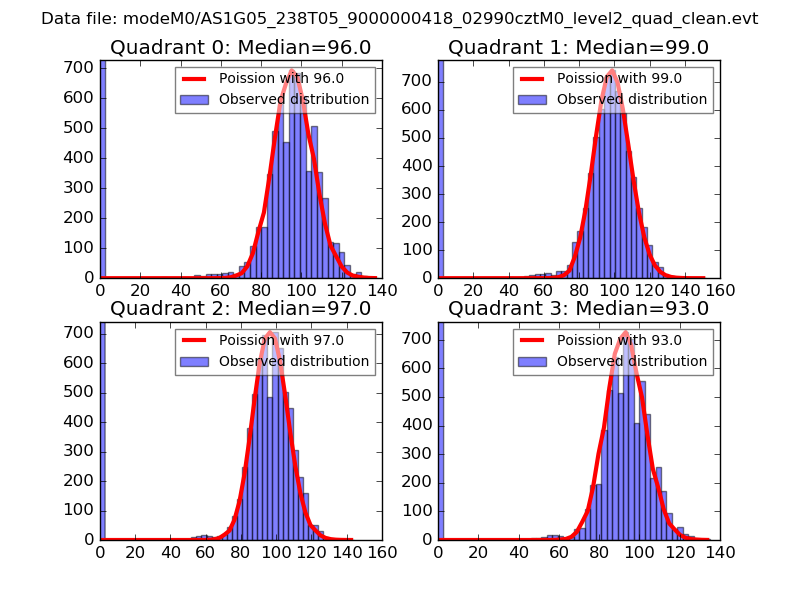 |
 |
| Quadrant-wise count rates Data is divided into 100 sec bins |
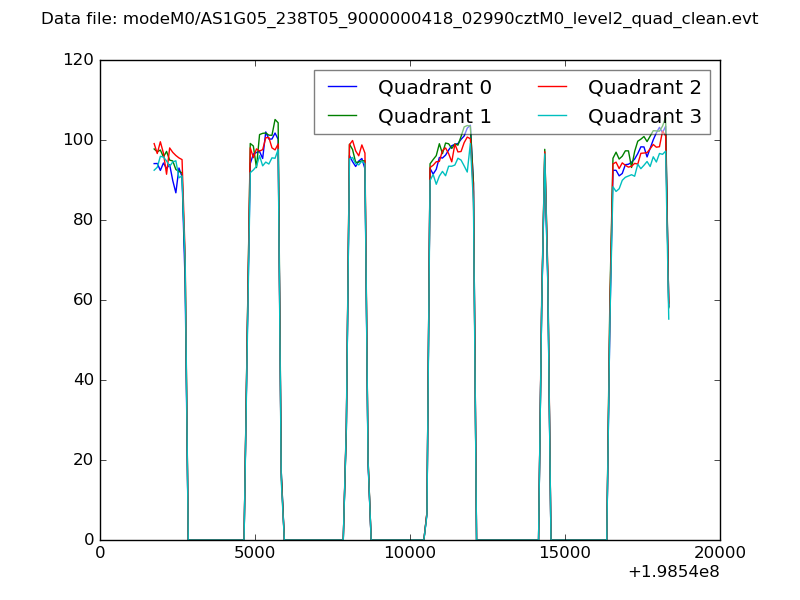 |
|
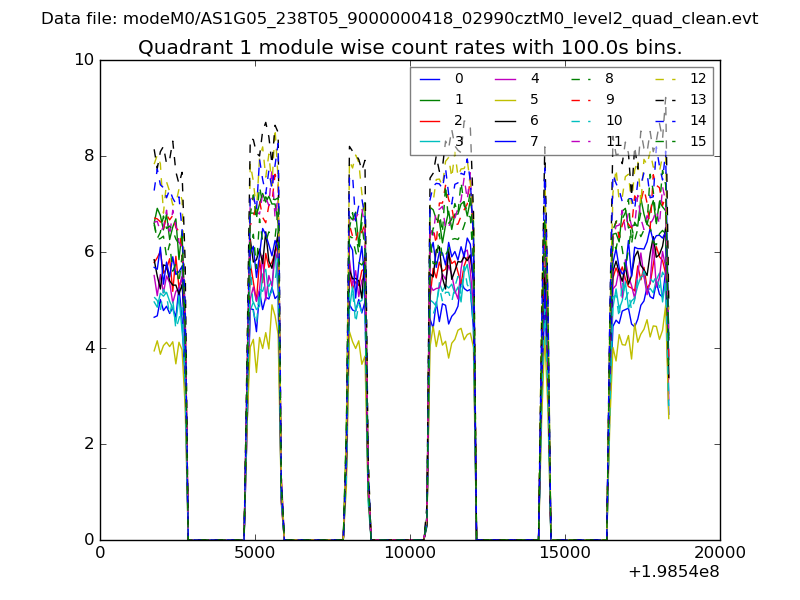
| Module-wise count rates for Quadrant A Data is divided into 100 sec bins |
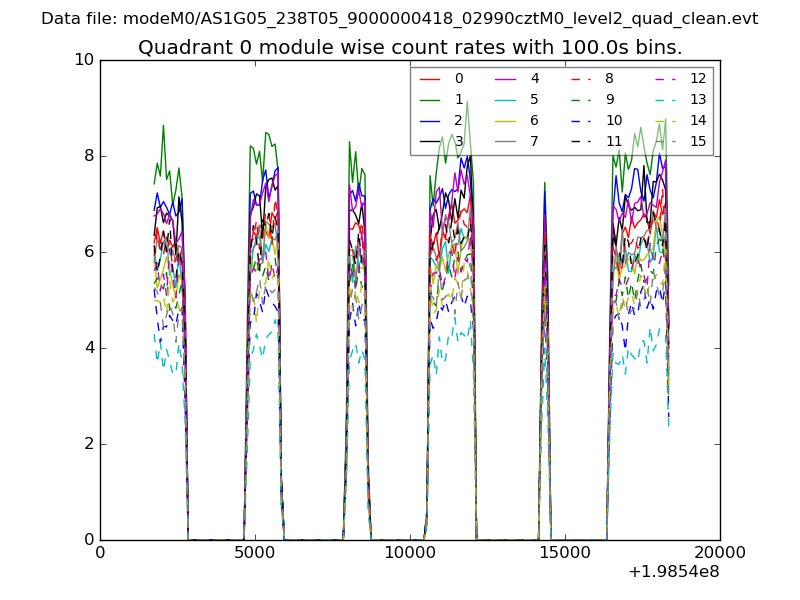 |
 |
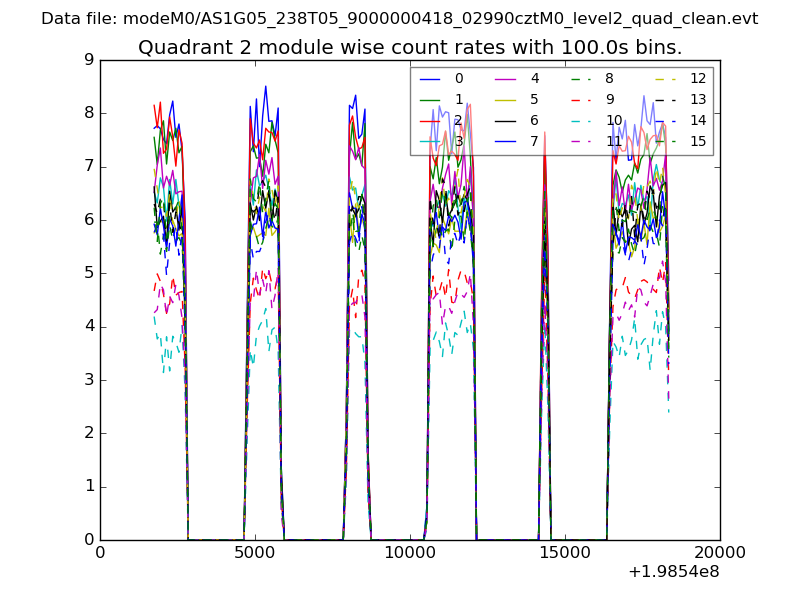
| Module-wise count rates for Quadrant B Data is divided into 100 sec bins |
 |
 |
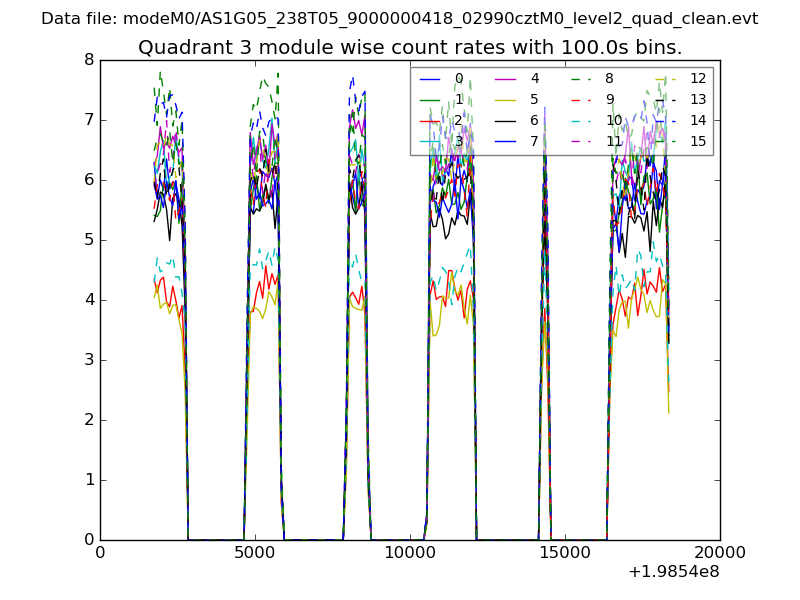
| Module-wise count rates for Quadrant C Data is divided into 100 sec bins |
 |
 |
| Module-wise count rates for Quadrant D Data is divided into 100 sec bins |
 |
 |
| Parameter | Plot |
|---|---|
| CZT HV Monitor | 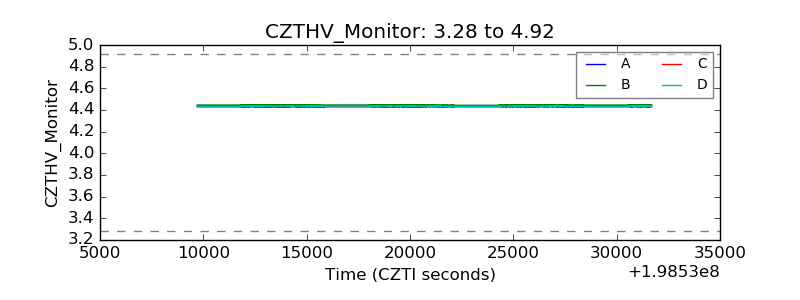 |
| D_VDD | 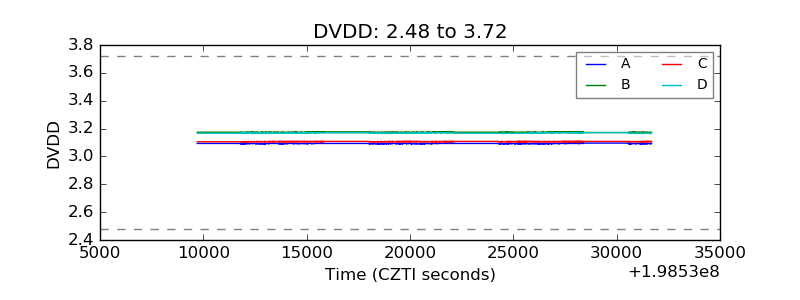 |
| Temperature 1 | 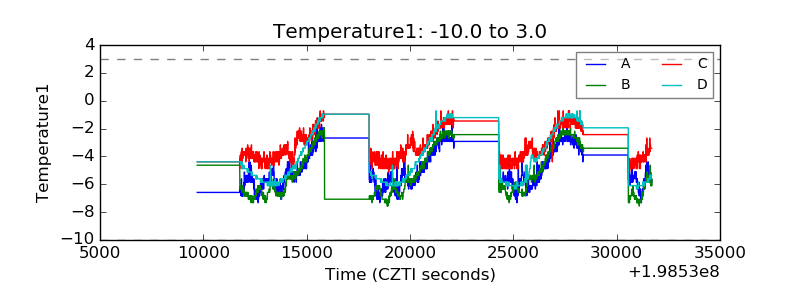 |
| Veto HV Monitor | 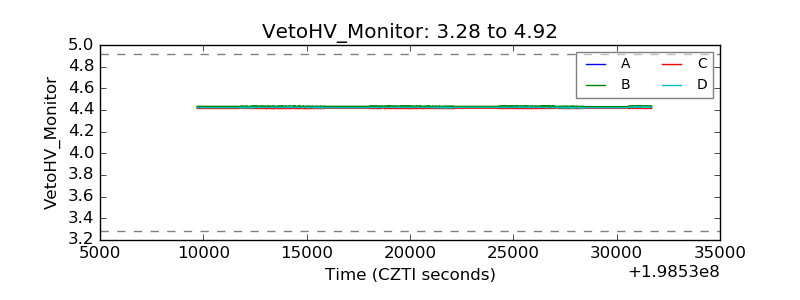 |
| Veto LLD | 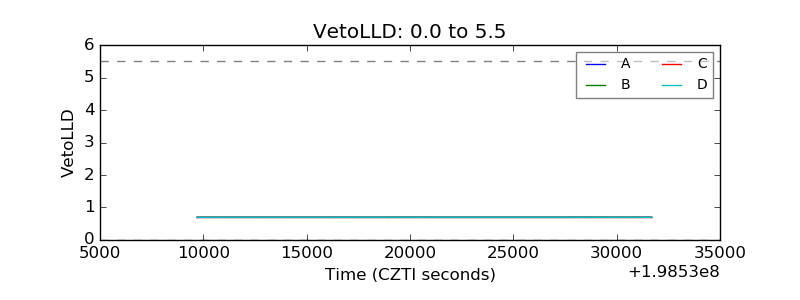 |
| Alpha Counter | 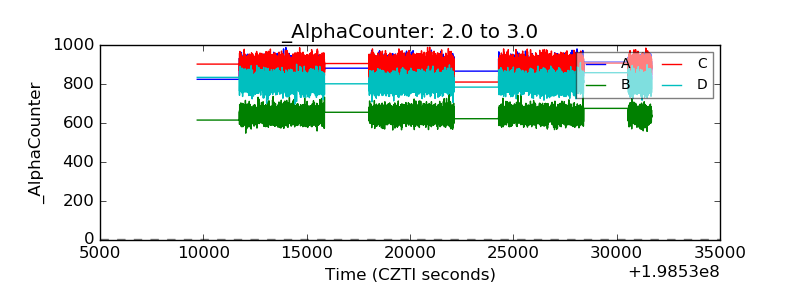 |
| _CPM_Rate | 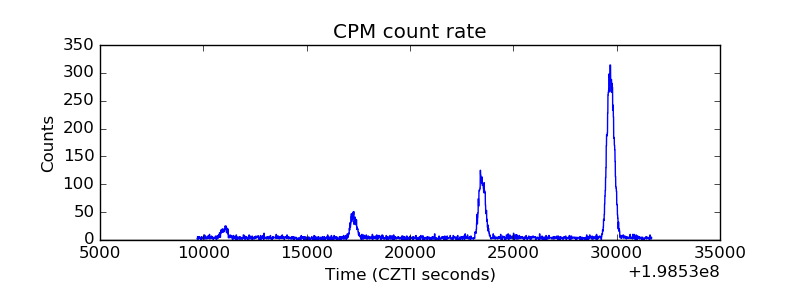 |
| CZT Counter | 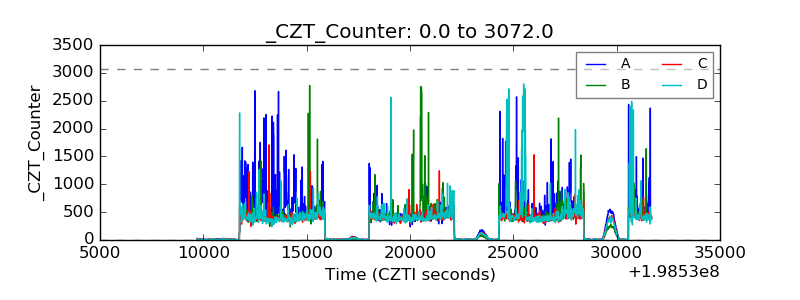 |
| +2.5 Volts monitor | 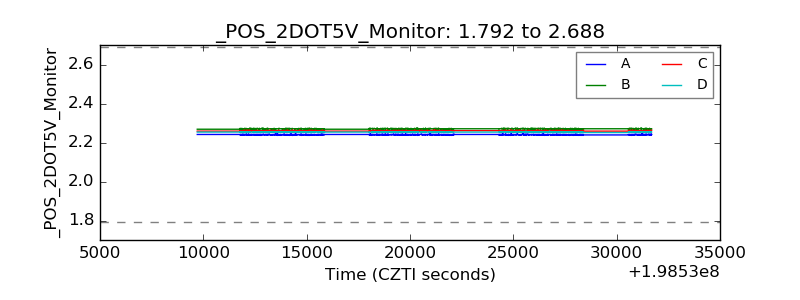 |
| +5 Volts monitor | 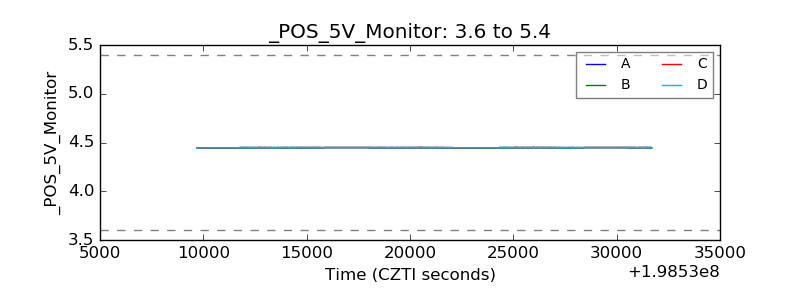 |
| _ROLL_ROT | 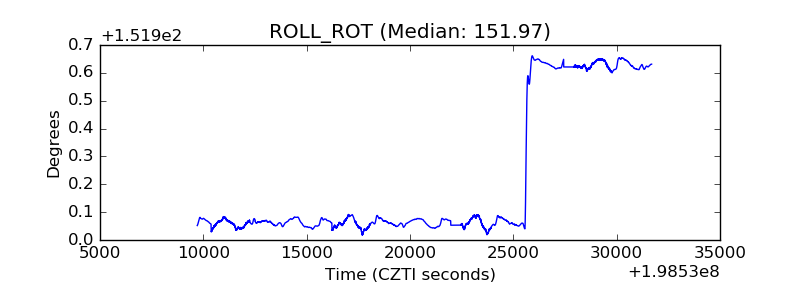 |
| _Roll_DEC | 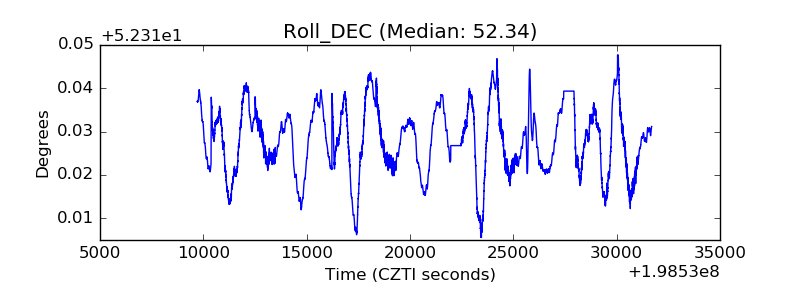 |
| _Roll_RA | 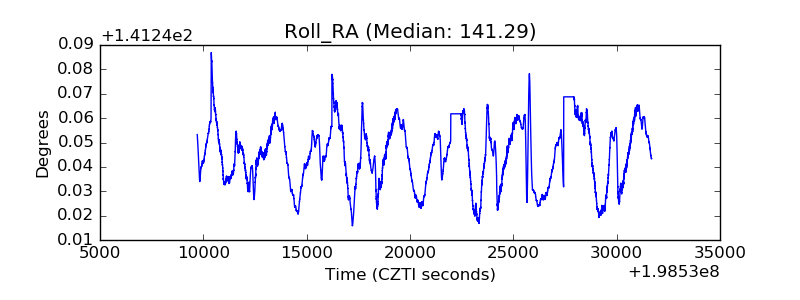 |
| Veto Counter | 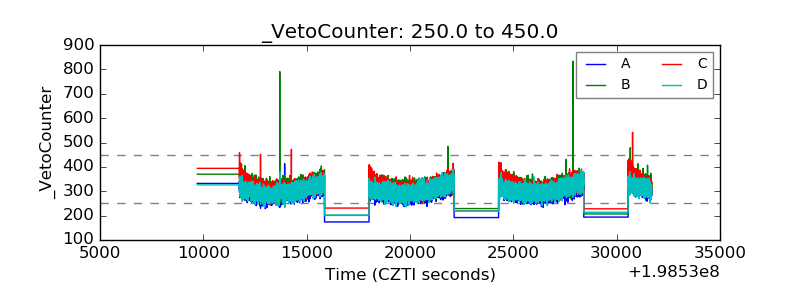 |