| Param | Original file | Final file |
|---|---|---|
| Filename | modeM0/AS1G05_238T05_9000000418_02991cztM0_level2.evt | modeM0/AS1G05_238T05_9000000418_02991cztM0_level2_quad_clean.evt |
| Size (bytes) | 406,828,800 | 48,657,600 |
| Size | 388.0 MB | 46.4 MB |
| Events in quadrant A | 3,566,022 | 273,741 |
| Events in quadrant B | 3,260,628 | 277,625 |
| Events in quadrant C | 2,403,285 | 272,322 |
| Events in quadrant D | 2,715,269 | 262,553 |
| Mode M0 | |||
|---|---|---|---|
| Quadrant | BADHDUFLAG | Total packets | Discarded packets |
| A | 0 | 14245 | 3 |
| B | 0 | 13562 | 2 |
| C | 0 | 11252 | 2 |
| D | 0 | 12152 | 2 |
| Mode M9 | |||
|---|---|---|---|
| Quadrant | BADHDUFLAG | Total packets | Discarded packets |
| A | 0 | 44 | 0 |
| B | 0 | 44 | 0 |
| C | 0 | 44 | 0 |
| D | 0 | 44 | 0 |
| Mode SS | |||
|---|---|---|---|
| Quadrant | BADHDUFLAG | Total packets | Discarded packets |
| A | 0 | 112 | 0 |
| B | 0 | 112 | 0 |
| C | 0 | 112 | 0 |
| D | 0 | 112 | 0 |
| Quadrant | Total seconds | Saturated seconds | Saturation percentage |
|---|---|---|---|
| A | 5532 | 152 | 2.747650% |
| B | 5532 | 65 | 1.174982% |
| C | 5532 | 7 | 0.126537% |
| D | 5532 | 43 | 0.777296% |
Noise dominated data is calculated using 1-second bins in cleaned event files. If a bin has >2000 counts, and if more than 50% of those come from <1% of pixels, then it is considered to be noise-dominated and hence unusable.
| Quadrant | # 1 sec bins | Bins with >0 counts | Bins with >2000 counts | High rate bins dominated by noise | Noise dominated (total time) | Noise dominated (detector-on time) | Marked lightcurve |
|---|---|---|---|---|---|---|---|
| A | 9842 | 5534 | 116 | 116 | 1.18% | 2.10% | 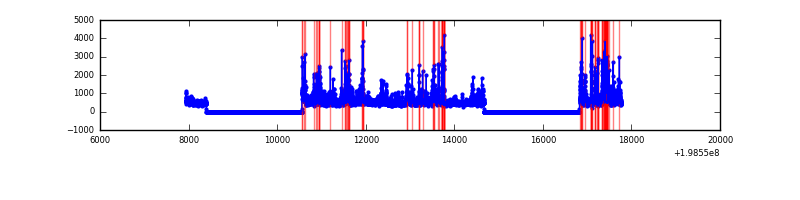 |
| B | 9842 | 5534 | 48 | 48 | 0.49% | 0.87% | 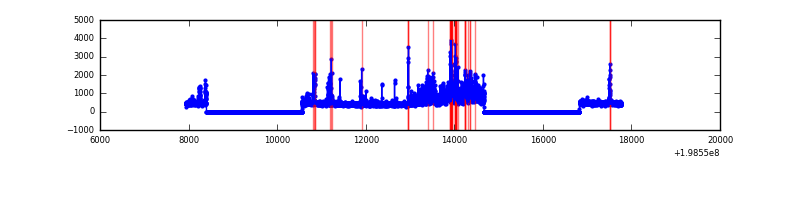 |
| C | 9842 | 5534 | 5 | 5 | 0.05% | 0.09% | 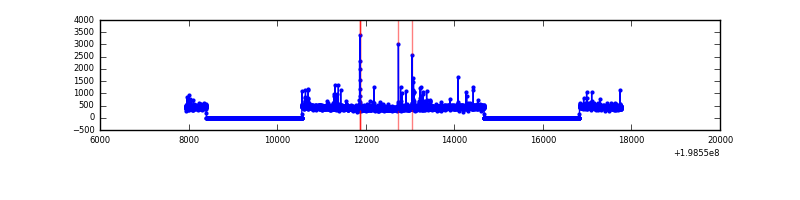 |
| D | 9842 | 5534 | 36 | 36 | 0.37% | 0.65% | 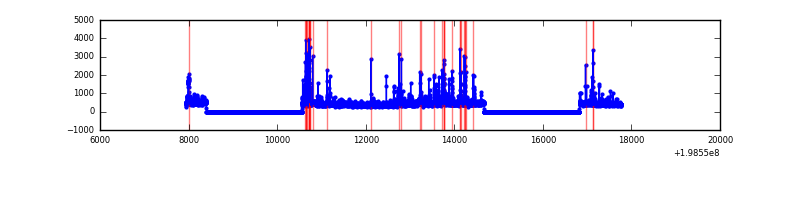 |
Top three noisy pixels from each quadrant. If the there are fewer than three noisy pixels in the level2.evt file, extra rows are filled as -1
| Pixel properties | Quadrant properties | ||||||
|---|---|---|---|---|---|---|---|
| Quadrant | DetID | PixID | Counts | Sigma | Mean | Median | Sigma |
| A | 13 | 9 | 1003210 | 8150.44 | 600 | 587 | 123.0 |
| A | 0 | 50 | 93458 | 754.96 | 600 | 587 | 123.0 |
| A | 14 | 249 | 62151 | 500.46 | 600 | 587 | 123.0 |
| B | 8 | 3 | 464258 | 3870.51 | 617 | 602 | 119.8 |
| B | 2 | 249 | 157983 | 1313.79 | 617 | 602 | 119.8 |
| B | 0 | 205 | 88827 | 736.49 | 617 | 602 | 119.8 |
| C | 6 | 80 | 68275 | 490.11 | 587 | 589 | 138.1 |
| C | 1 | 16 | 11987 | 82.53 | 587 | 589 | 138.1 |
| C | 15 | 208 | 11172 | 76.63 | 587 | 589 | 138.1 |
| D | 7 | 80 | 283517 | 1977.56 | 583 | 566 | 143.1 |
| D | 13 | 114 | 29803 | 204.34 | 583 | 566 | 143.1 |
| D | 9 | 35 | 23540 | 160.57 | 583 | 566 | 143.1 |
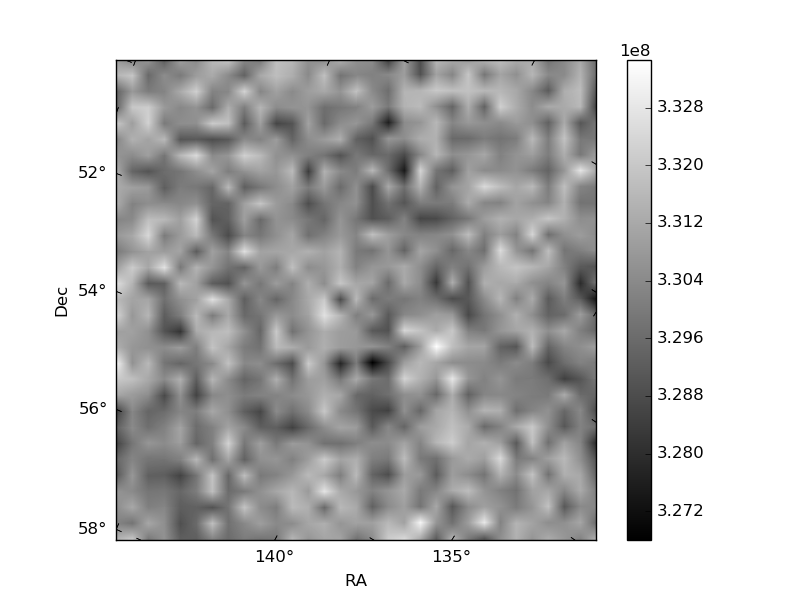
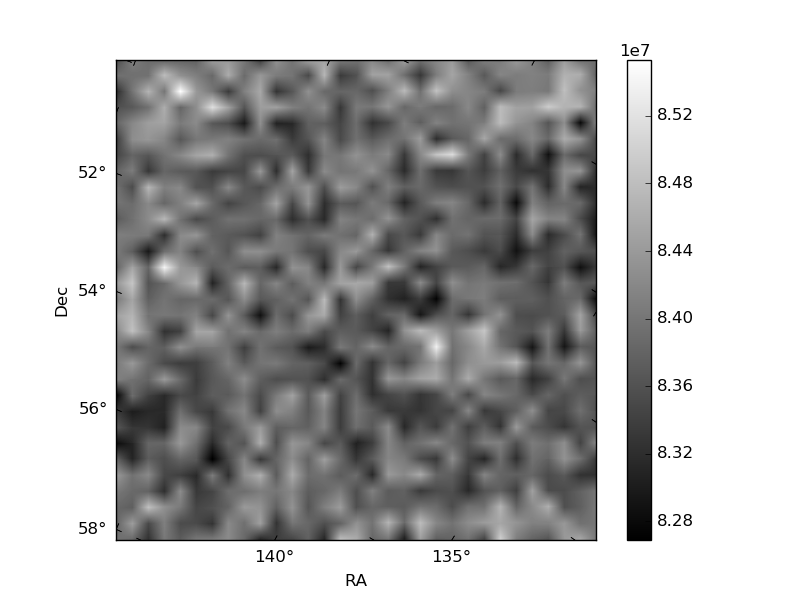
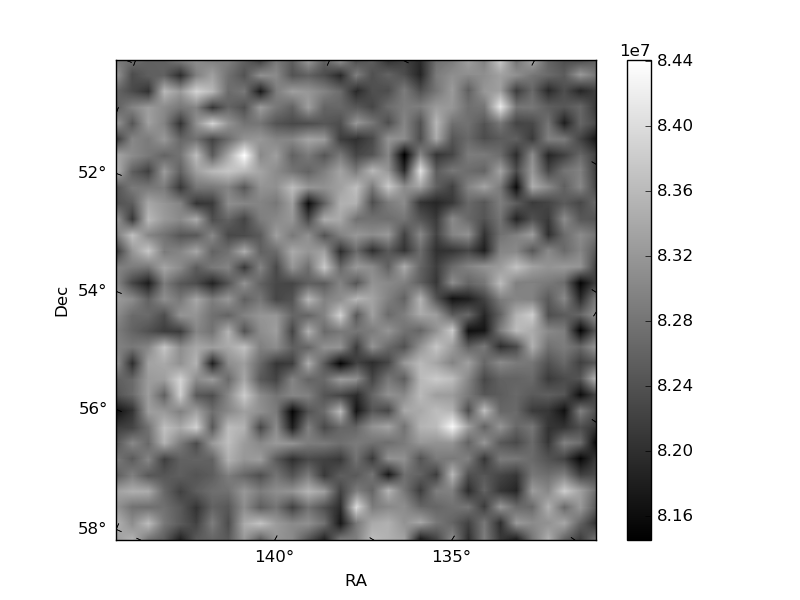
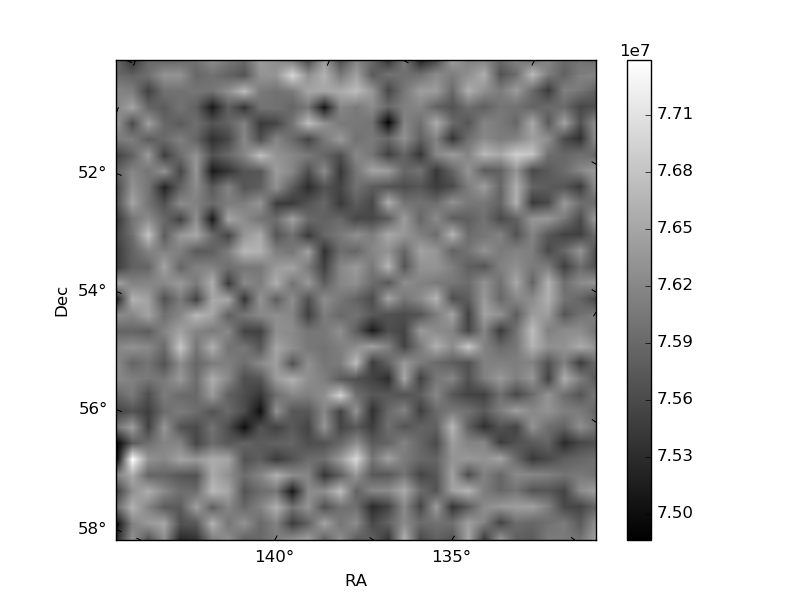
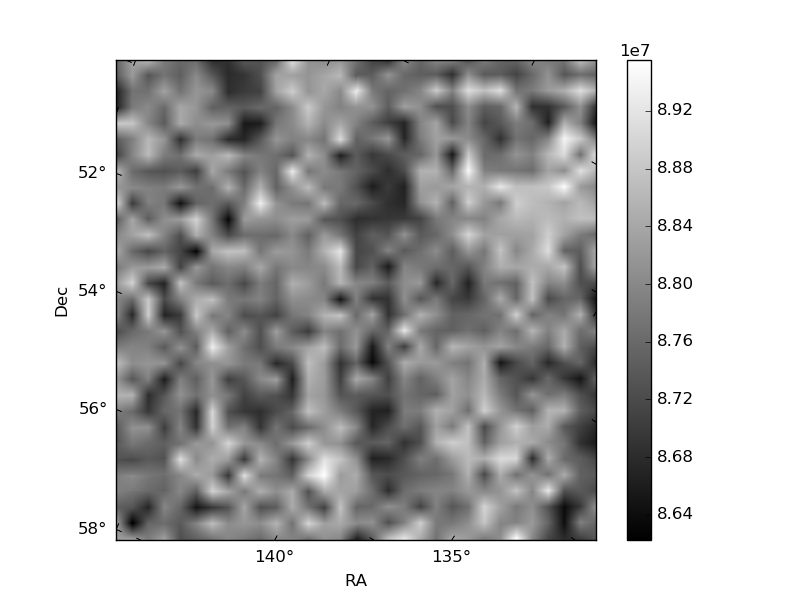
Histogram calculated using DETX and DETY for each event in the final _common_clean file
| Quadrant A | 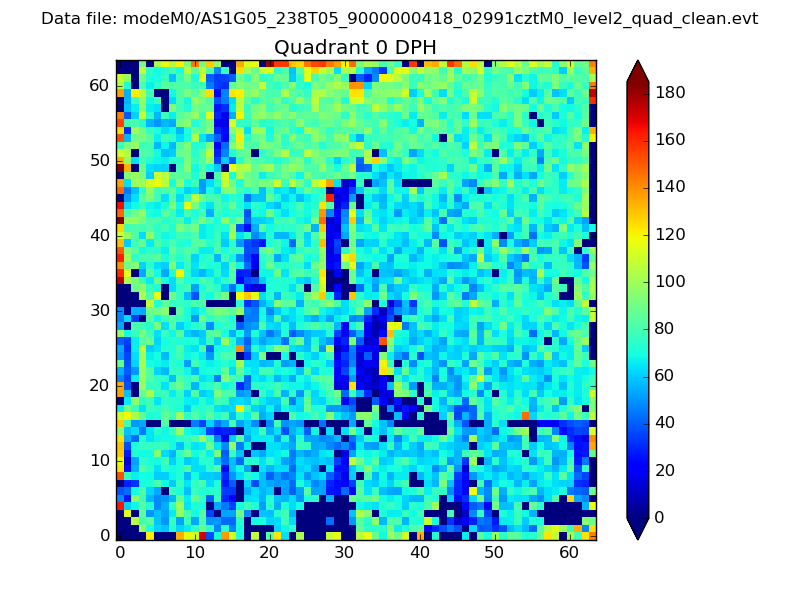 |
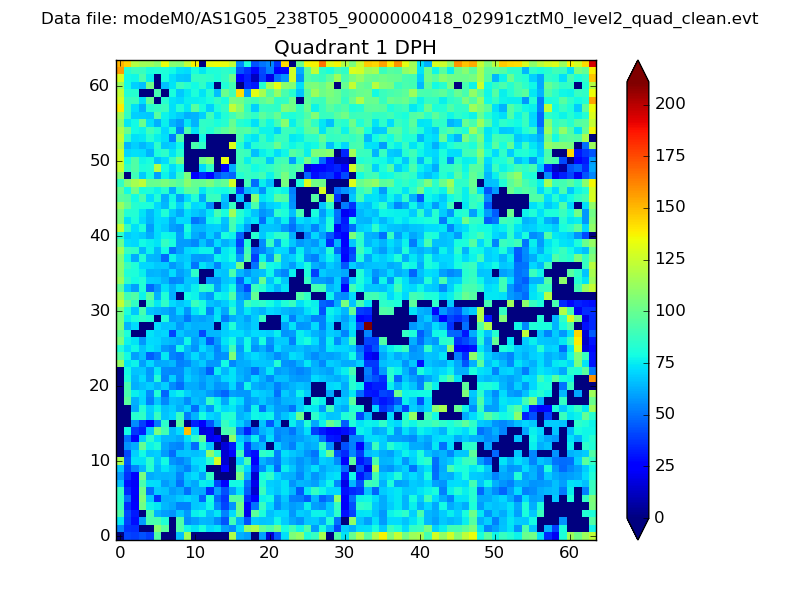 |
Quadrant B |
|---|---|---|---|
| Quadrant D | 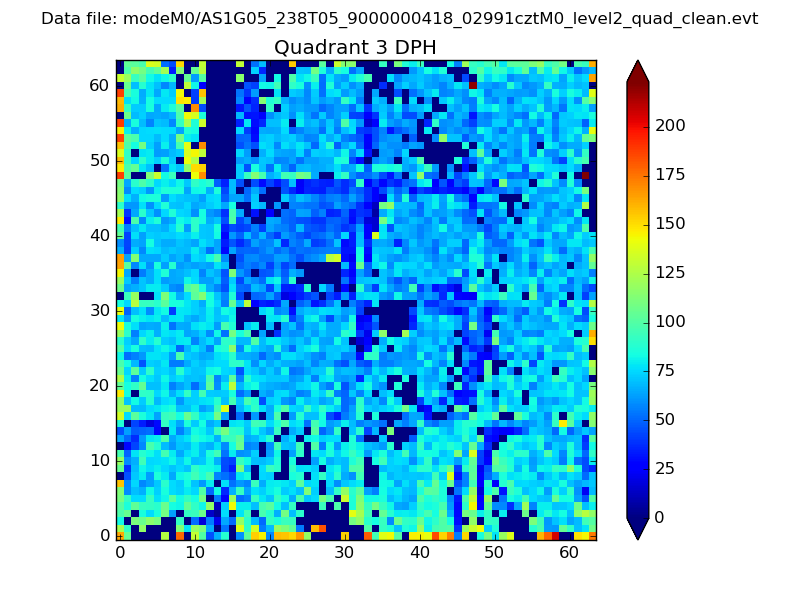 |
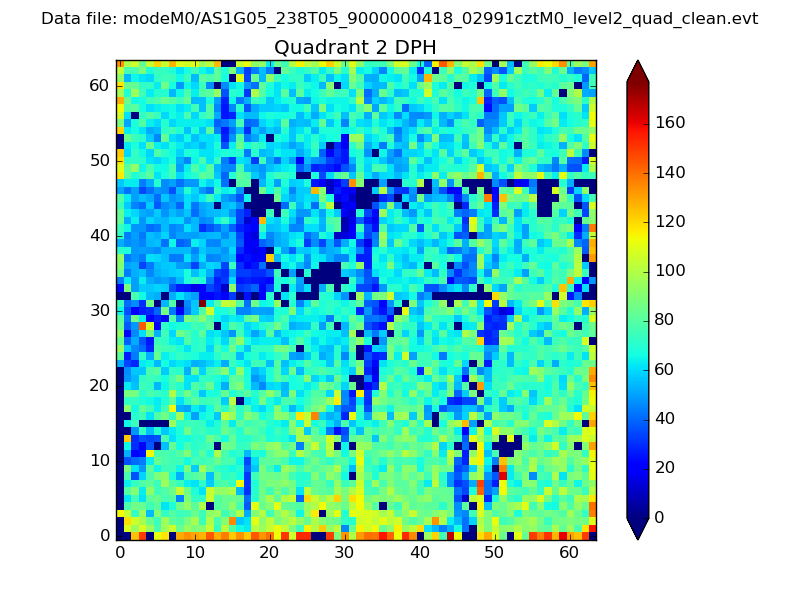 |
Quadrant C |
| Plot type | Count rate plots | Images |
|---|---|---|
| Comparison with Poisson distribution Blue bars denote a histogram of data divided into 1 sec bins. Red curve is a Poisson curve with rate = median count rate of data. |
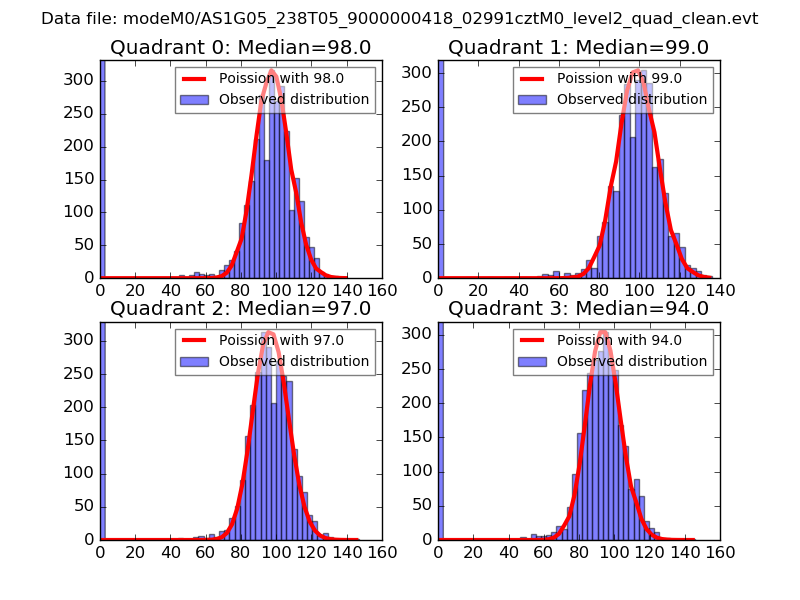 |
 |
| Quadrant-wise count rates Data is divided into 100 sec bins |
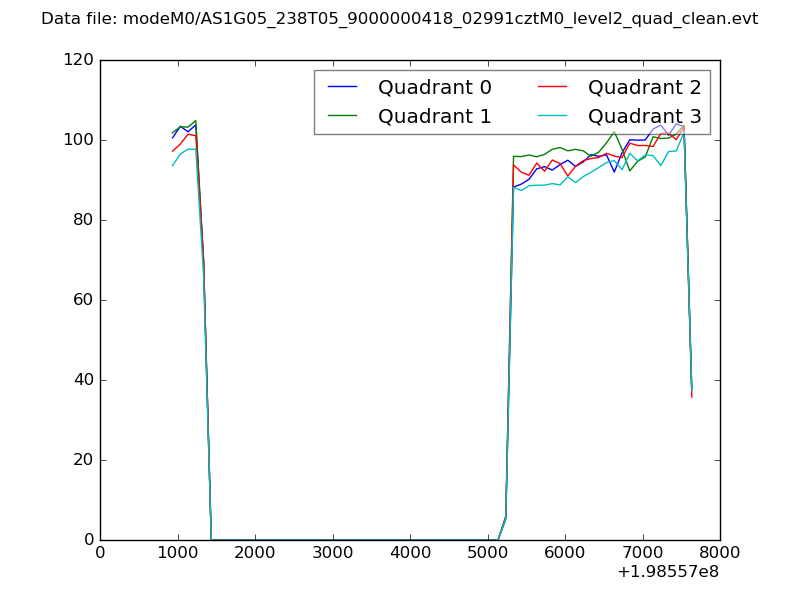 |
|
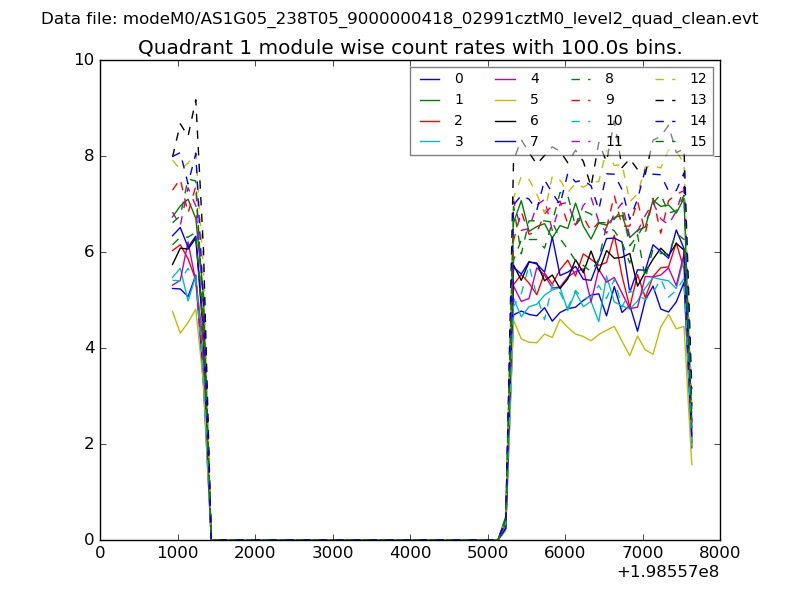
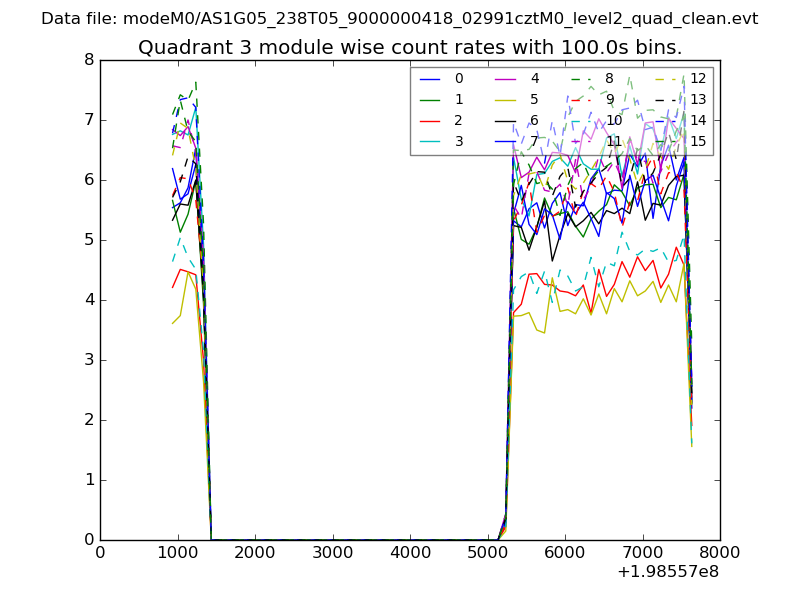
| Module-wise count rates for Quadrant A Data is divided into 100 sec bins |
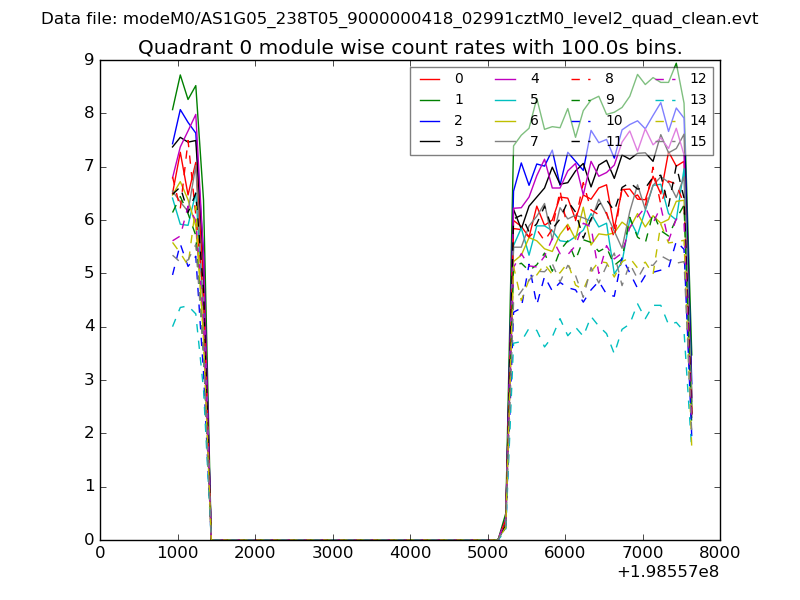 |
 |
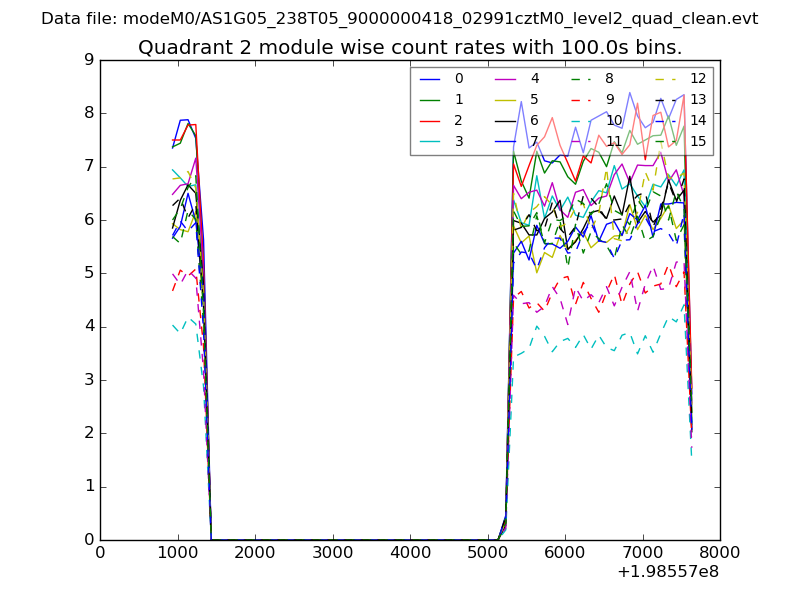
| Module-wise count rates for Quadrant B Data is divided into 100 sec bins |
 |
 |
| Module-wise count rates for Quadrant C Data is divided into 100 sec bins |
 |
 |
| Module-wise count rates for Quadrant D Data is divided into 100 sec bins |
 |
 |
| Parameter | Plot |
|---|---|
| CZT HV Monitor | 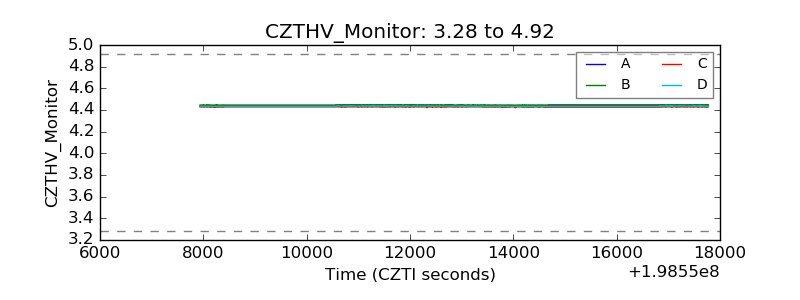 |
| D_VDD | 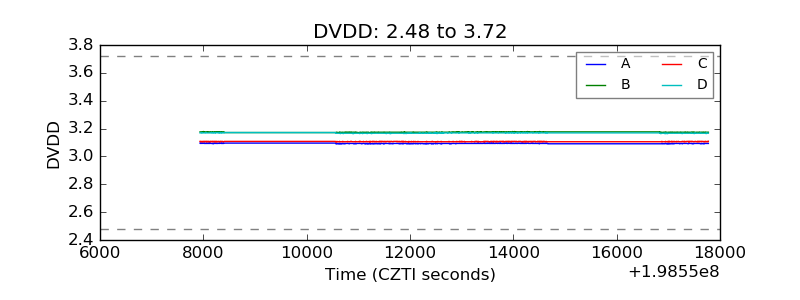 |
| Temperature 1 | 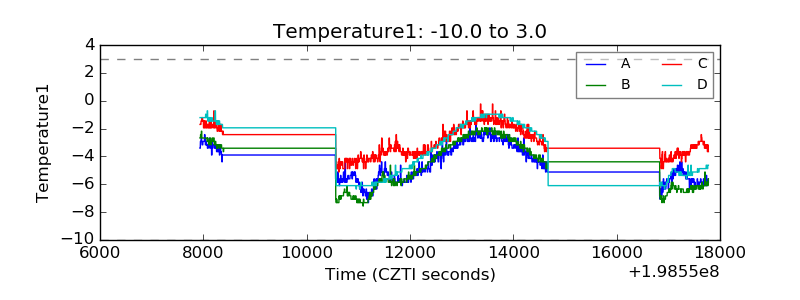 |
| Veto HV Monitor | 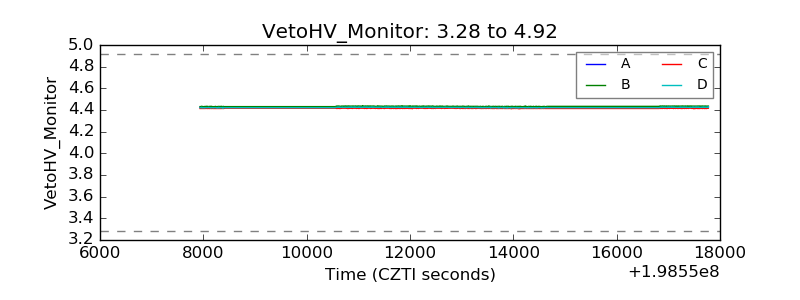 |
| Veto LLD | 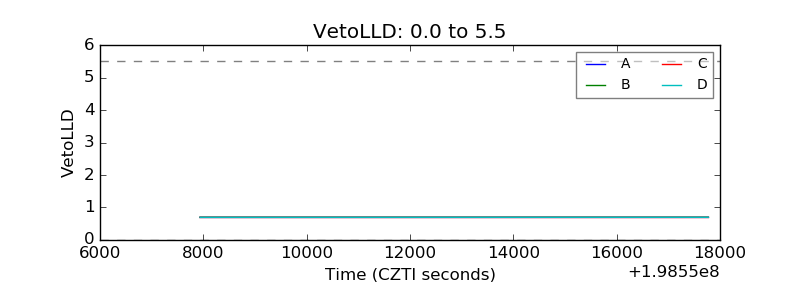 |
| Alpha Counter | 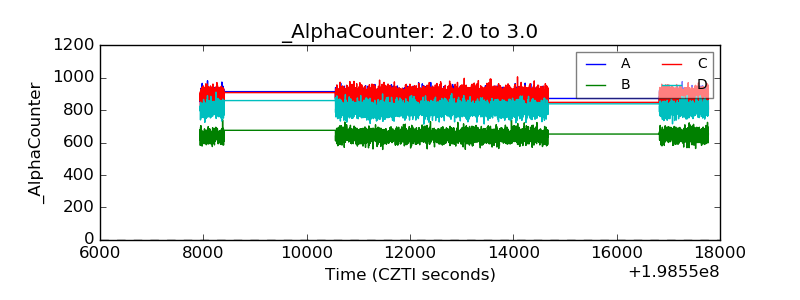 |
| _CPM_Rate | 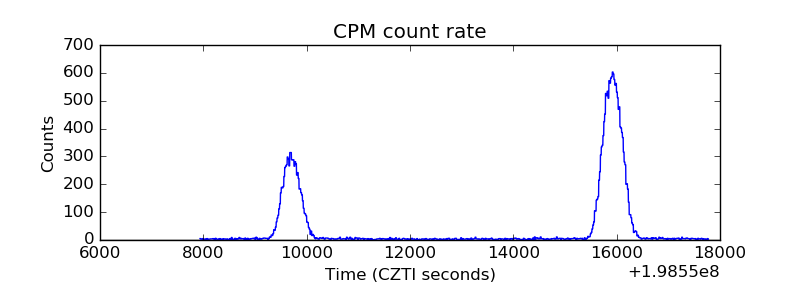 |
| CZT Counter | 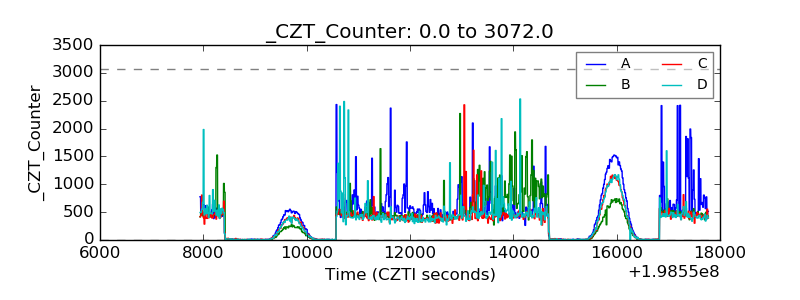 |
| +2.5 Volts monitor |  |
| +5 Volts monitor |  |
| _ROLL_ROT | 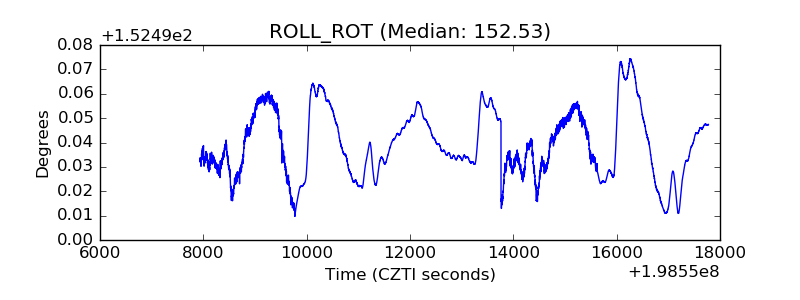 |
| _Roll_DEC | 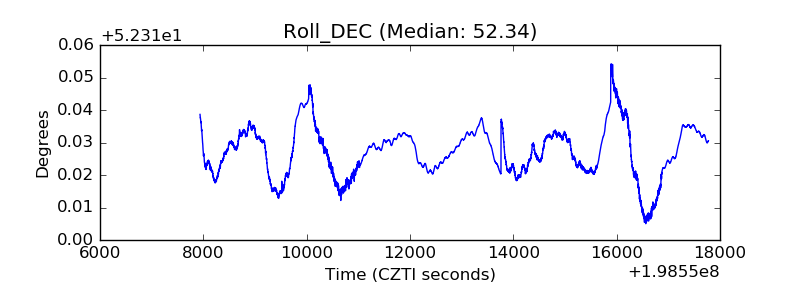 |
| _Roll_RA | 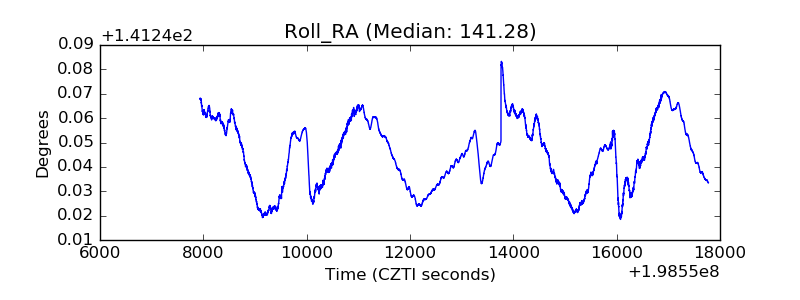 |
| Veto Counter | 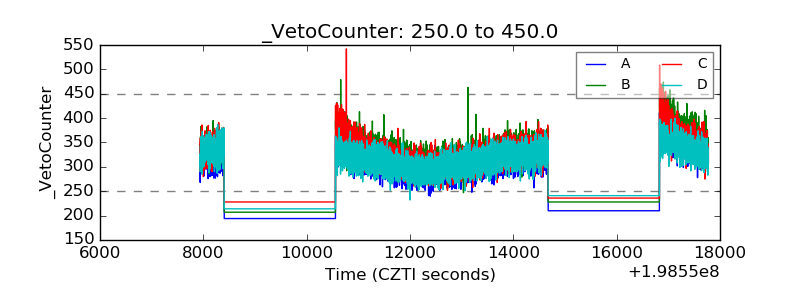 |