| Param | Original file | Final file |
|---|---|---|
| Filename | modeM0/AS1G05_238T05_9000000418_02993cztM0_level2.evt | modeM0/AS1G05_238T05_9000000418_02993cztM0_level2_quad_clean.evt |
| Size (bytes) | 418,919,040 | 47,638,080 |
| Size | 399.5 MB | 45.4 MB |
| Events in quadrant A | 4,918,013 | 257,140 |
| Events in quadrant B | 2,633,896 | 287,340 |
| Events in quadrant C | 2,250,461 | 275,291 |
| Events in quadrant D | 2,538,552 | 265,165 |
| Mode M0 | |||
|---|---|---|---|
| Quadrant | BADHDUFLAG | Total packets | Discarded packets |
| A | 0 | 18093 | 3 |
| B | 0 | 11077 | 2 |
| C | 0 | 10393 | 2 |
| D | 0 | 11119 | 2 |
| Mode M9 | |||
|---|---|---|---|
| Quadrant | BADHDUFLAG | Total packets | Discarded packets |
| A | 0 | 34 | 0 |
| B | 0 | 34 | 0 |
| C | 0 | 34 | 0 |
| D | 0 | 35 | 0 |
| Mode SS | |||
|---|---|---|---|
| Quadrant | BADHDUFLAG | Total packets | Discarded packets |
| A | 0 | 104 | 0 |
| B | 0 | 104 | 0 |
| C | 0 | 104 | 0 |
| D | 0 | 104 | 0 |
| Quadrant | Total seconds | Saturated seconds | Saturation percentage |
|---|---|---|---|
| A | 5089 | 523 | 10.277068% |
| B | 5089 | 59 | 1.159363% |
| C | 5089 | 8 | 0.157202% |
| D | 5089 | 33 | 0.648457% |
Noise dominated data is calculated using 1-second bins in cleaned event files. If a bin has >2000 counts, and if more than 50% of those come from <1% of pixels, then it is considered to be noise-dominated and hence unusable.
| Quadrant | # 1 sec bins | Bins with >0 counts | Bins with >2000 counts | High rate bins dominated by noise | Noise dominated (total time) | Noise dominated (detector-on time) | Marked lightcurve |
|---|---|---|---|---|---|---|---|
| A | 7245 | 5090 | 400 | 400 | 5.52% | 7.86% | 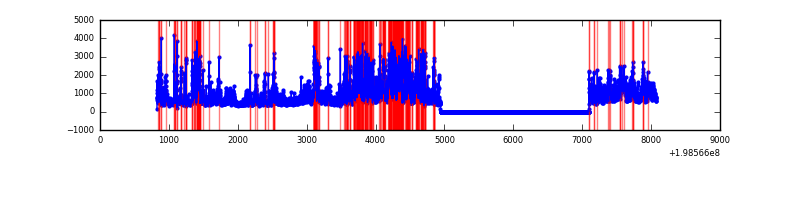 |
| B | 7245 | 5090 | 34 | 34 | 0.47% | 0.67% | 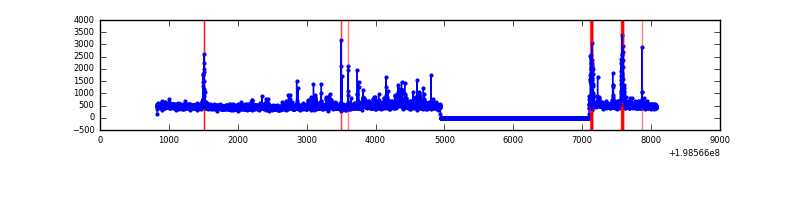 |
| C | 7245 | 5090 | 6 | 6 | 0.08% | 0.12% | 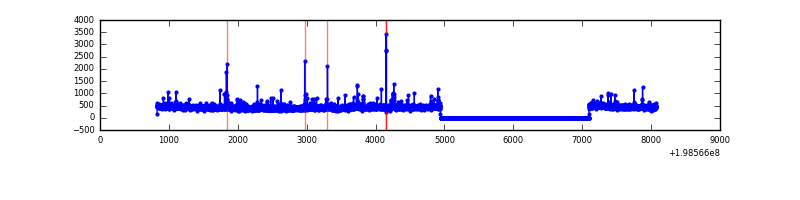 |
| D | 7245 | 5090 | 27 | 27 | 0.37% | 0.53% | 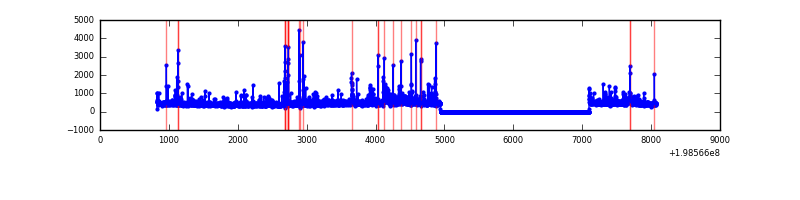 |
Top three noisy pixels from each quadrant. If the there are fewer than three noisy pixels in the level2.evt file, extra rows are filled as -1
| Pixel properties | Quadrant properties | ||||||
|---|---|---|---|---|---|---|---|
| Quadrant | DetID | PixID | Counts | Sigma | Mean | Median | Sigma |
| A | 13 | 9 | 1641937 | 14811.39 | 547 | 535 | 110.8 |
| A | 0 | 50 | 448929 | 4046.14 | 547 | 535 | 110.8 |
| A | 14 | 238 | 327795 | 2953.07 | 547 | 535 | 110.8 |
| B | 8 | 3 | 161206 | 1421.03 | 580 | 565 | 113.0 |
| B | 5 | 70 | 128569 | 1132.32 | 580 | 565 | 113.0 |
| B | 0 | 219 | 39647 | 345.72 | 580 | 565 | 113.0 |
| C | 6 | 80 | 79844 | 619.09 | 548 | 551 | 128.1 |
| C | 15 | 208 | 13649 | 102.26 | 548 | 551 | 128.1 |
| C | 1 | 16 | 11116 | 82.49 | 548 | 551 | 128.1 |
| D | 7 | 80 | 205384 | 1537.25 | 545 | 528 | 133.3 |
| D | 2 | 209 | 45007 | 333.77 | 545 | 528 | 133.3 |
| D | 12 | 1 | 37676 | 278.76 | 545 | 528 | 133.3 |
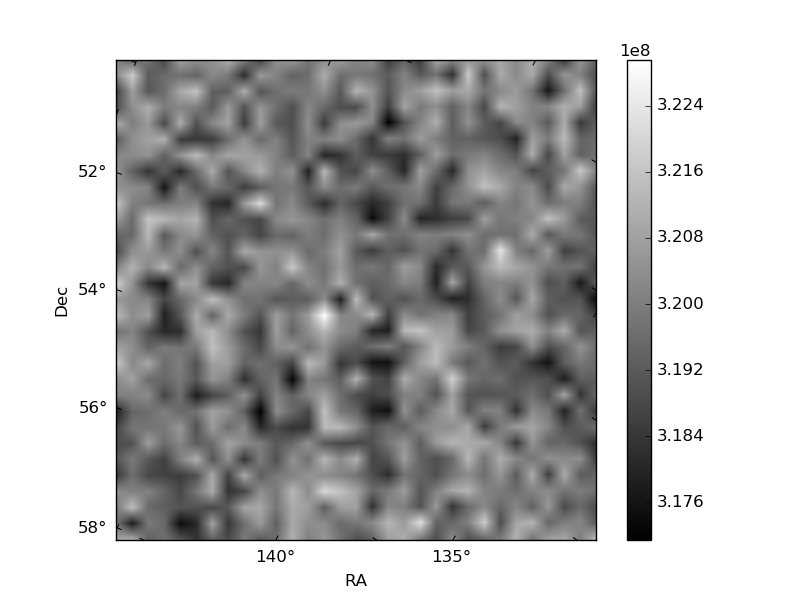
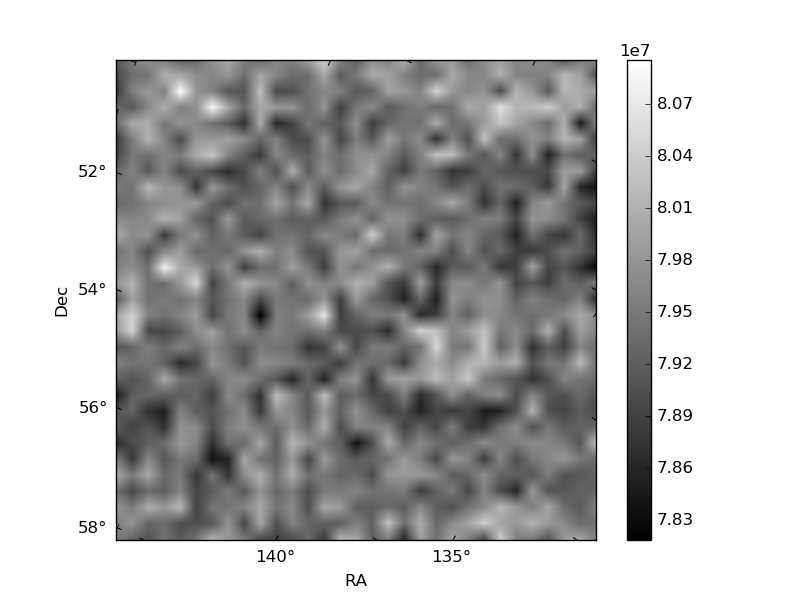
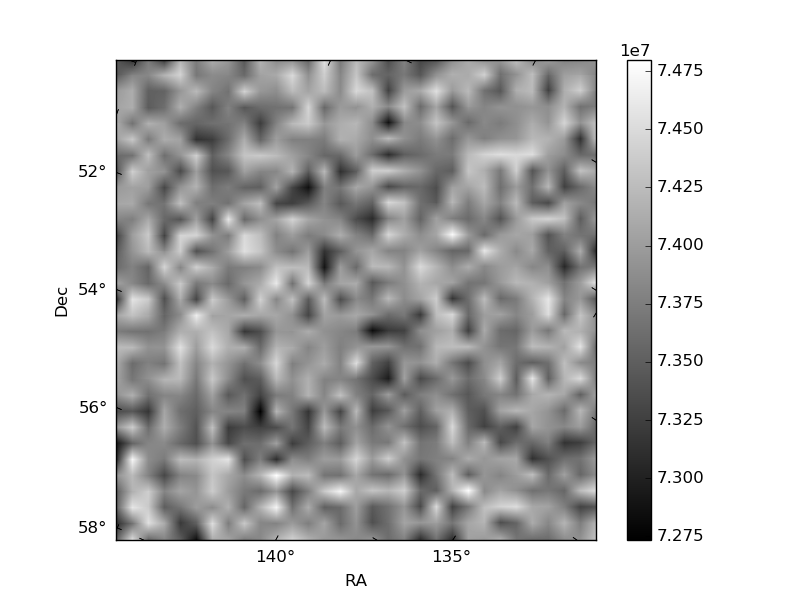
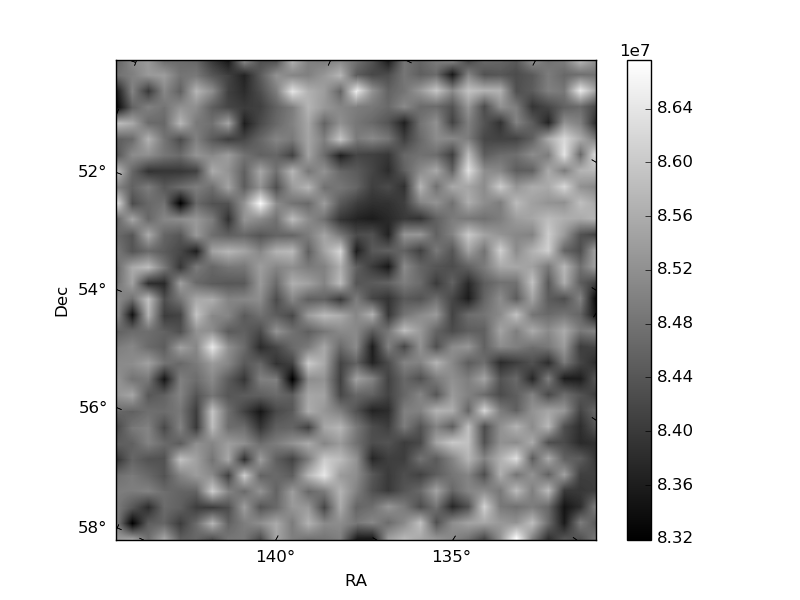
Histogram calculated using DETX and DETY for each event in the final _common_clean file
| Quadrant A | 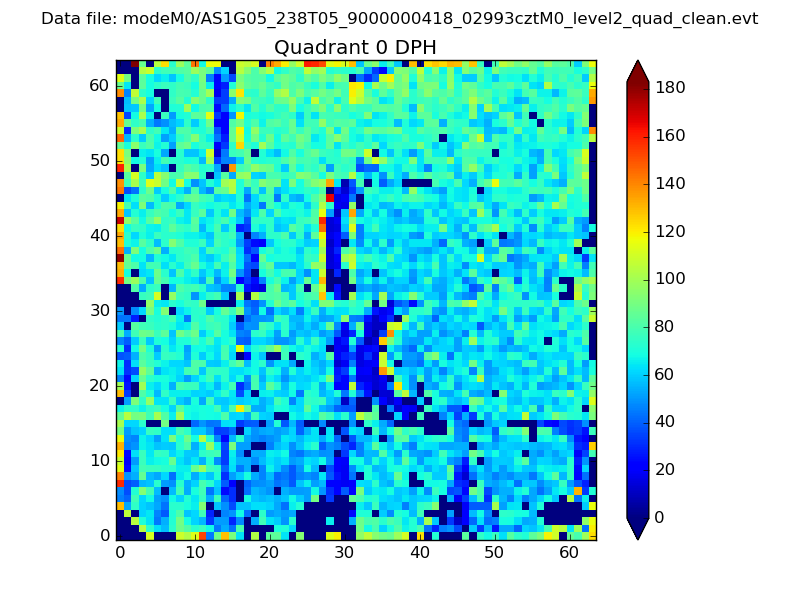 |
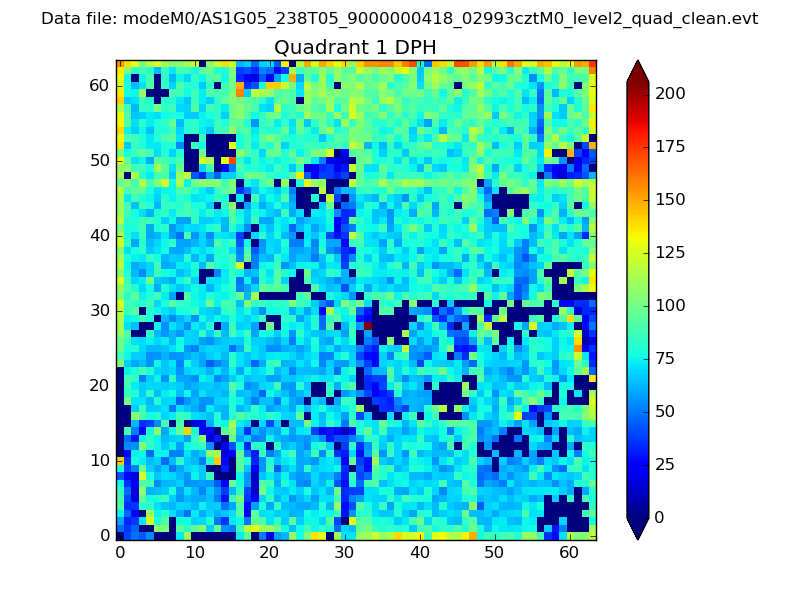 |
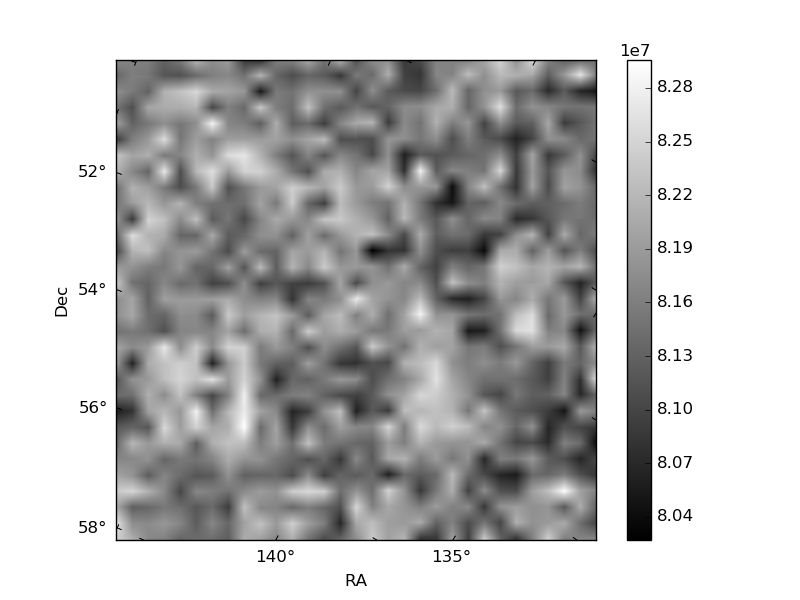
Quadrant B |
|---|---|---|---|
| Quadrant D | 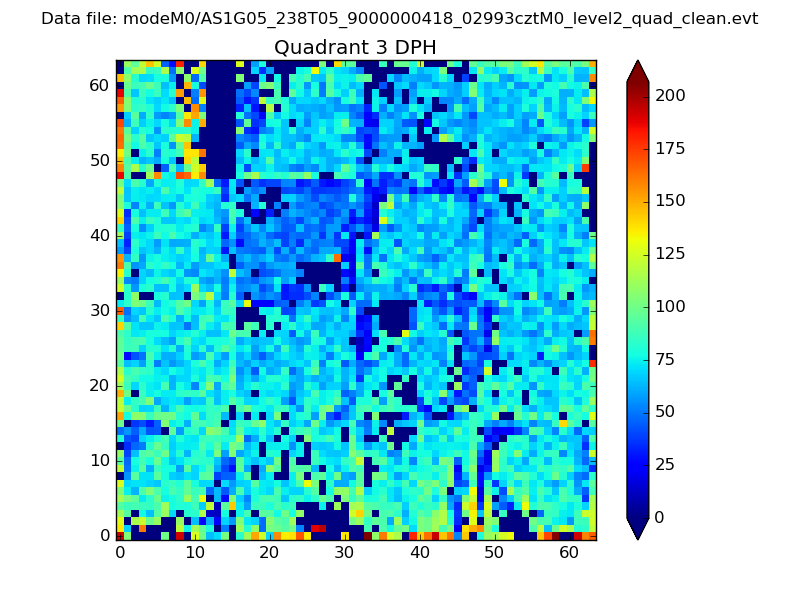 |
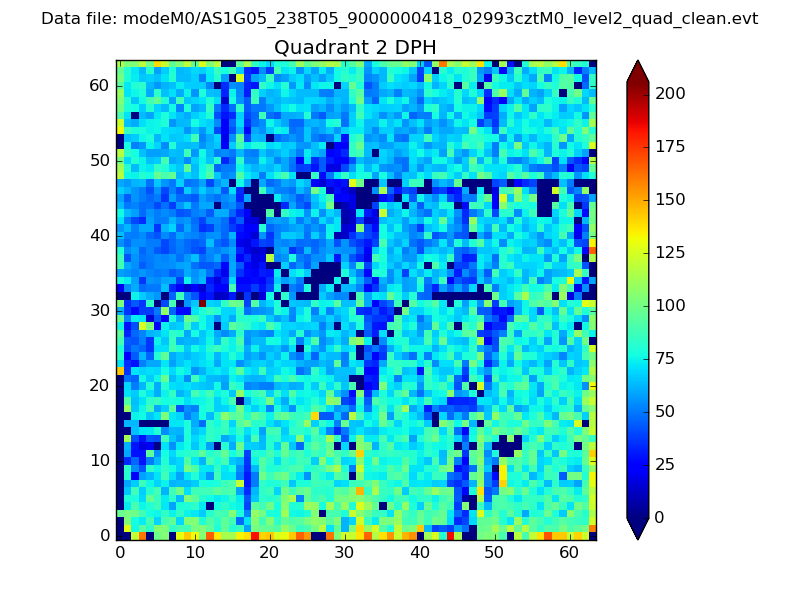 |
Quadrant C |
| Plot type | Count rate plots | Images |
|---|---|---|
| Comparison with Poisson distribution Blue bars denote a histogram of data divided into 1 sec bins. Red curve is a Poisson curve with rate = median count rate of data. |
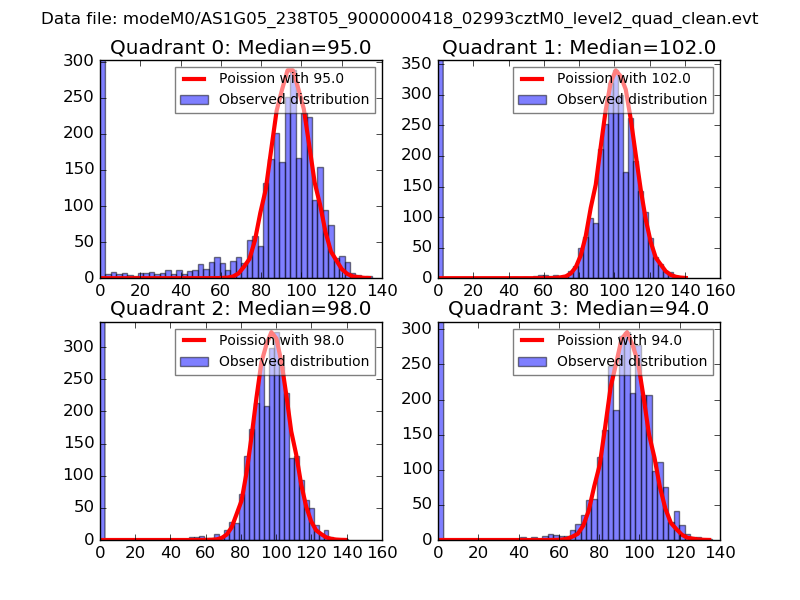 |
 |
| Quadrant-wise count rates Data is divided into 100 sec bins |
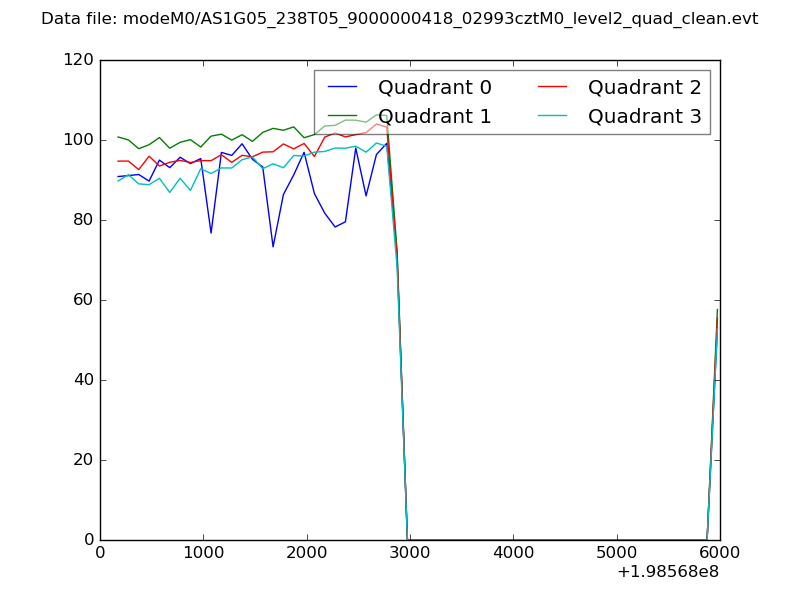 |
|
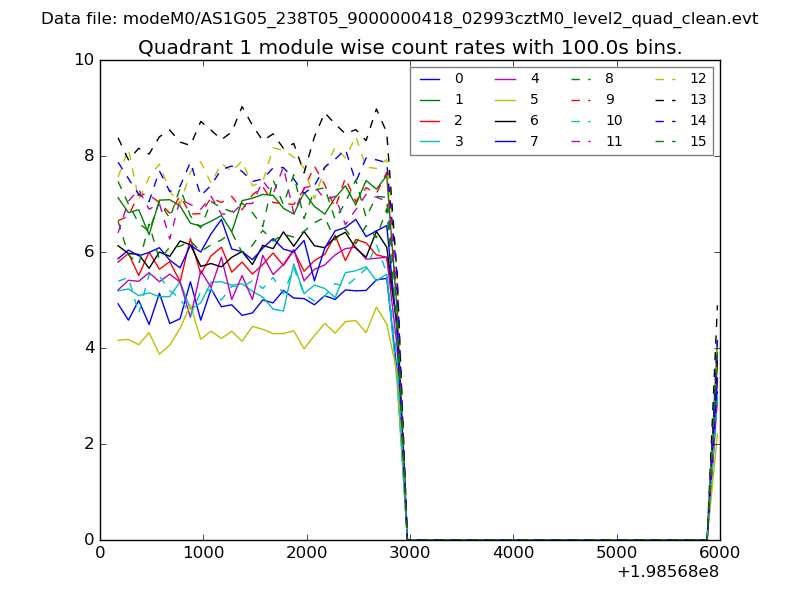
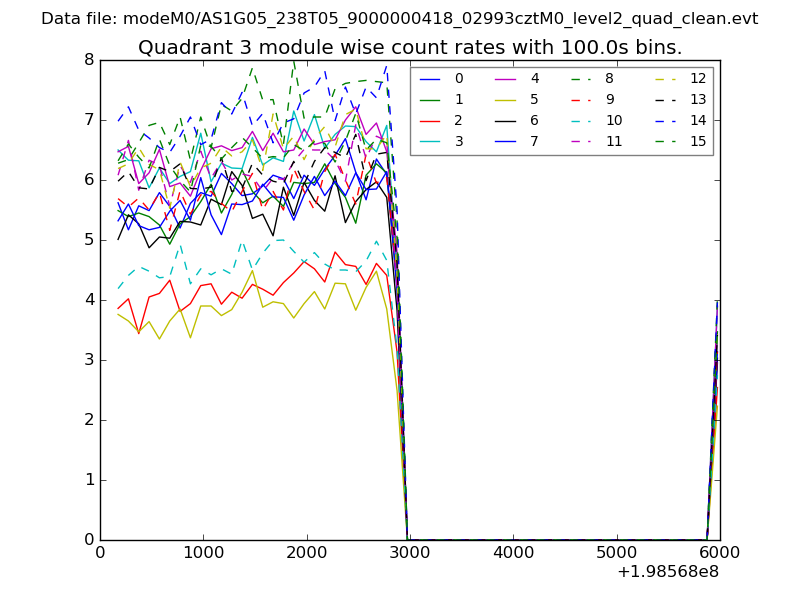
| Module-wise count rates for Quadrant A Data is divided into 100 sec bins |
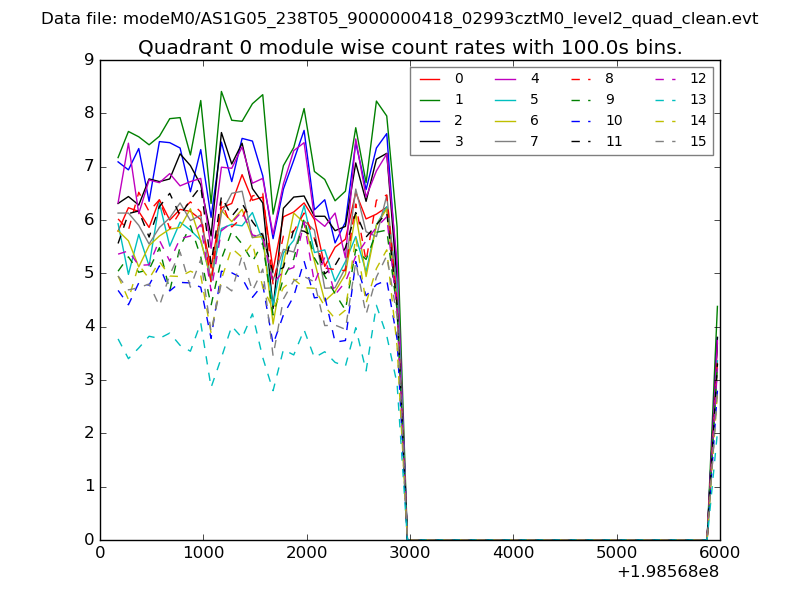 |
 |
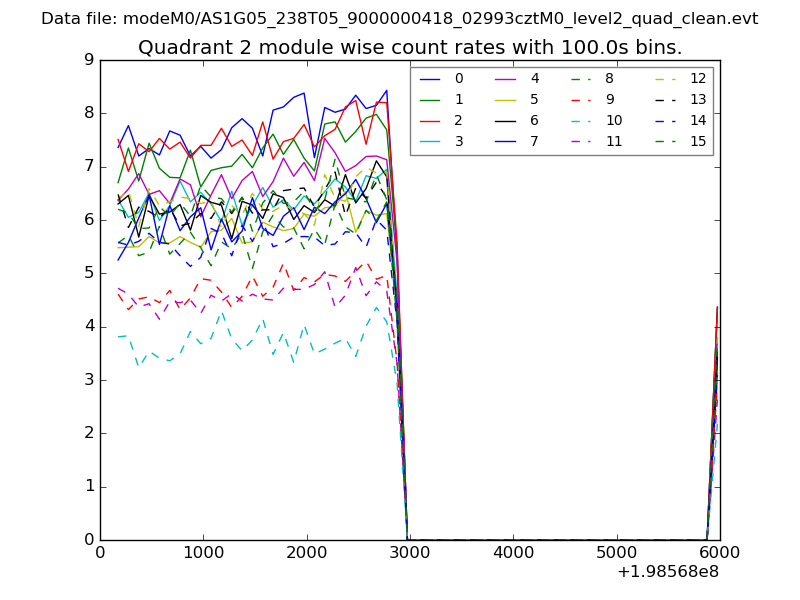
| Module-wise count rates for Quadrant B Data is divided into 100 sec bins |
 |
 |
| Module-wise count rates for Quadrant C Data is divided into 100 sec bins |
 |
 |
| Module-wise count rates for Quadrant D Data is divided into 100 sec bins |
 |
 |
| Parameter | Plot |
|---|---|
| CZT HV Monitor | 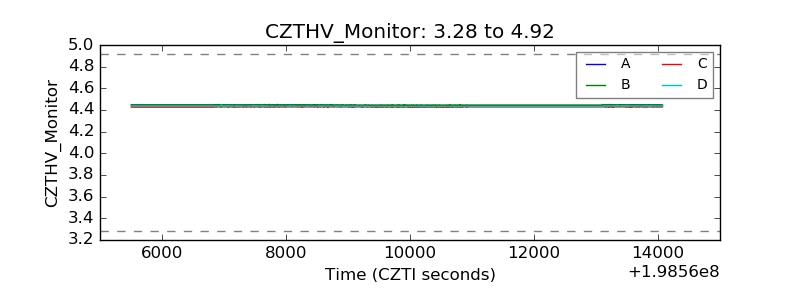 |
| D_VDD | 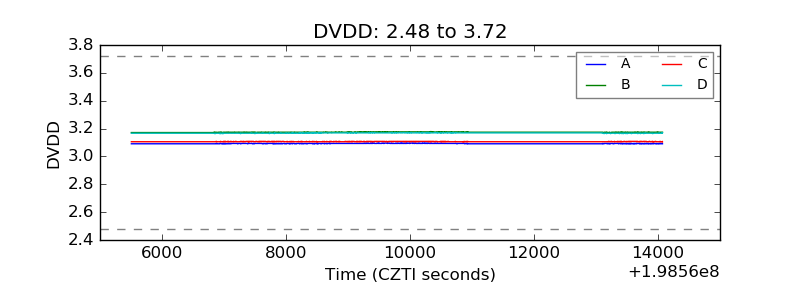 |
| Temperature 1 | 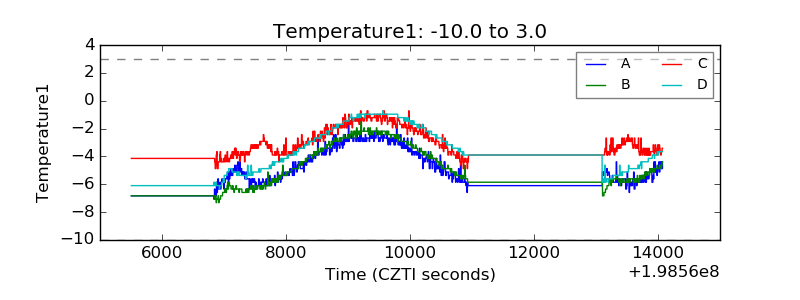 |
| Veto HV Monitor | 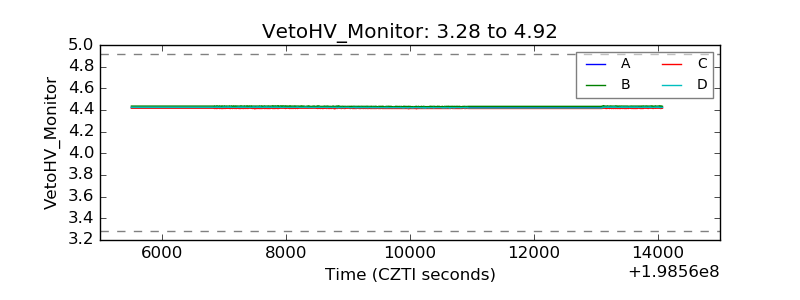 |
| Veto LLD | 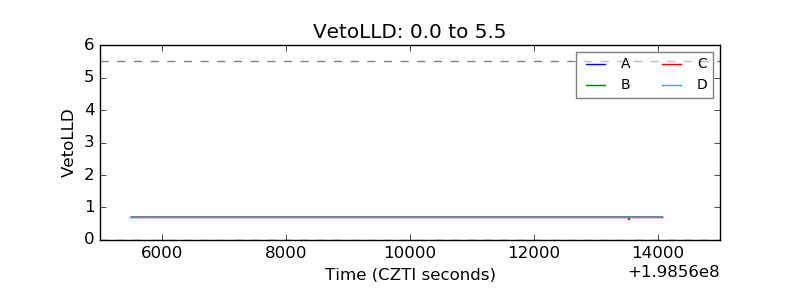 |
| Alpha Counter | 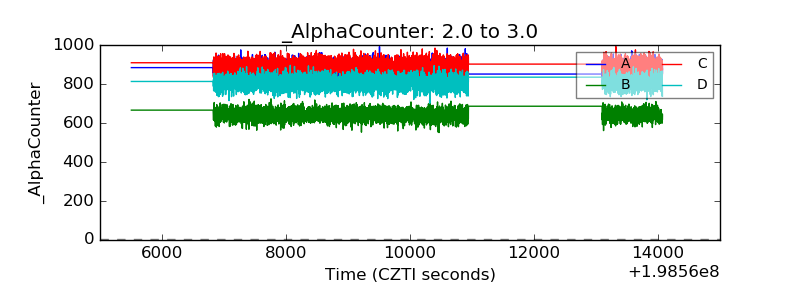 |
| _CPM_Rate | 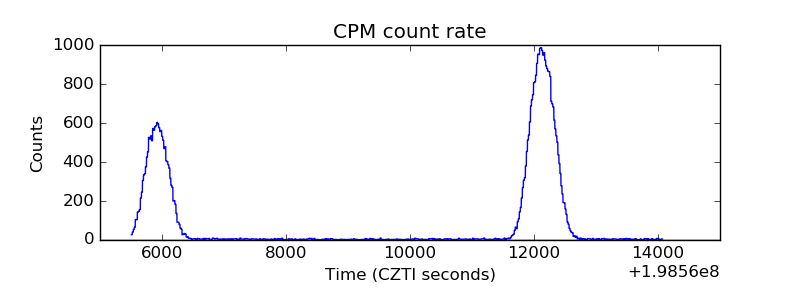 |
| CZT Counter | 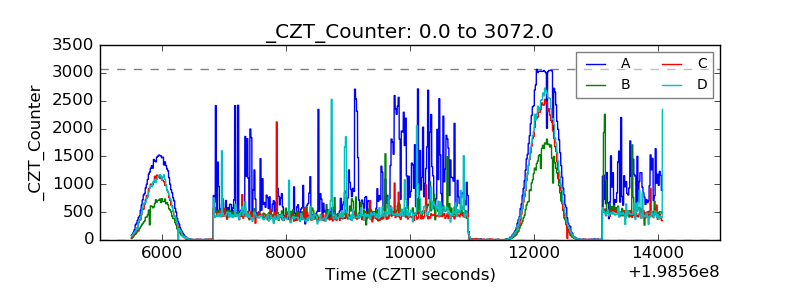 |
| +2.5 Volts monitor | 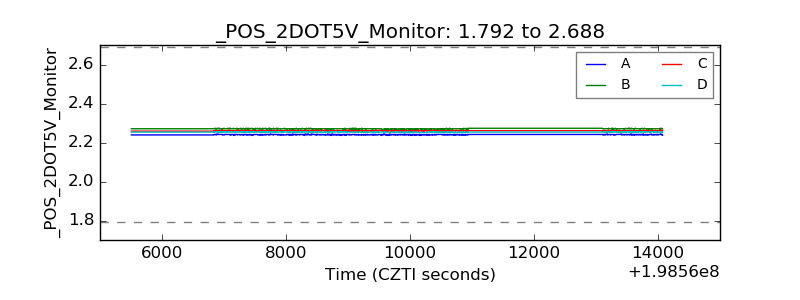 |
| +5 Volts monitor |  |
| _ROLL_ROT | 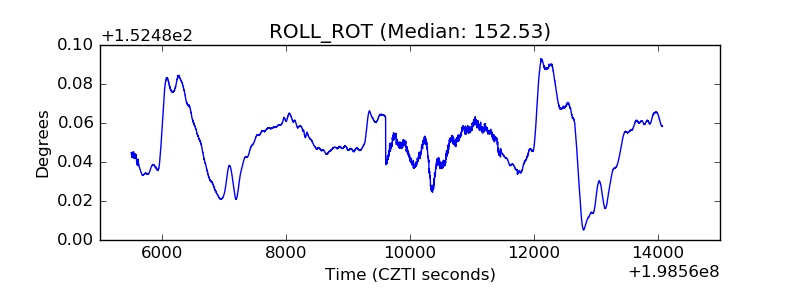 |
| _Roll_DEC | 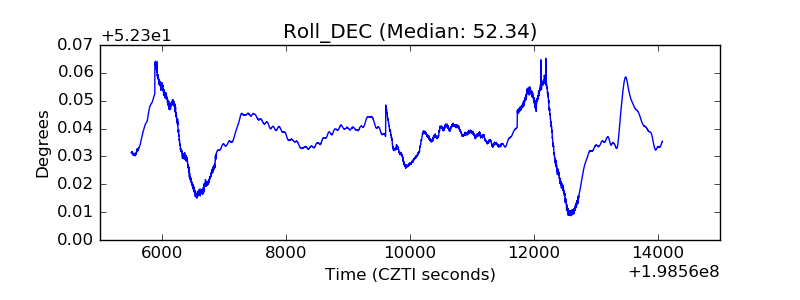 |
| _Roll_RA | 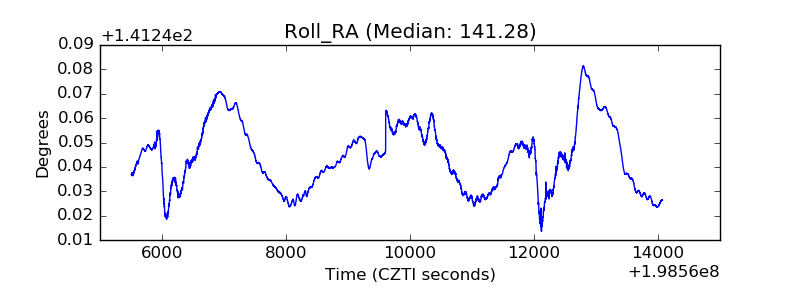 |
| Veto Counter | 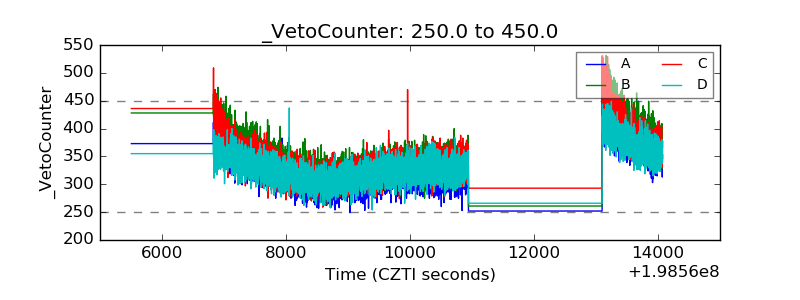 |