| Param | Original file | Final file |
|---|---|---|
| Filename | modeM0/AS1G05_238T05_9000000418_02994cztM0_level2.evt | modeM0/AS1G05_238T05_9000000418_02994cztM0_level2_quad_clean.evt |
| Size (bytes) | 431,432,640 | 61,652,160 |
| Size | 411.4 MB | 58.8 MB |
| Events in quadrant A | 4,776,633 | 373,689 |
| Events in quadrant B | 2,783,581 | 394,596 |
| Events in quadrant C | 2,324,227 | 379,541 |
| Events in quadrant D | 2,833,833 | 359,912 |
| Mode M0 | |||
|---|---|---|---|
| Quadrant | BADHDUFLAG | Total packets | Discarded packets |
| A | 0 | 17714 | 3 |
| B | 0 | 11427 | 2 |
| C | 0 | 10448 | 2 |
| D | 0 | 11786 | 2 |
| Mode M9 | |||
|---|---|---|---|
| Quadrant | BADHDUFLAG | Total packets | Discarded packets |
| A | 0 | 27 | 0 |
| B | 0 | 27 | 0 |
| C | 0 | 27 | 0 |
| D | 0 | 28 | 0 |
| Mode SS | |||
|---|---|---|---|
| Quadrant | BADHDUFLAG | Total packets | Discarded packets |
| A | 0 | 106 | 0 |
| B | 0 | 106 | 0 |
| C | 0 | 106 | 0 |
| D | 0 | 106 | 0 |
| Quadrant | Total seconds | Saturated seconds | Saturation percentage |
|---|---|---|---|
| A | 5116 | 291 | 5.688038% |
| B | 5116 | 63 | 1.231431% |
| C | 5116 | 6 | 0.117279% |
| D | 5116 | 115 | 2.247850% |
Noise dominated data is calculated using 1-second bins in cleaned event files. If a bin has >2000 counts, and if more than 50% of those come from <1% of pixels, then it is considered to be noise-dominated and hence unusable.
| Quadrant | # 1 sec bins | Bins with >0 counts | Bins with >2000 counts | High rate bins dominated by noise | Noise dominated (total time) | Noise dominated (detector-on time) | Marked lightcurve |
|---|---|---|---|---|---|---|---|
| A | 7242 | 5117 | 204 | 204 | 2.82% | 3.99% | 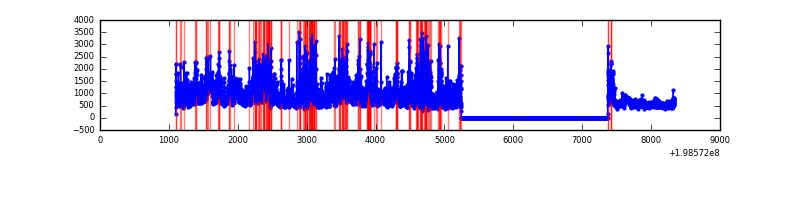 |
| B | 7242 | 5117 | 40 | 40 | 0.55% | 0.78% | 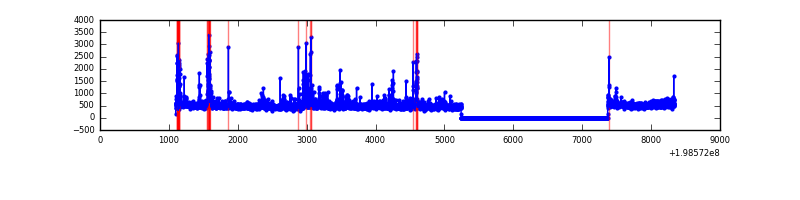 |
| C | 7242 | 5117 | 1 | 1 | 0.01% | 0.02% |  |
| D | 7242 | 5117 | 98 | 98 | 1.35% | 1.92% |  |
Top three noisy pixels from each quadrant. If the there are fewer than three noisy pixels in the level2.evt file, extra rows are filled as -1
| Pixel properties | Quadrant properties | ||||||
|---|---|---|---|---|---|---|---|
| Quadrant | DetID | PixID | Counts | Sigma | Mean | Median | Sigma |
| A | 13 | 9 | 1945460 | 16648.48 | 580 | 569 | 116.8 |
| A | 14 | 238 | 445991 | 3812.86 | 580 | 569 | 116.8 |
| A | 0 | 50 | 47138 | 398.64 | 580 | 569 | 116.8 |
| B | 8 | 3 | 121715 | 1067.2 | 596 | 584 | 113.5 |
| B | 5 | 70 | 111944 | 981.12 | 596 | 584 | 113.5 |
| B | 0 | 219 | 107576 | 942.63 | 596 | 584 | 113.5 |
| C | 6 | 80 | 74050 | 557.12 | 564 | 567 | 131.9 |
| C | 0 | 219 | 28515 | 211.89 | 564 | 567 | 131.9 |
| C | 1 | 192 | 5092 | 34.31 | 564 | 567 | 131.9 |
| D | 9 | 35 | 280465 | 2056.35 | 560 | 543 | 136.1 |
| D | 13 | 114 | 90117 | 658.02 | 560 | 543 | 136.1 |
| D | 7 | 80 | 87625 | 639.72 | 560 | 543 | 136.1 |
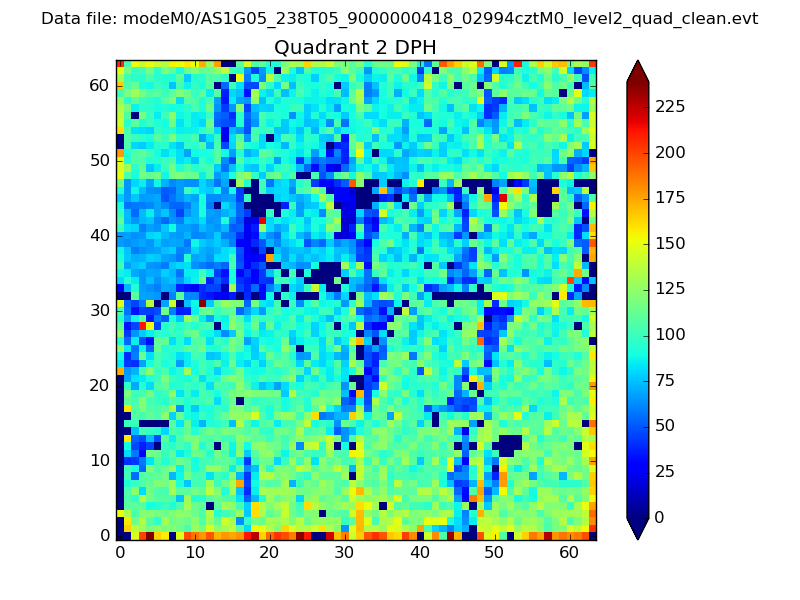
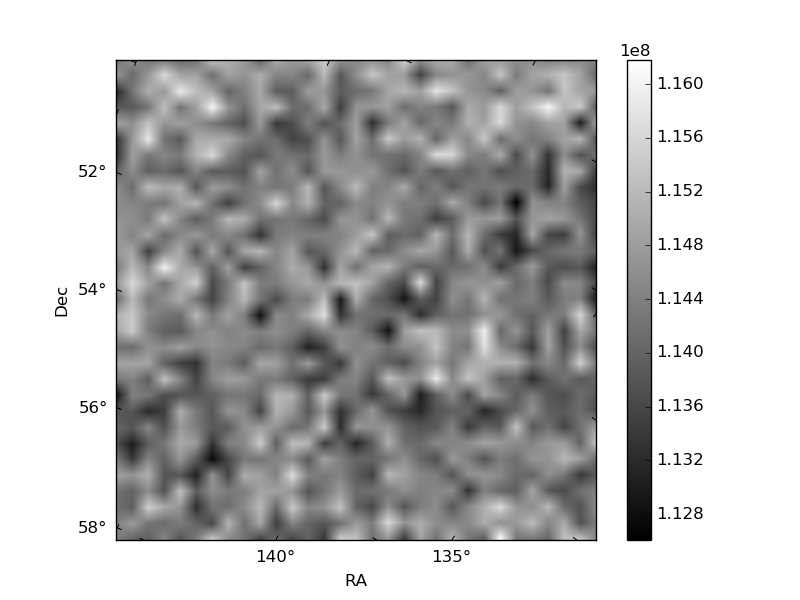
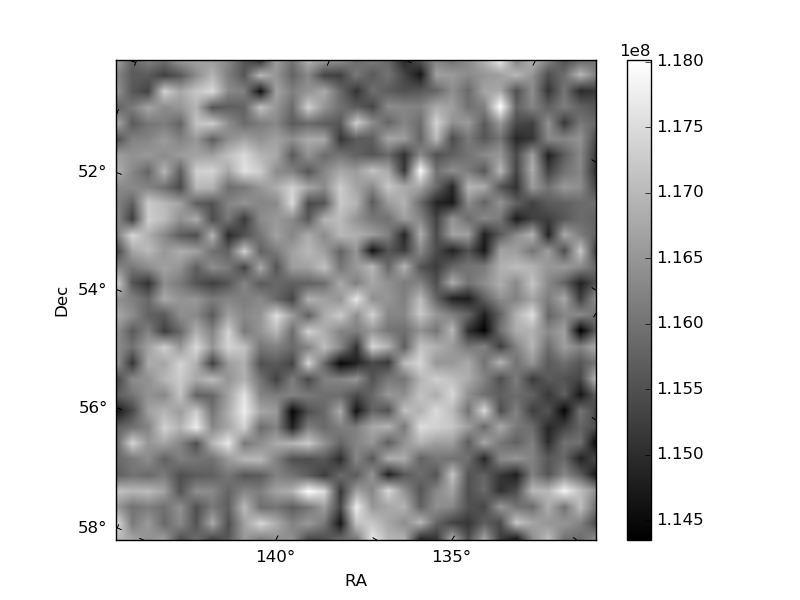
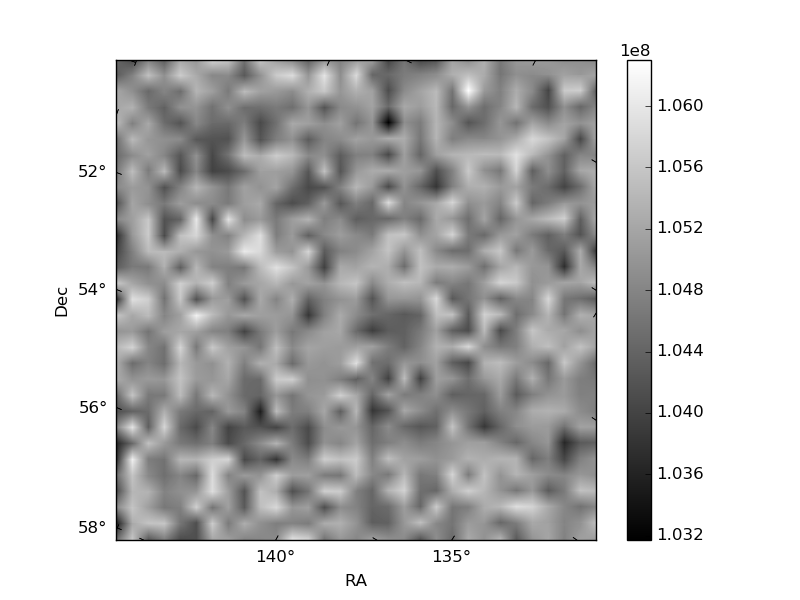
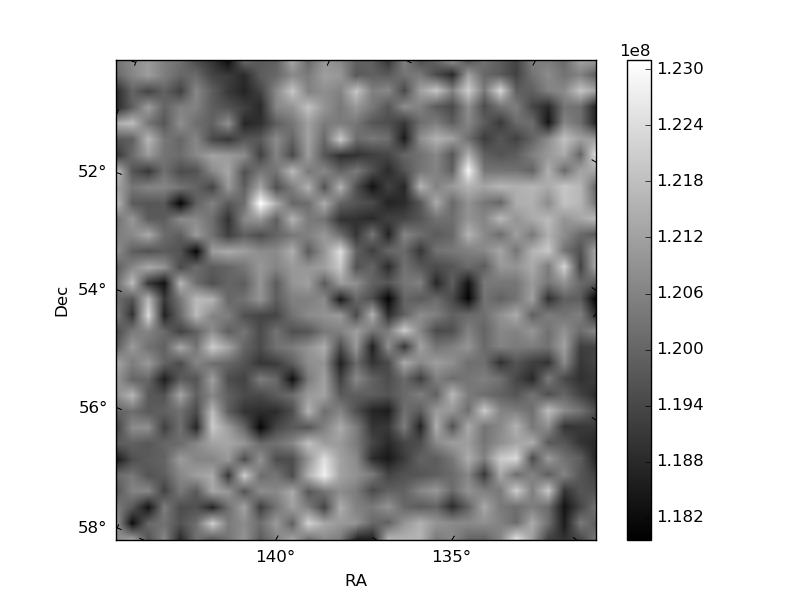
Histogram calculated using DETX and DETY for each event in the final _common_clean file
| Quadrant A | 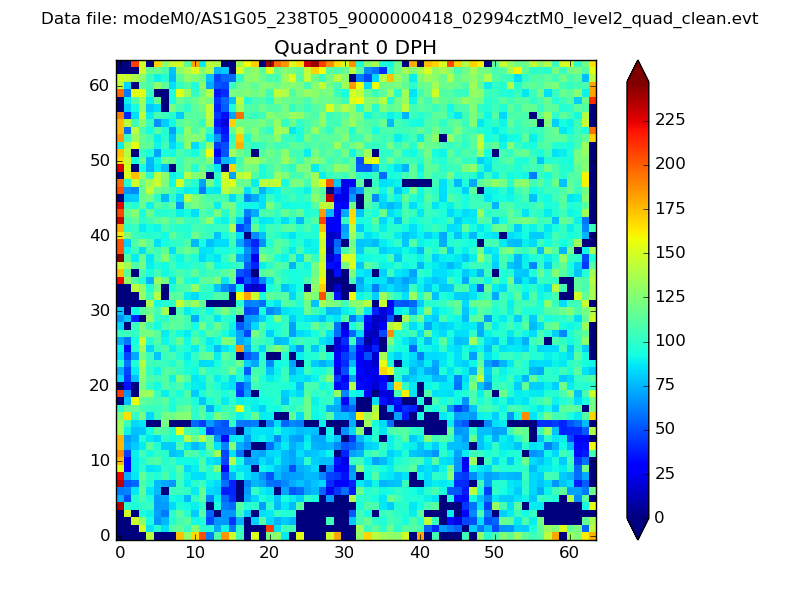 |
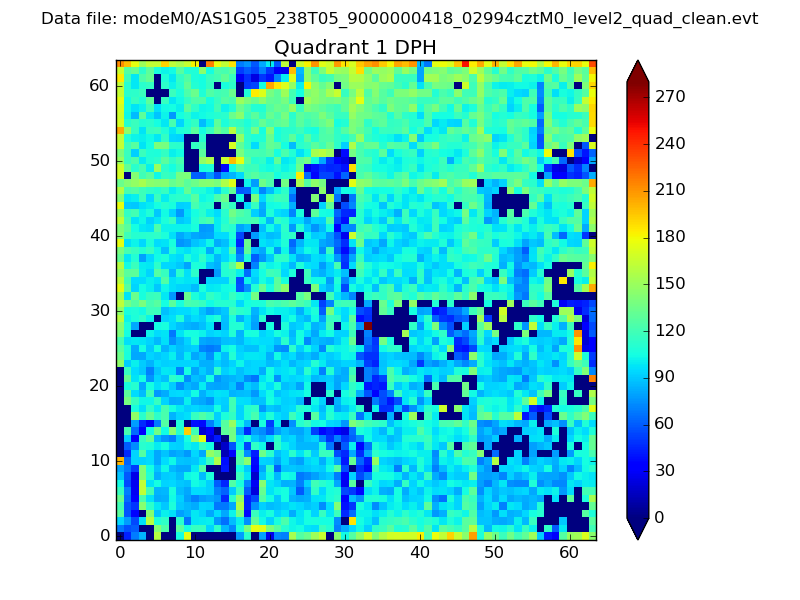 |
Quadrant B |
|---|---|---|---|
| Quadrant D | 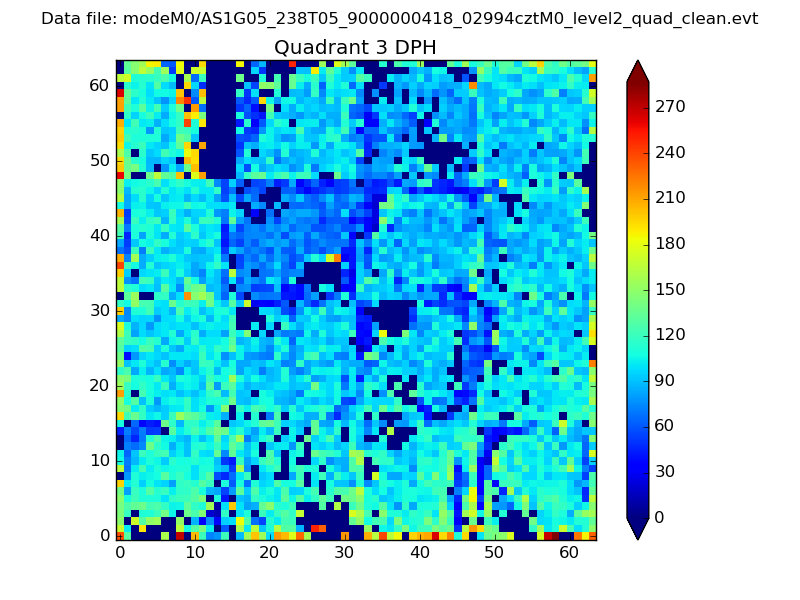 |
 |
Quadrant C |
| Plot type | Count rate plots | Images |
|---|---|---|
| Comparison with Poisson distribution Blue bars denote a histogram of data divided into 1 sec bins. Red curve is a Poisson curve with rate = median count rate of data. |
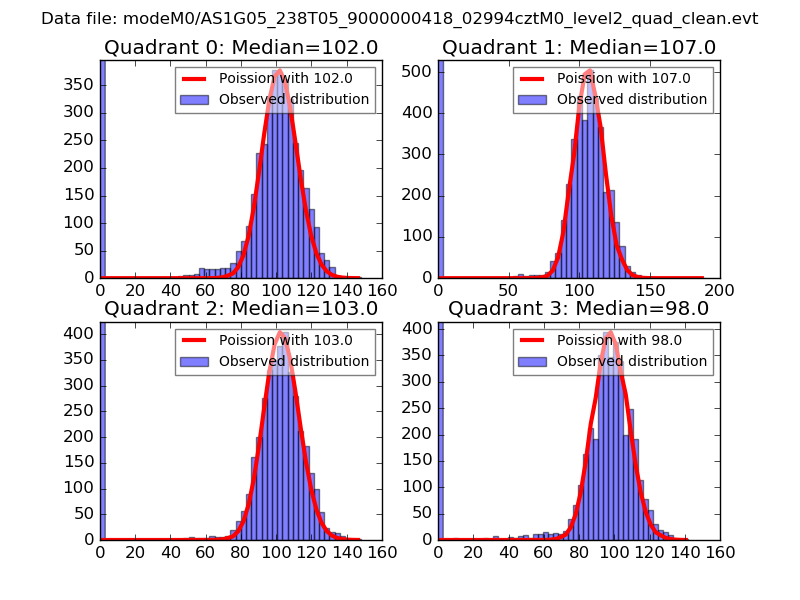 |
 |
| Quadrant-wise count rates Data is divided into 100 sec bins |
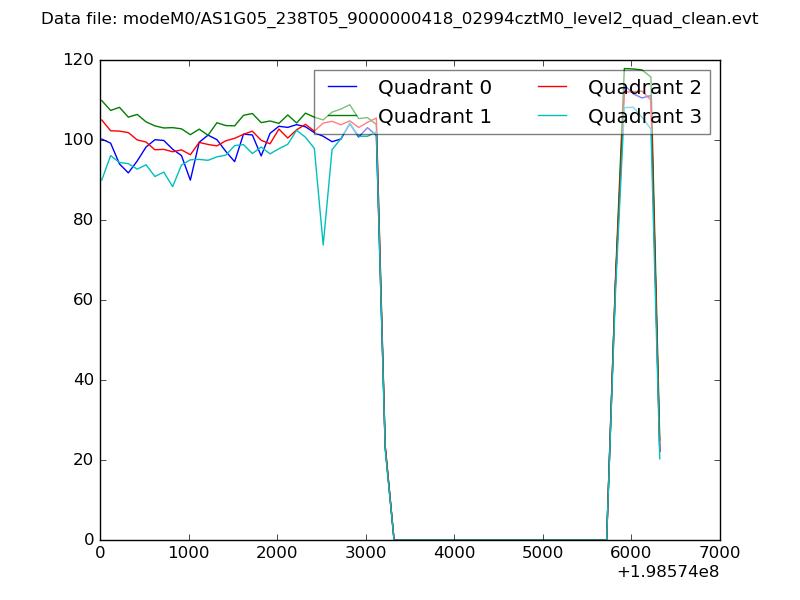 |
|
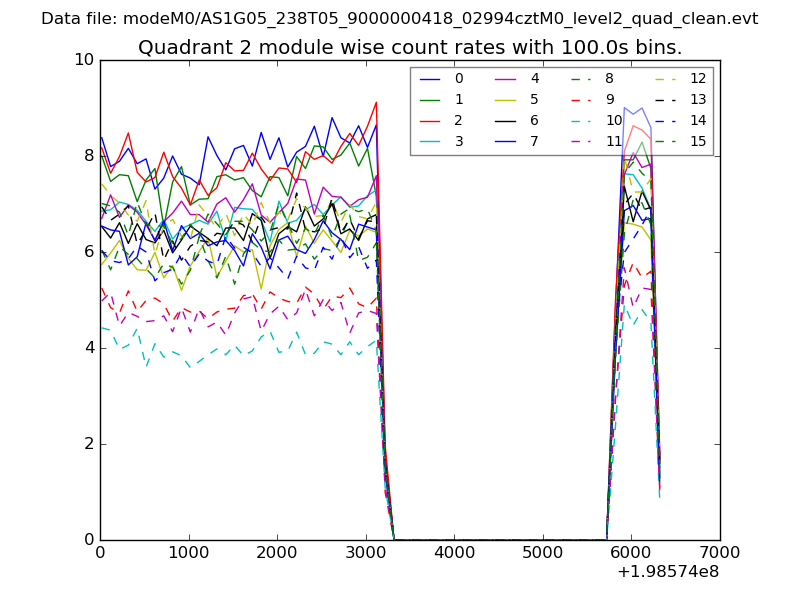
| Module-wise count rates for Quadrant A Data is divided into 100 sec bins |
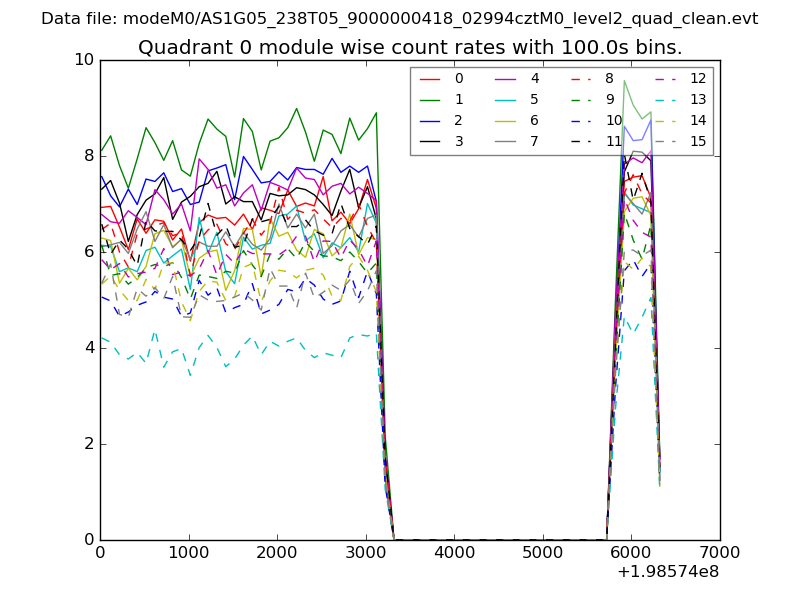 |
 |
| Module-wise count rates for Quadrant B Data is divided into 100 sec bins |
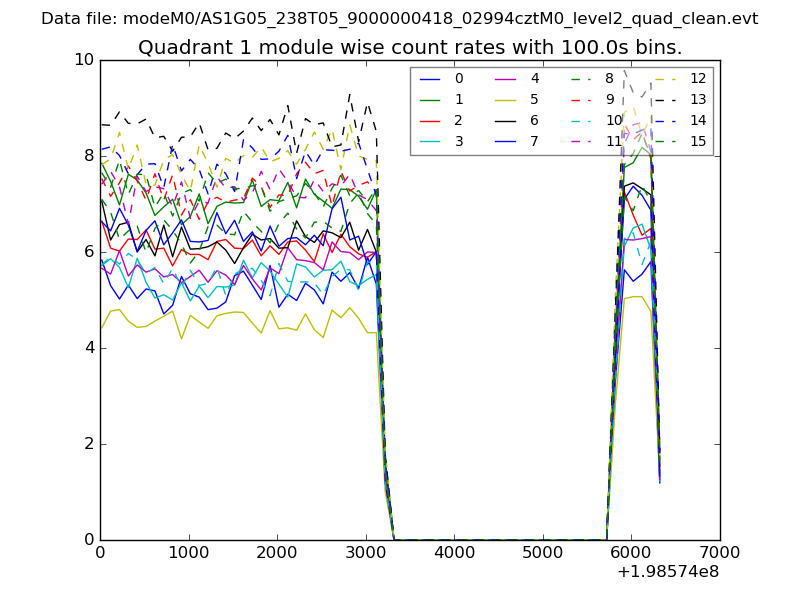 |
 |
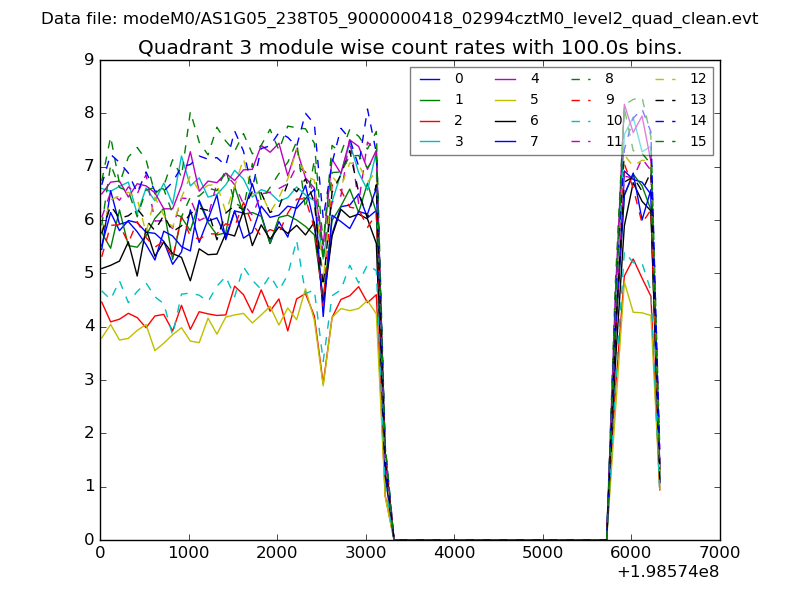
| Module-wise count rates for Quadrant C Data is divided into 100 sec bins |
 |
 |
| Module-wise count rates for Quadrant D Data is divided into 100 sec bins |
 |
 |
| Parameter | Plot |
|---|---|
| CZT HV Monitor | 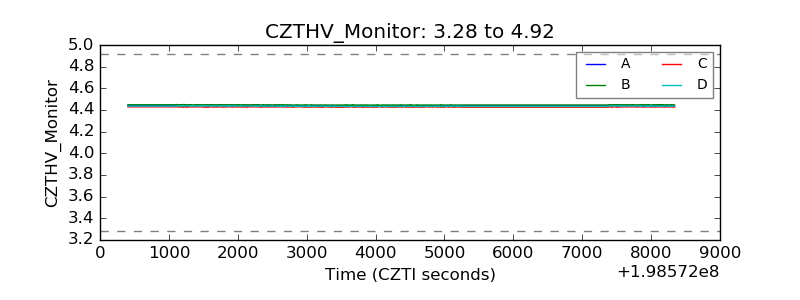 |
| D_VDD | 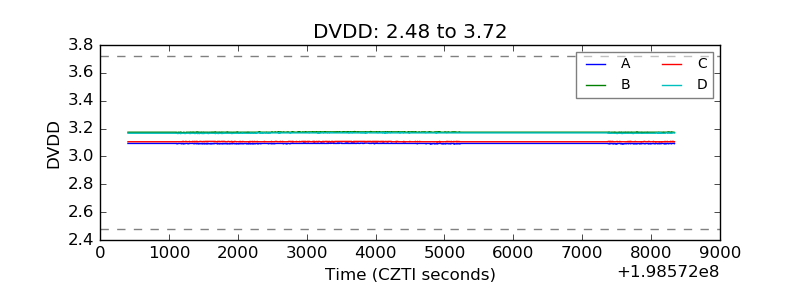 |
| Temperature 1 | 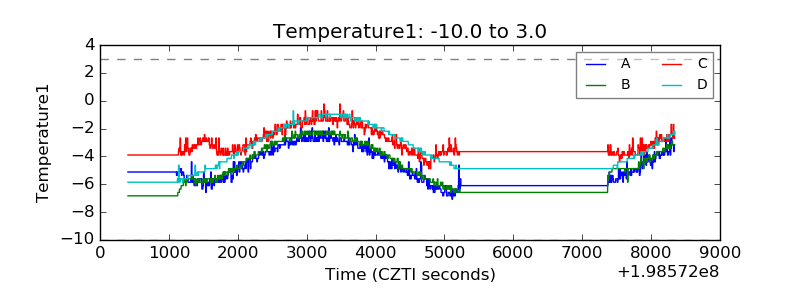 |
| Veto HV Monitor | 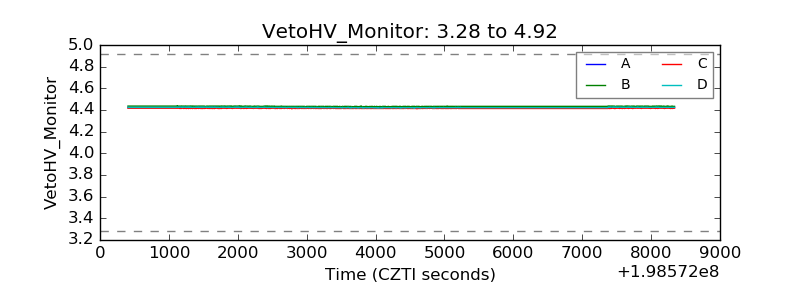 |
| Veto LLD | 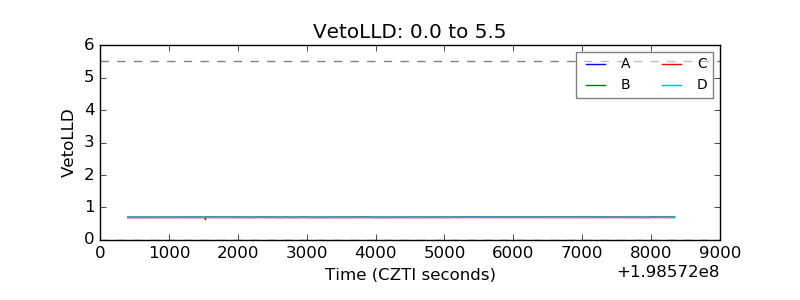 |
| Alpha Counter | 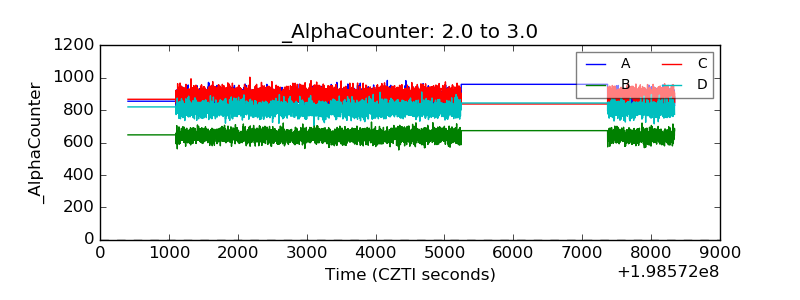 |
| _CPM_Rate | 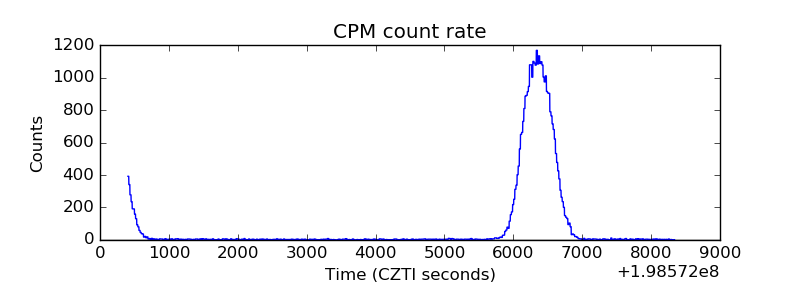 |
| CZT Counter |  |
| +2.5 Volts monitor | 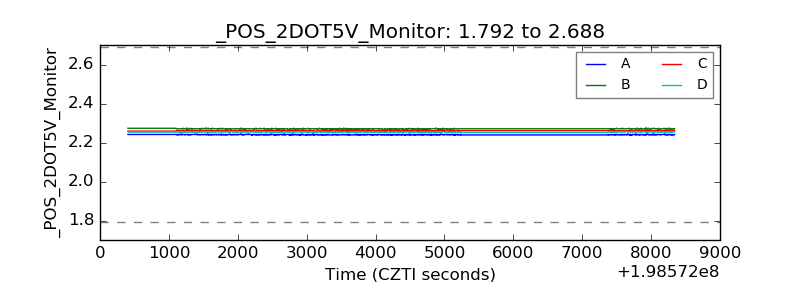 |
| +5 Volts monitor |  |
| _ROLL_ROT | 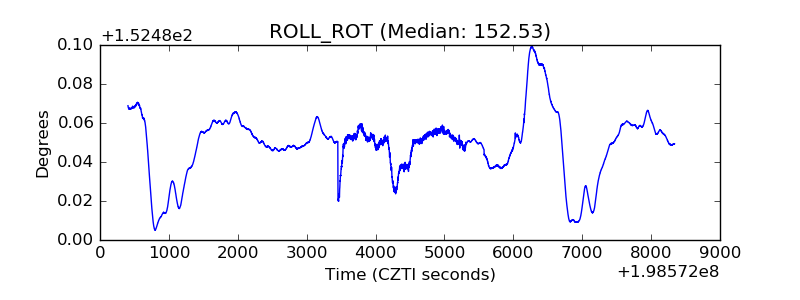 |
| _Roll_DEC | 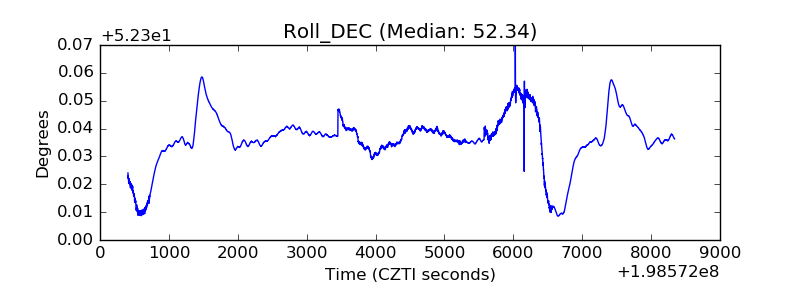 |
| _Roll_RA | 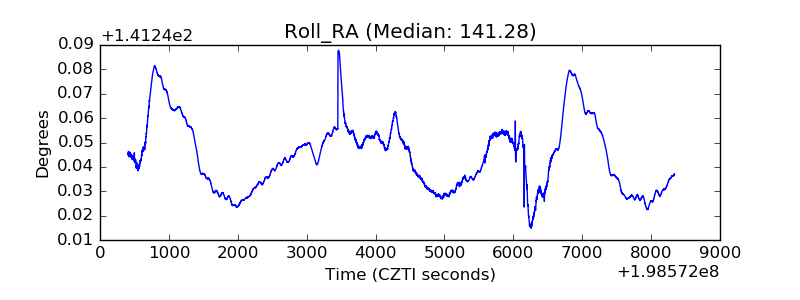 |
| Veto Counter | 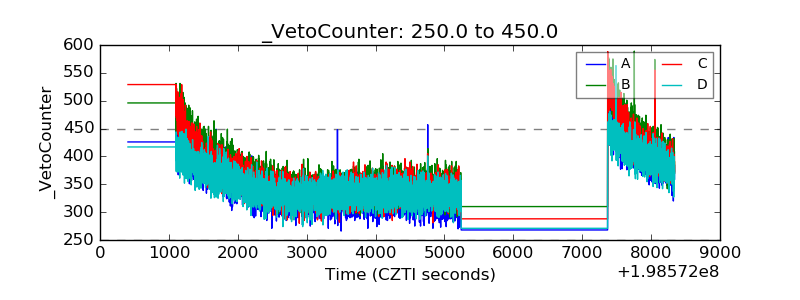 |