| Param | Original file | Final file |
|---|---|---|
| Filename | modeM0/AS1G05_238T05_9000000418_02996cztM0_level2.evt | modeM0/AS1G05_238T05_9000000418_02996cztM0_level2_quad_clean.evt |
| Size (bytes) | 544,455,360 | 77,783,040 |
| Size | 519.2 MB | 74.2 MB |
| Events in quadrant A | 4,728,619 | 511,810 |
| Events in quadrant B | 6,106,217 | 462,564 |
| Events in quadrant C | 2,548,859 | 521,404 |
| Events in quadrant D | 2,762,083 | 503,789 |
| Mode M0 | |||
|---|---|---|---|
| Quadrant | BADHDUFLAG | Total packets | Discarded packets |
| A | 0 | 17491 | 2 |
| B | 0 | 21605 | 1 |
| C | 0 | 10788 | 1 |
| D | 0 | 11574 | 1 |
| Mode M9 | |||
|---|---|---|---|
| Quadrant | BADHDUFLAG | Total packets | Discarded packets |
| A | 0 | 22 | 0 |
| B | 0 | 22 | 0 |
| C | 0 | 22 | 0 |
| D | 0 | 22 | 0 |
| Mode SS | |||
|---|---|---|---|
| Quadrant | BADHDUFLAG | Total packets | Discarded packets |
| A | 0 | 102 | 0 |
| B | 0 | 102 | 0 |
| C | 0 | 102 | 0 |
| D | 0 | 102 | 0 |
| Quadrant | Total seconds | Saturated seconds | Saturation percentage |
|---|---|---|---|
| A | 5069 | 448 | 8.838035% |
| B | 5069 | 1327 | 26.178733% |
| C | 5069 | 29 | 0.572105% |
| D | 5069 | 73 | 1.440126% |
Noise dominated data is calculated using 1-second bins in cleaned event files. If a bin has >2000 counts, and if more than 50% of those come from <1% of pixels, then it is considered to be noise-dominated and hence unusable.
| Quadrant | # 1 sec bins | Bins with >0 counts | Bins with >2000 counts | High rate bins dominated by noise | Noise dominated (total time) | Noise dominated (detector-on time) | Marked lightcurve |
|---|---|---|---|---|---|---|---|
| A | 7196 | 5070 | 365 | 365 | 5.07% | 7.20% | 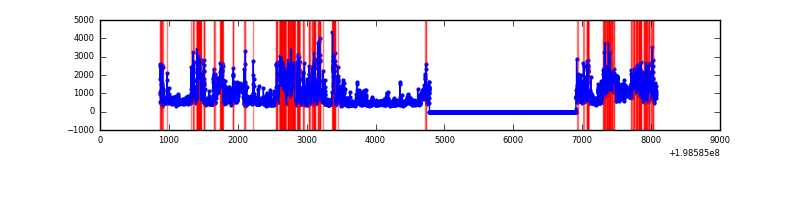 |
| B | 7196 | 5070 | 1214 | 1214 | 16.87% | 23.94% | 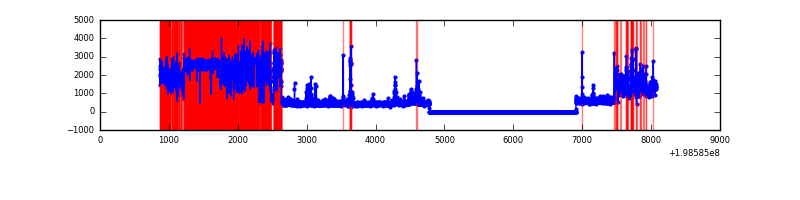 |
| C | 7196 | 5070 | 25 | 25 | 0.35% | 0.49% | 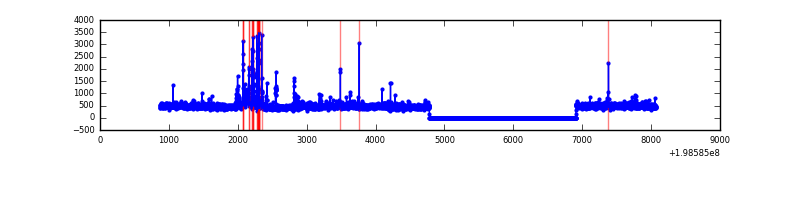 |
| D | 7196 | 5070 | 68 | 68 | 0.94% | 1.34% |  |
Top three noisy pixels from each quadrant. If the there are fewer than three noisy pixels in the level2.evt file, extra rows are filled as -1
| Pixel properties | Quadrant properties | ||||||
|---|---|---|---|---|---|---|---|
| Quadrant | DetID | PixID | Counts | Sigma | Mean | Median | Sigma |
| A | 13 | 9 | 1786746 | 15568.15 | 564 | 554 | 114.7 |
| A | 14 | 249 | 632089 | 5504.35 | 564 | 554 | 114.7 |
| A | 12 | 247 | 44033 | 378.96 | 564 | 554 | 114.7 |
| B | 15 | 204 | 3719942 | 37604.23 | 521 | 509 | 98.9 |
| B | 2 | 249 | 165202 | 1665.08 | 521 | 509 | 98.9 |
| B | 0 | 219 | 84967 | 853.89 | 521 | 509 | 98.9 |
| C | 0 | 219 | 266808 | 2055.95 | 559 | 562 | 129.5 |
| C | 6 | 80 | 34514 | 262.18 | 559 | 562 | 129.5 |
| C | 1 | 192 | 25890 | 195.58 | 559 | 562 | 129.5 |
| D | 7 | 80 | 110337 | 810.98 | 560 | 543 | 135.4 |
| D | 13 | 114 | 89538 | 657.35 | 560 | 543 | 135.4 |
| D | 12 | 1 | 68892 | 504.85 | 560 | 543 | 135.4 |
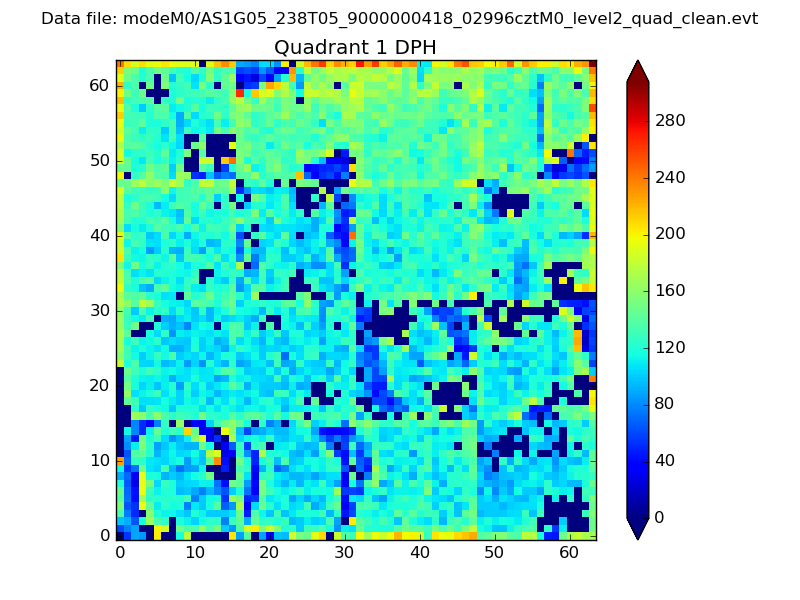
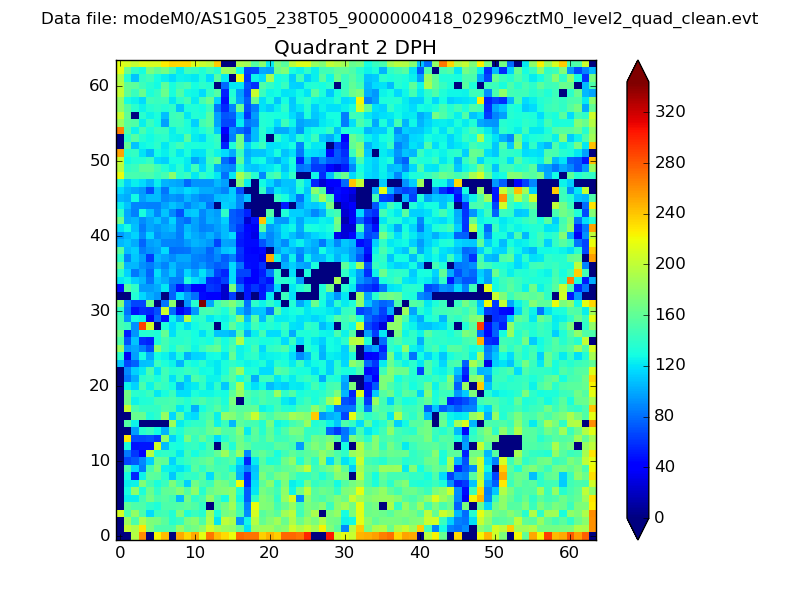
Histogram calculated using DETX and DETY for each event in the final _common_clean file
| Quadrant A | 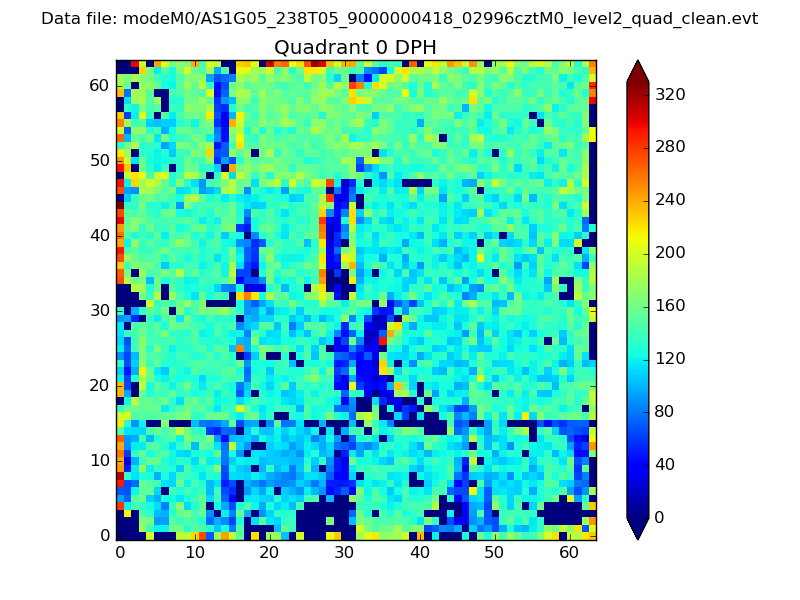 |
 |
Quadrant B |
|---|---|---|---|
| Quadrant D | 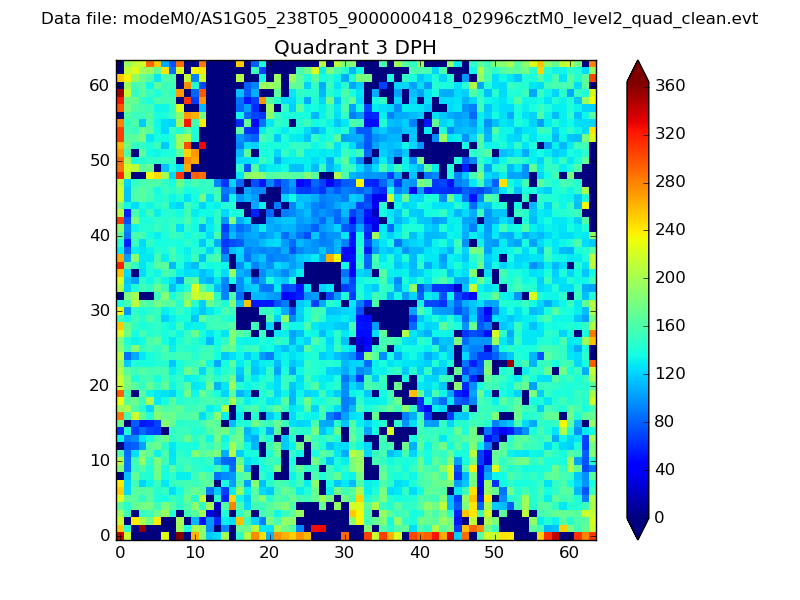 |
 |
Quadrant C |
| Plot type | Count rate plots | Images |
|---|---|---|
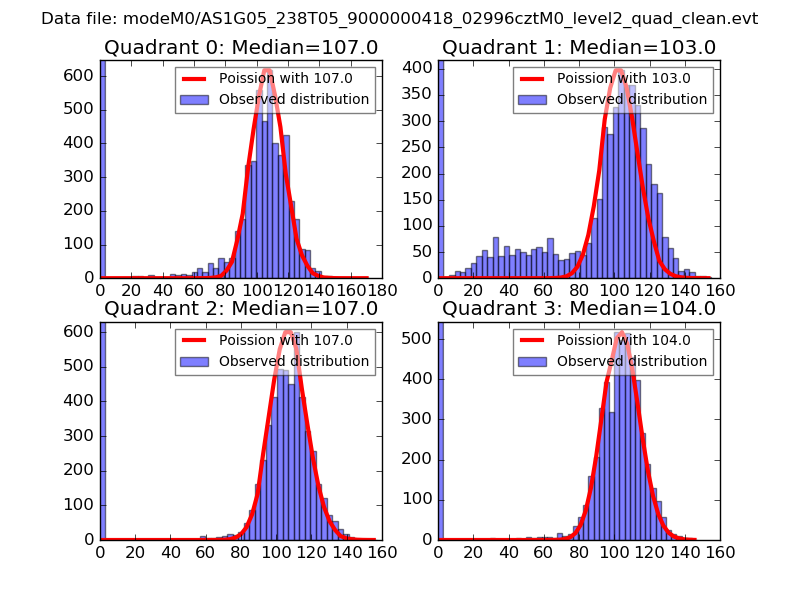
| Comparison with Poisson distribution Blue bars denote a histogram of data divided into 1 sec bins. Red curve is a Poisson curve with rate = median count rate of data. |
 |
 |
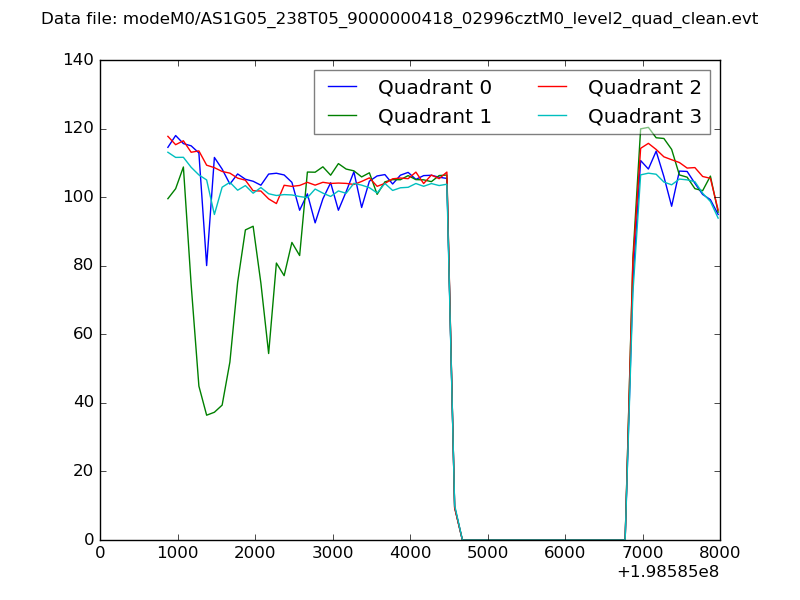
| Quadrant-wise count rates Data is divided into 100 sec bins |
 |
|
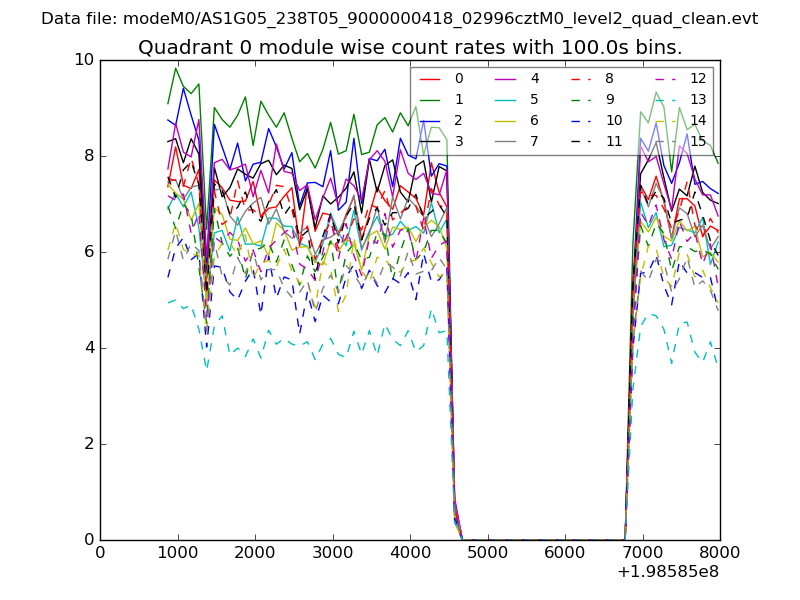
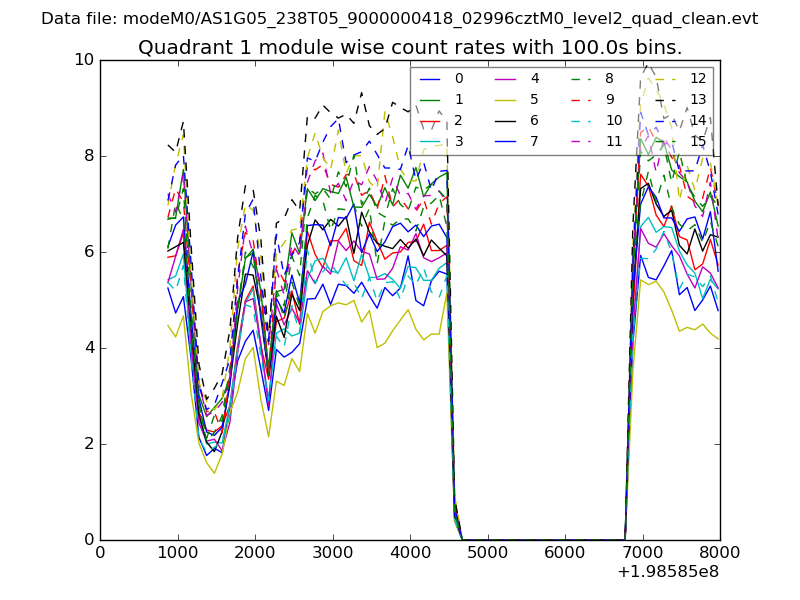
| Module-wise count rates for Quadrant A Data is divided into 100 sec bins |
 |
 |
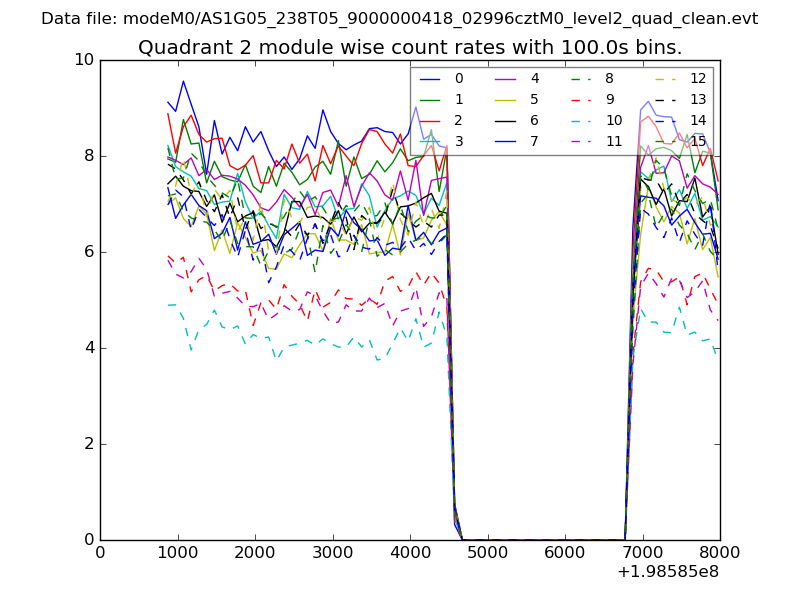
| Module-wise count rates for Quadrant B Data is divided into 100 sec bins |
 |
 |
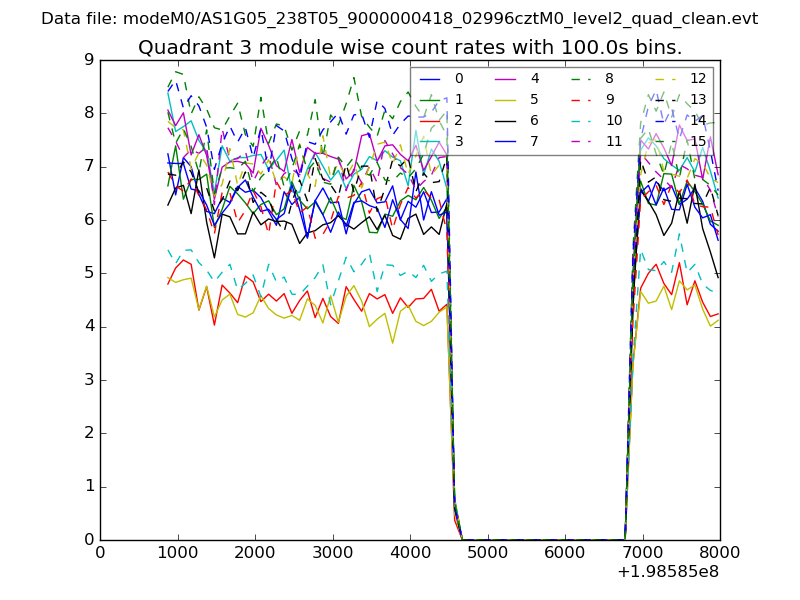
| Module-wise count rates for Quadrant C Data is divided into 100 sec bins |
 |
 |
| Module-wise count rates for Quadrant D Data is divided into 100 sec bins |
 |
 |
| Parameter | Plot |
|---|---|
| CZT HV Monitor | 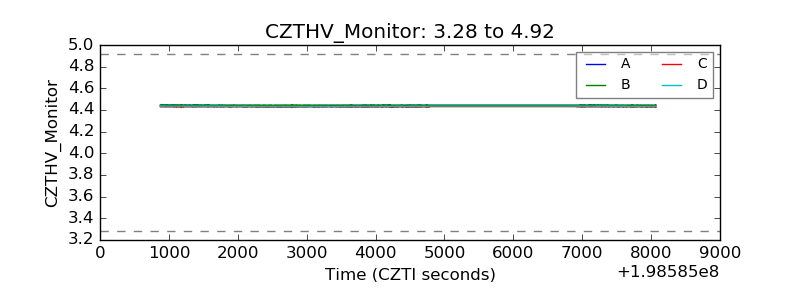 |
| D_VDD | 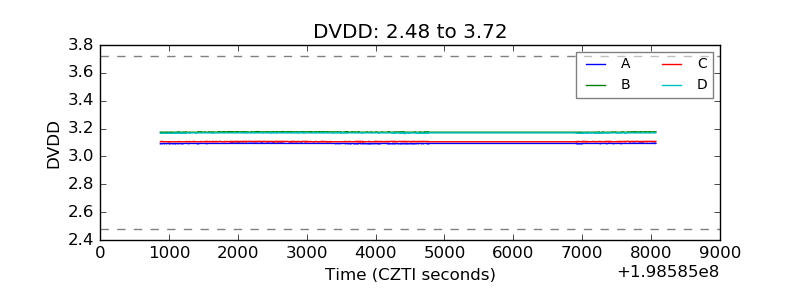 |
| Temperature 1 | 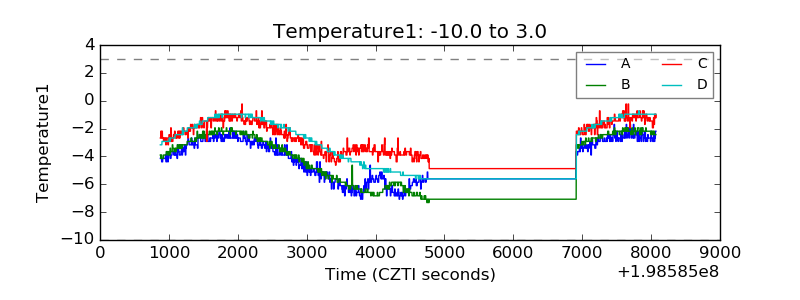 |
| Veto HV Monitor | 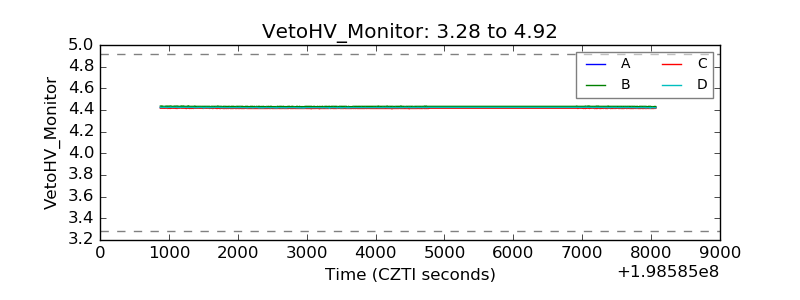 |
| Veto LLD | 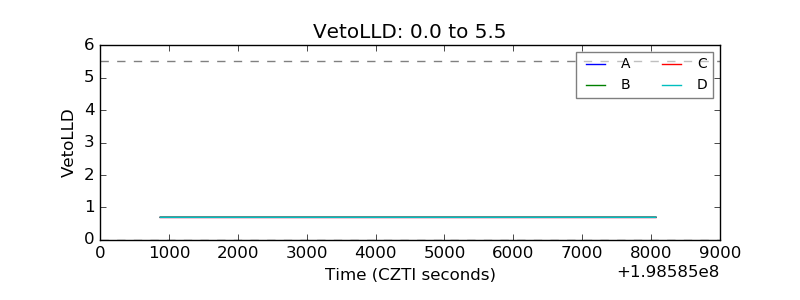 |
| Alpha Counter | 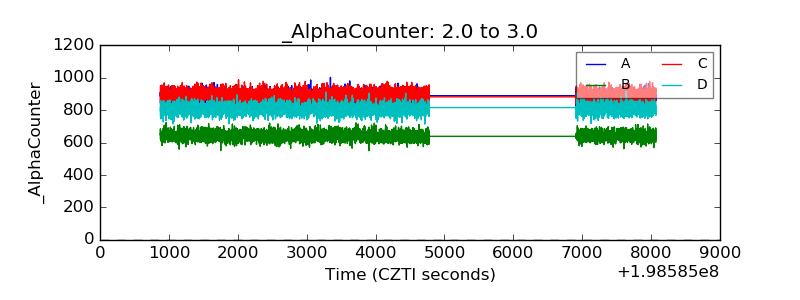 |
| _CPM_Rate | 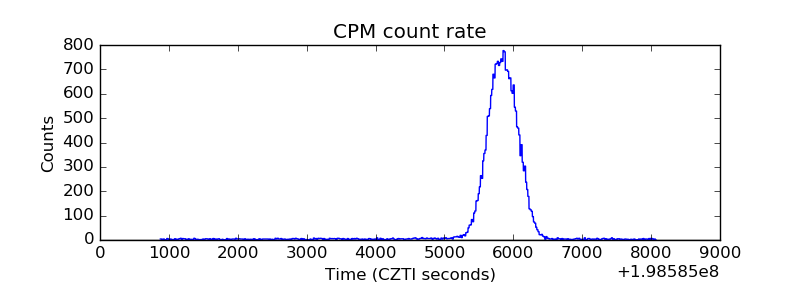 |
| CZT Counter | 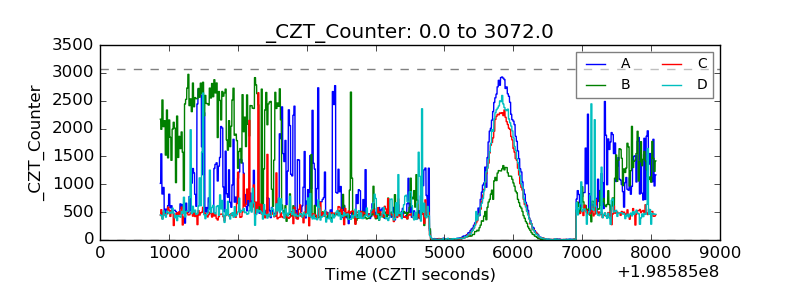 |
| +2.5 Volts monitor |  |
| +5 Volts monitor |  |
| _ROLL_ROT | 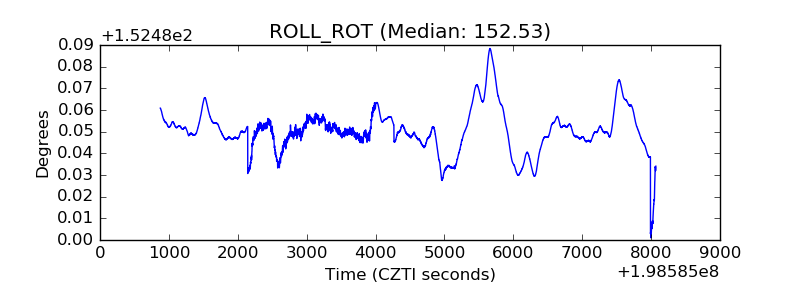 |
| _Roll_DEC | 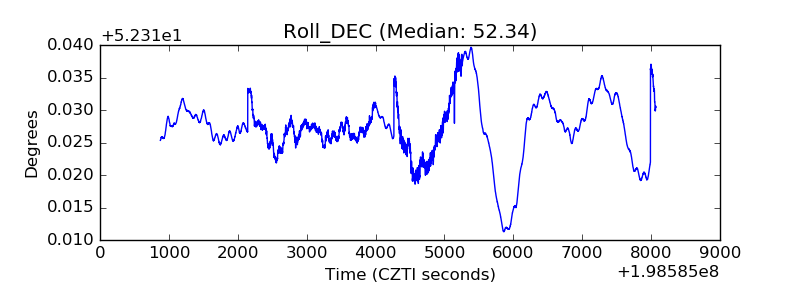 |
| _Roll_RA | 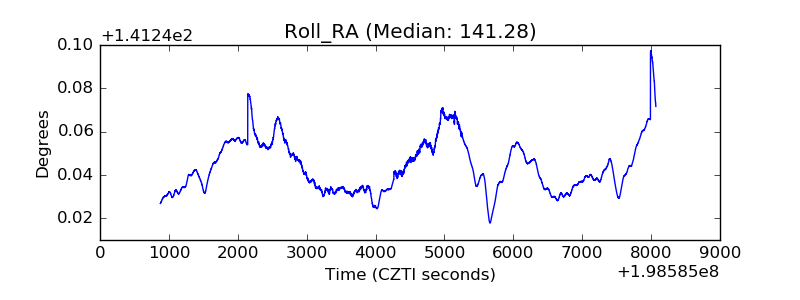 |
| Veto Counter | 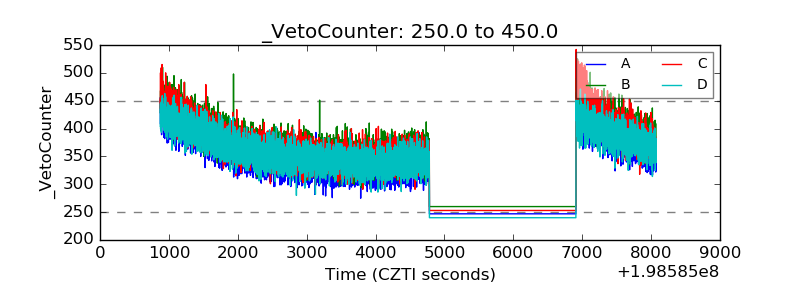 |