| Param | Original file | Final file |
|---|---|---|
| Filename | modeM0/AS1G05_238T05_9000000418_02997cztM0_level2.evt | modeM0/AS1G05_238T05_9000000418_02997cztM0_level2_quad_clean.evt |
| Size (bytes) | 516,654,720 | 68,279,040 |
| Size | 492.7 MB | 65.1 MB |
| Events in quadrant A | 4,864,303 | 429,147 |
| Events in quadrant B | 5,749,250 | 419,911 |
| Events in quadrant C | 2,294,793 | 443,821 |
| Events in quadrant D | 2,408,268 | 431,576 |
| Mode M0 | |||
|---|---|---|---|
| Quadrant | BADHDUFLAG | Total packets | Discarded packets |
| A | 0 | 17824 | 2 |
| B | 0 | 20415 | 1 |
| C | 0 | 10141 | 1 |
| D | 0 | 10649 | 4 |
| Mode M9 | |||
|---|---|---|---|
| Quadrant | BADHDUFLAG | Total packets | Discarded packets |
| A | 0 | 22 | 0 |
| B | 0 | 22 | 0 |
| C | 0 | 22 | 0 |
| D | 0 | 22 | 0 |
| Mode SS | |||
|---|---|---|---|
| Quadrant | BADHDUFLAG | Total packets | Discarded packets |
| A | 0 | 100 | 0 |
| B | 0 | 100 | 0 |
| C | 0 | 100 | 0 |
| D | 0 | 100 | 0 |
| Quadrant | Total seconds | Saturated seconds | Saturation percentage |
|---|---|---|---|
| A | 4881 | 469 | 9.608687% |
| B | 4881 | 664 | 13.603770% |
| C | 4881 | 7 | 0.143413% |
| D | 4880 | 51 | 1.045082% |
Noise dominated data is calculated using 1-second bins in cleaned event files. If a bin has >2000 counts, and if more than 50% of those come from <1% of pixels, then it is considered to be noise-dominated and hence unusable.
| Quadrant | # 1 sec bins | Bins with >0 counts | Bins with >2000 counts | High rate bins dominated by noise | Noise dominated (total time) | Noise dominated (detector-on time) | Marked lightcurve |
|---|---|---|---|---|---|---|---|
| A | 7039 | 4883 | 352 | 352 | 5.00% | 7.21% | 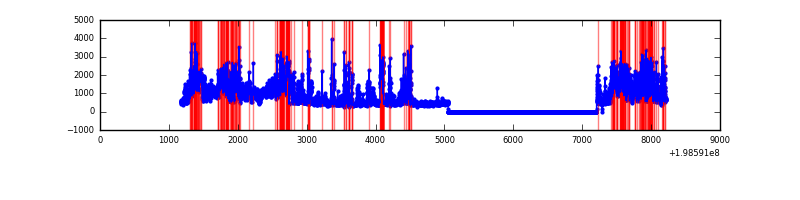 |
| B | 7039 | 4883 | 675 | 675 | 9.59% | 13.82% | 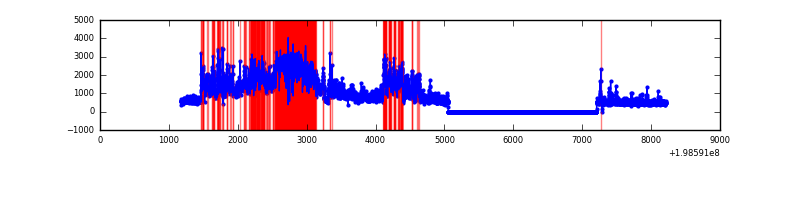 |
| C | 7039 | 4883 | 8 | 8 | 0.11% | 0.16% | 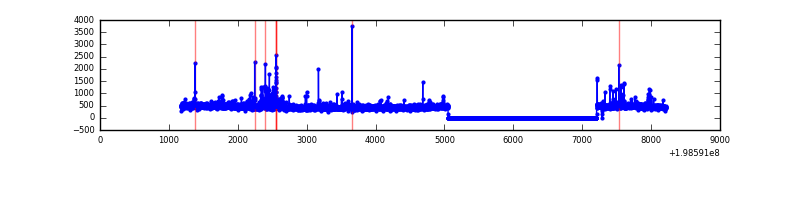 |
| D | 7038 | 4882 | 41 | 41 | 0.58% | 0.84% | 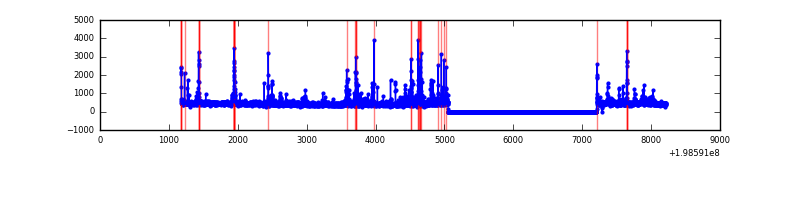 |
Top three noisy pixels from each quadrant. If the there are fewer than three noisy pixels in the level2.evt file, extra rows are filled as -1
| Pixel properties | Quadrant properties | ||||||
|---|---|---|---|---|---|---|---|
| Quadrant | DetID | PixID | Counts | Sigma | Mean | Median | Sigma |
| A | 14 | 249 | 1645138 | 15259.95 | 526 | 516 | 107.8 |
| A | 13 | 9 | 1135279 | 10529.12 | 526 | 516 | 107.8 |
| A | 14 | 63 | 12670 | 112.77 | 526 | 516 | 107.8 |
| B | 15 | 204 | 3276185 | 32794.15 | 527 | 516 | 99.9 |
| B | 8 | 3 | 215170 | 2148.99 | 527 | 516 | 99.9 |
| B | 2 | 249 | 95040 | 946.32 | 527 | 516 | 99.9 |
| C | 0 | 219 | 84629 | 684.66 | 527 | 528 | 122.8 |
| C | 1 | 192 | 68622 | 554.35 | 527 | 528 | 122.8 |
| C | 6 | 80 | 57444 | 463.35 | 527 | 528 | 122.8 |
| D | 13 | 239 | 76993 | 595.44 | 527 | 510 | 128.4 |
| D | 13 | 114 | 47726 | 367.59 | 527 | 510 | 128.4 |
| D | 2 | 136 | 44216 | 340.26 | 527 | 510 | 128.4 |
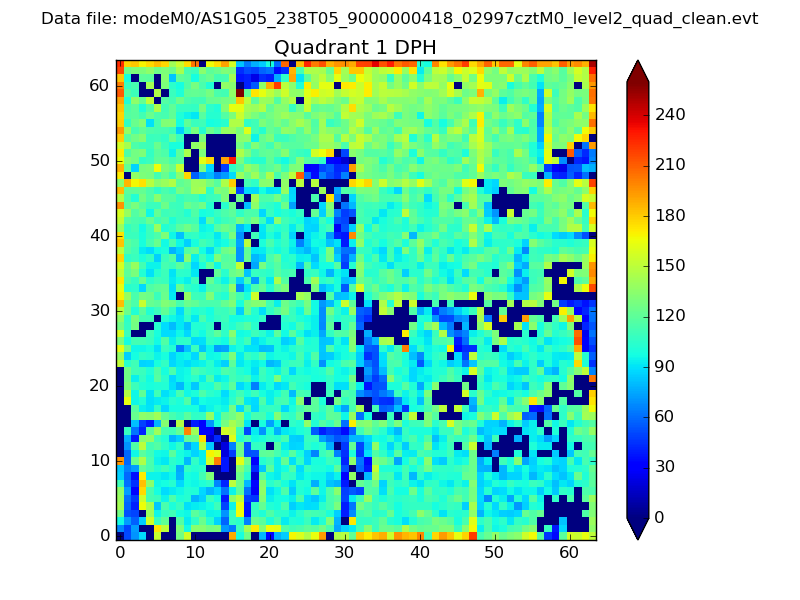
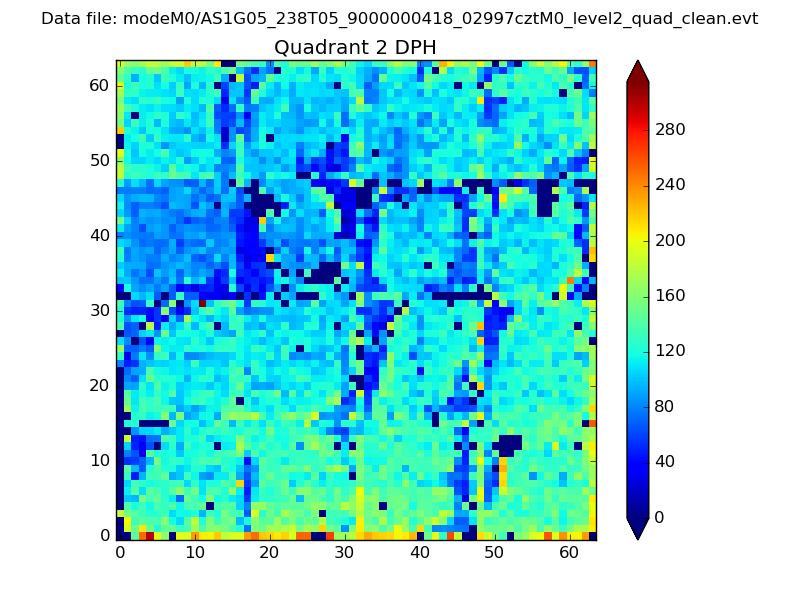
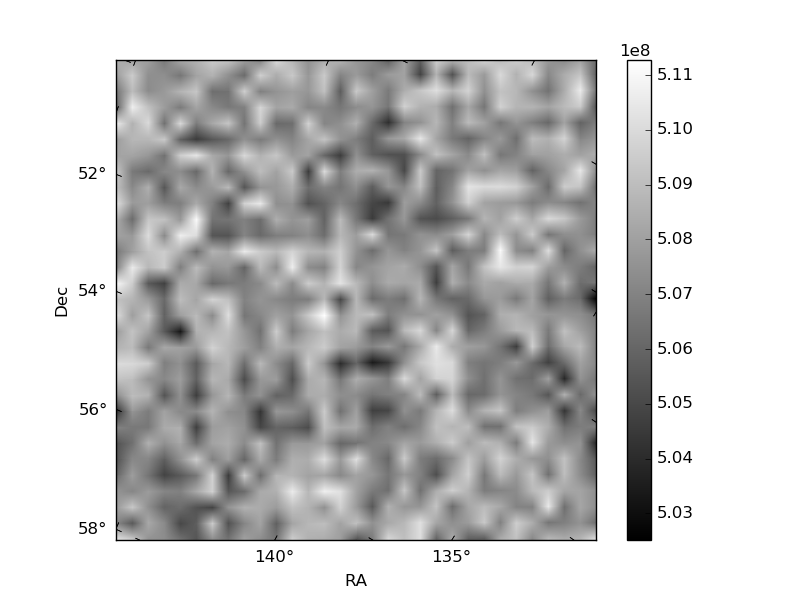
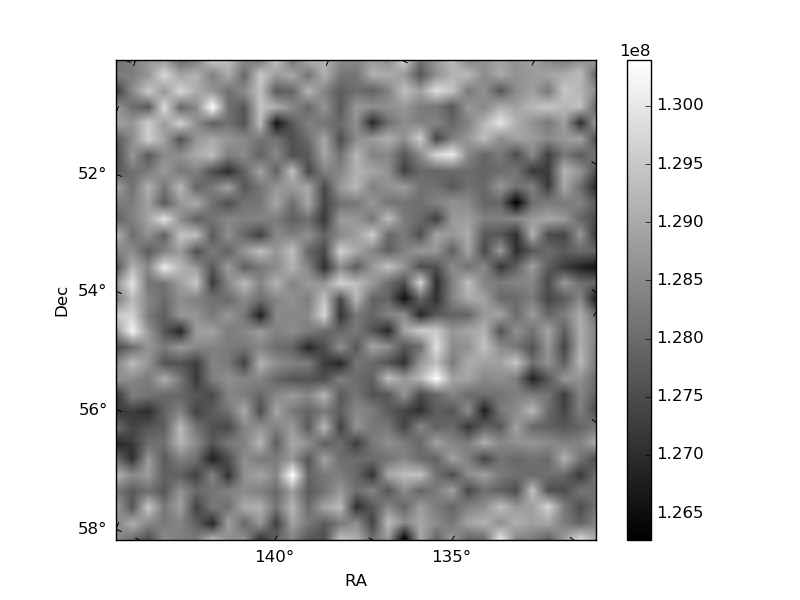
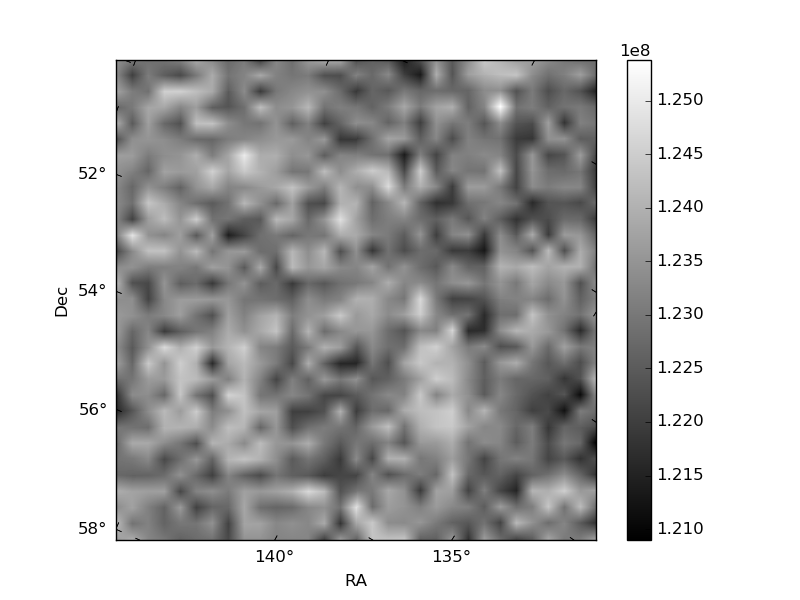
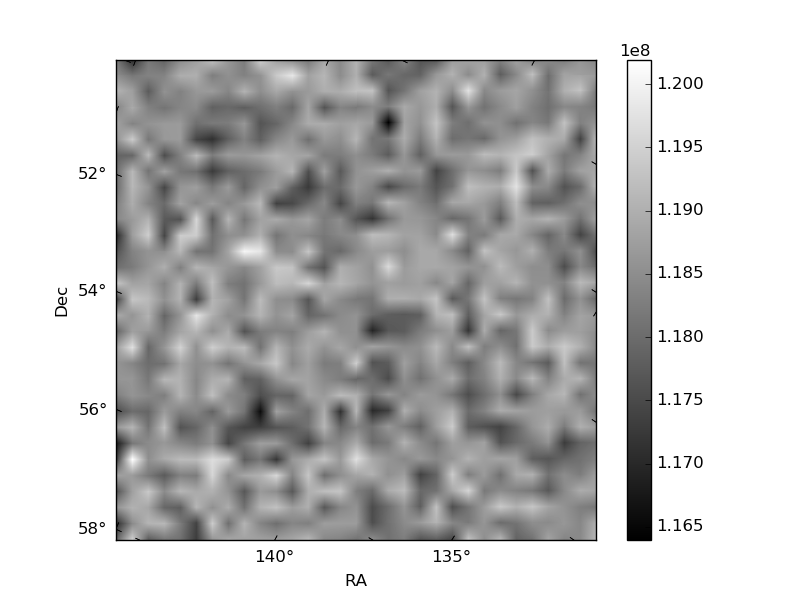
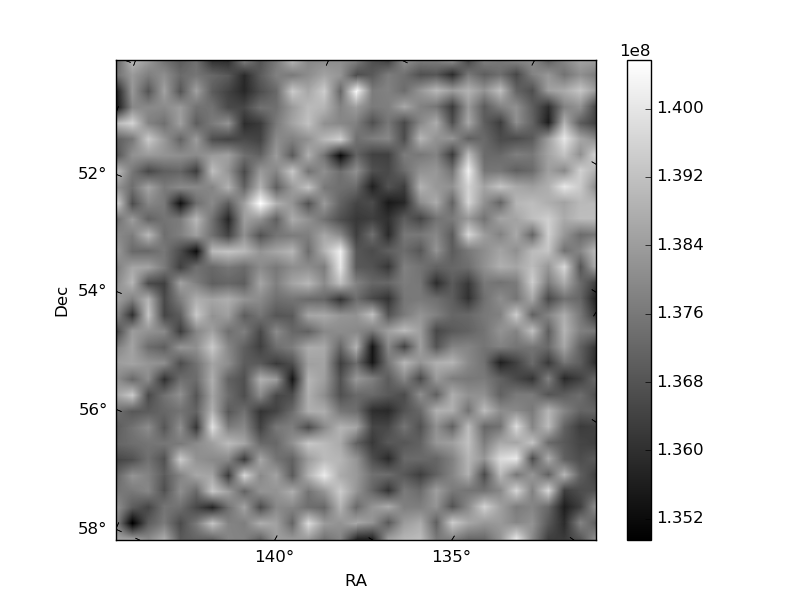
Histogram calculated using DETX and DETY for each event in the final _common_clean file
| Quadrant A |  |
 |
Quadrant B |
|---|---|---|---|
| Quadrant D | 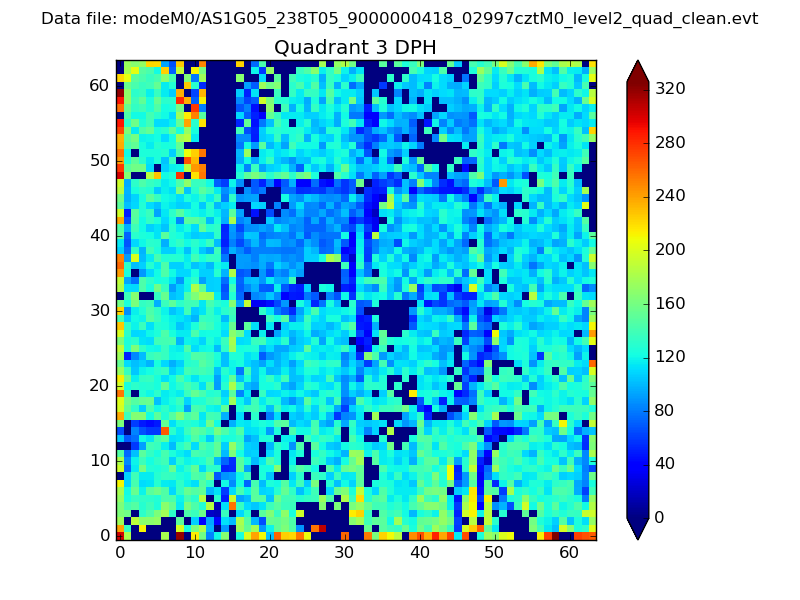 |
 |
Quadrant C |
| Plot type | Count rate plots | Images |
|---|---|---|
| Comparison with Poisson distribution Blue bars denote a histogram of data divided into 1 sec bins. Red curve is a Poisson curve with rate = median count rate of data. |
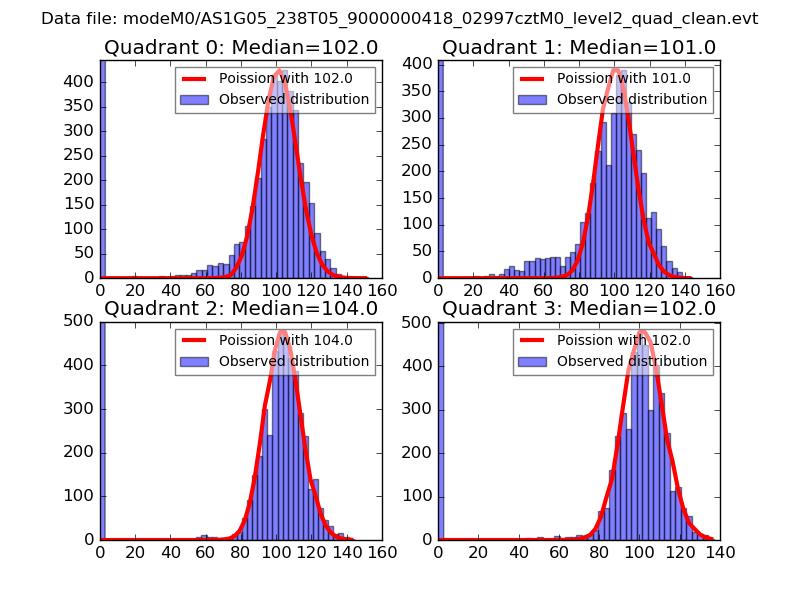 |
 |
| Quadrant-wise count rates Data is divided into 100 sec bins |
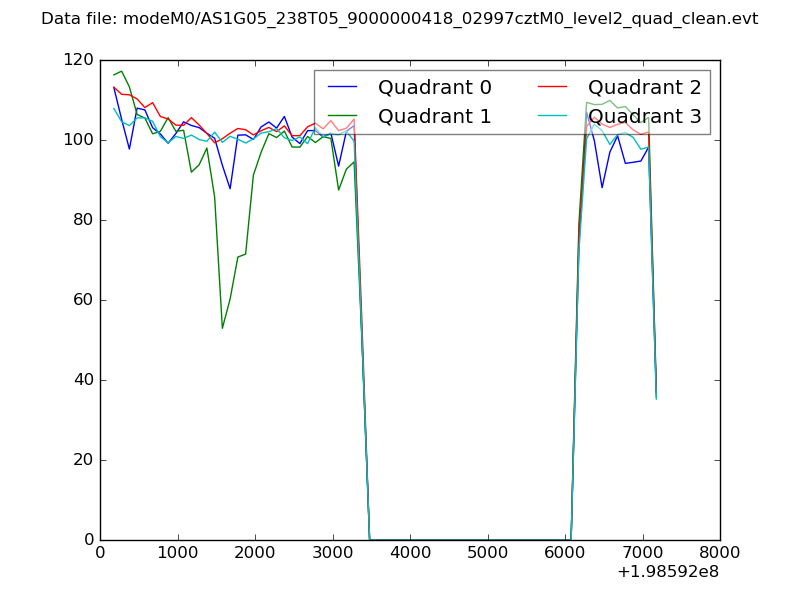 |
|
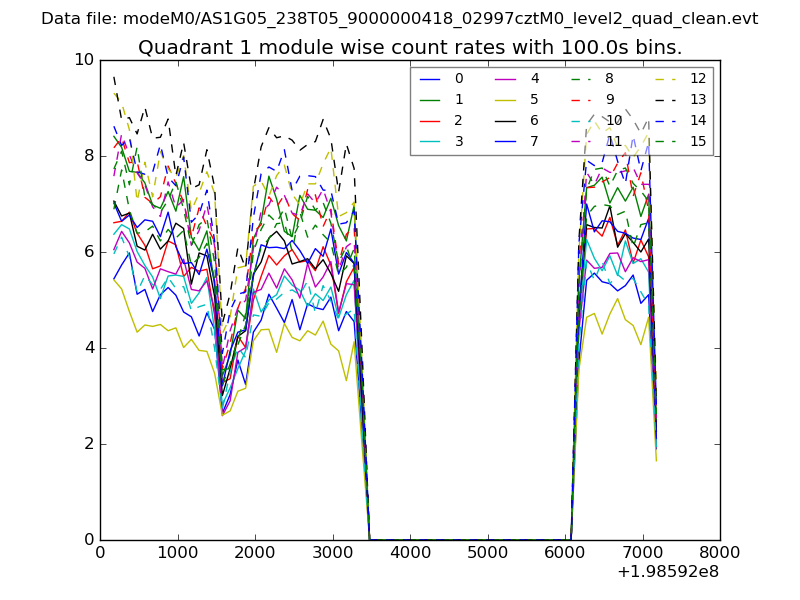
| Module-wise count rates for Quadrant A Data is divided into 100 sec bins |
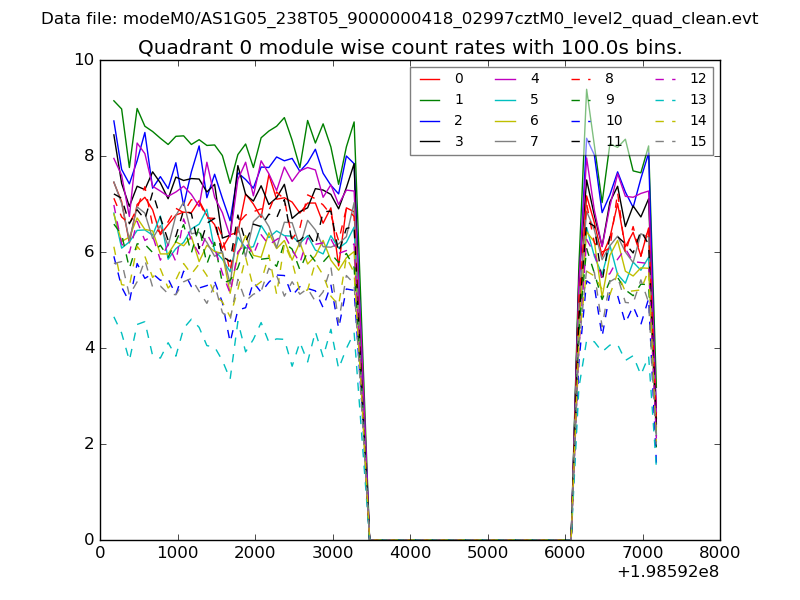 |
 |
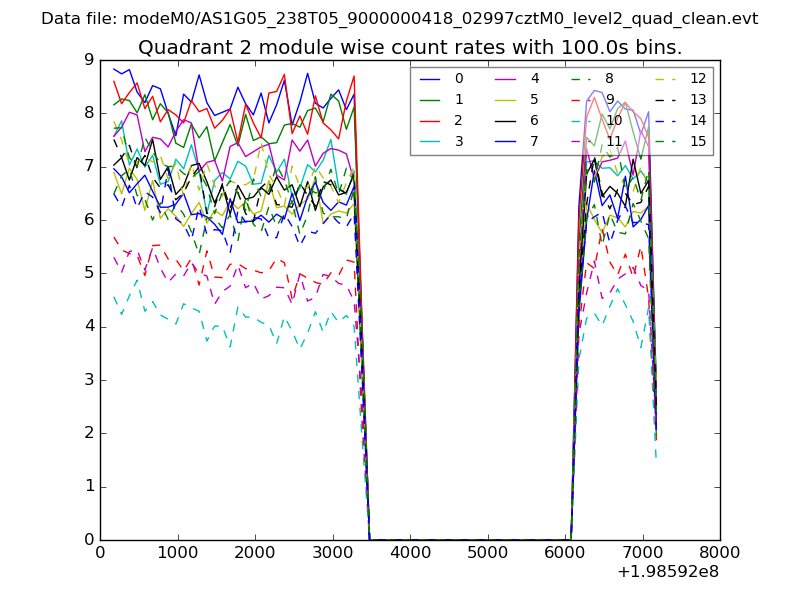
| Module-wise count rates for Quadrant B Data is divided into 100 sec bins |
 |
 |
| Module-wise count rates for Quadrant C Data is divided into 100 sec bins |
 |
 |
| Module-wise count rates for Quadrant D Data is divided into 100 sec bins |
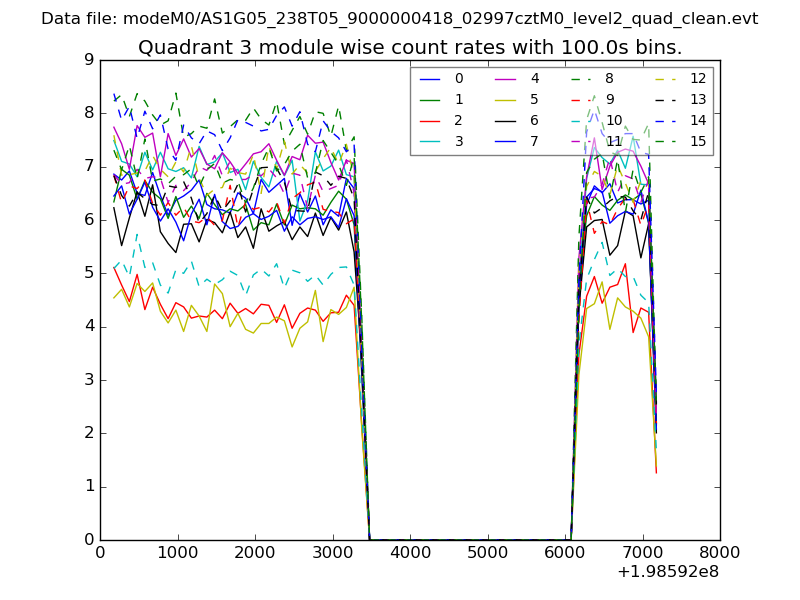 |
 |
| Parameter | Plot |
|---|---|
| CZT HV Monitor | 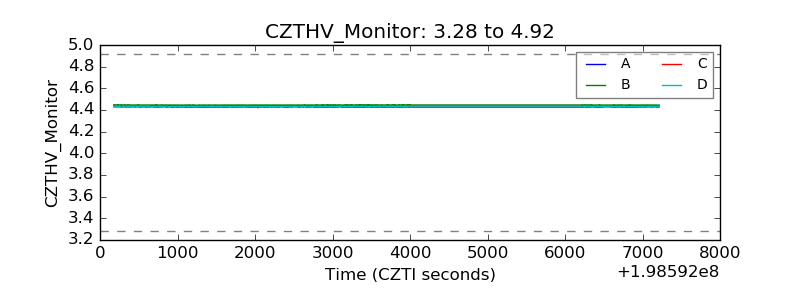 |
| D_VDD | 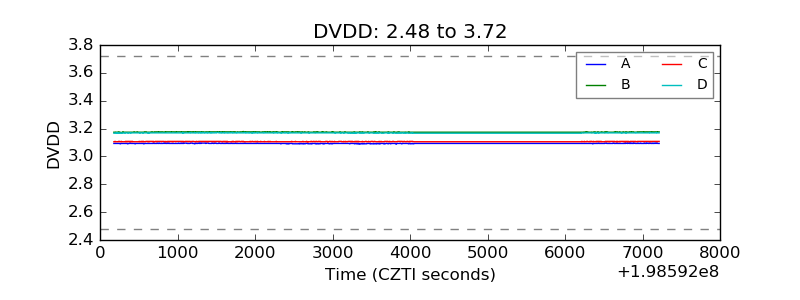 |
| Temperature 1 | 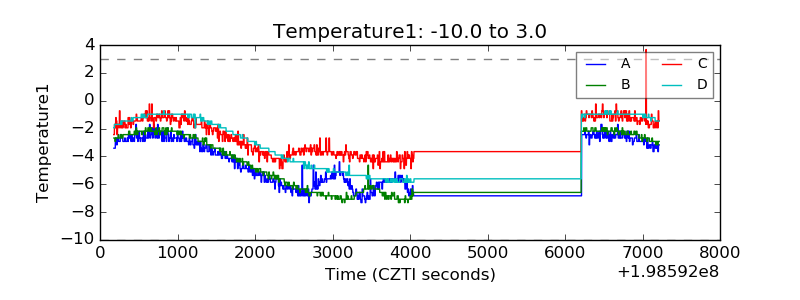 |
| Veto HV Monitor | 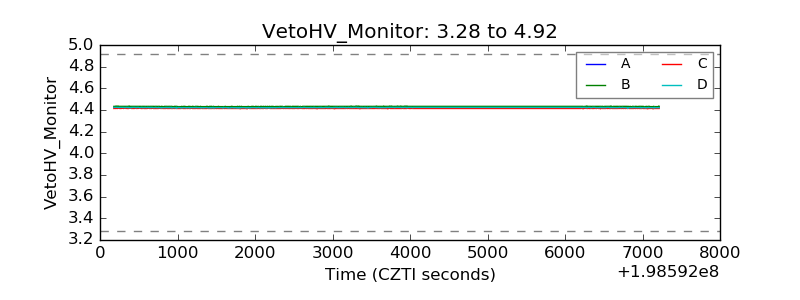 |
| Veto LLD | 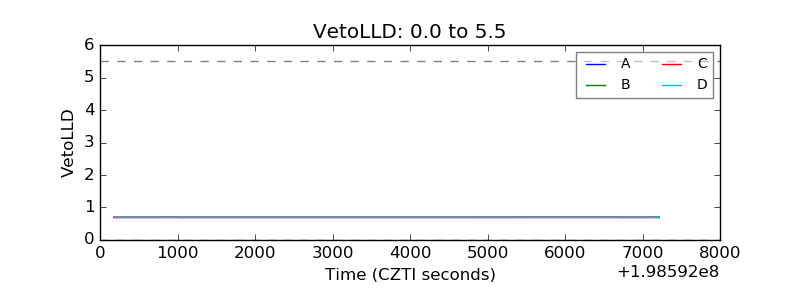 |
| Alpha Counter | 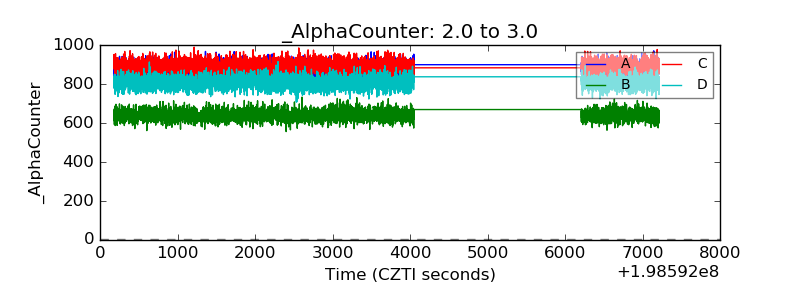 |
| _CPM_Rate | 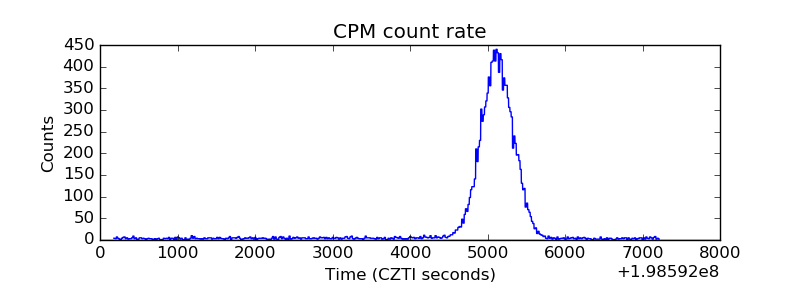 |
| CZT Counter | 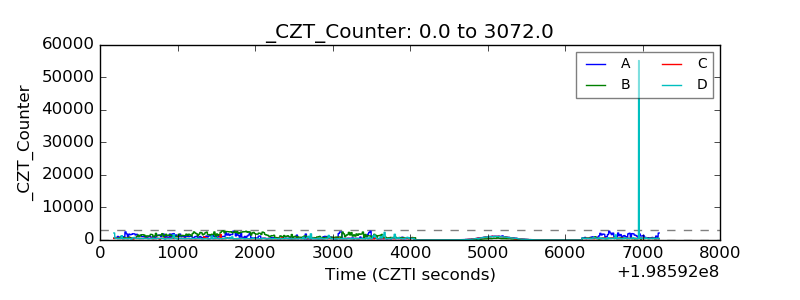 |
| +2.5 Volts monitor |  |
| +5 Volts monitor |  |
| _ROLL_ROT | 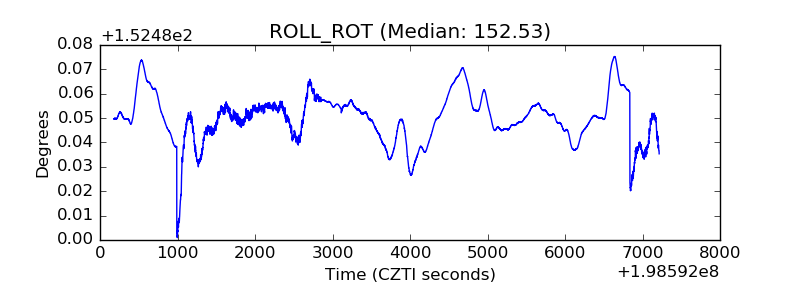 |
| _Roll_DEC | 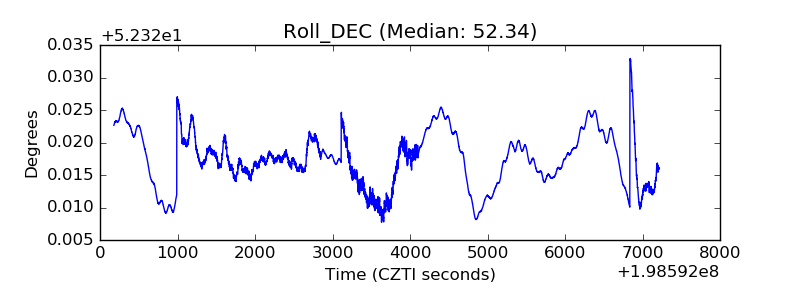 |
| _Roll_RA | 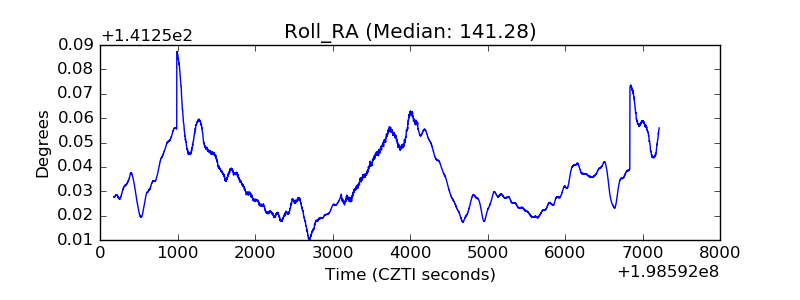 |
| Veto Counter | 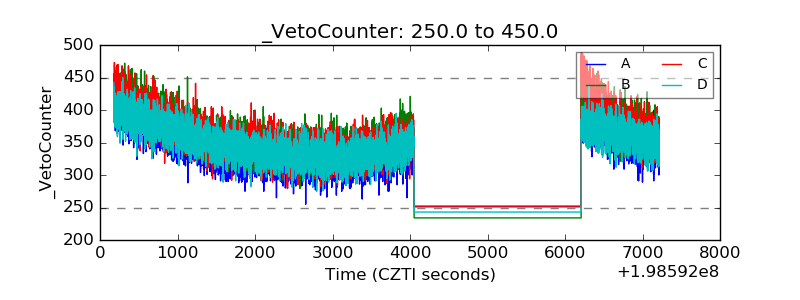 |