| Param | Original file | Final file |
|---|---|---|
| Filename | modeM0/AS1G05_238T05_9000000418_02999cztM0_level2.evt | modeM0/AS1G05_238T05_9000000418_02999cztM0_level2_quad_clean.evt |
| Size (bytes) | 460,195,200 | 54,930,240 |
| Size | 438.9 MB | 52.4 MB |
| Events in quadrant A | 5,139,959 | 315,170 |
| Events in quadrant B | 3,262,972 | 339,798 |
| Events in quadrant C | 2,842,469 | 330,430 |
| Events in quadrant D | 2,357,174 | 331,402 |
| Mode M0 | |||
|---|---|---|---|
| Quadrant | BADHDUFLAG | Total packets | Discarded packets |
| A | 0 | 18742 | 3 |
| B | 0 | 13049 | 2 |
| C | 0 | 11940 | 2 |
| D | 0 | 10742 | 2 |
| Mode M9 | |||
|---|---|---|---|
| Quadrant | BADHDUFLAG | Total packets | Discarded packets |
| A | 0 | 26 | 0 |
| B | 0 | 26 | 0 |
| C | 0 | 26 | 0 |
| D | 0 | 27 | 0 |
| Mode SS | |||
|---|---|---|---|
| Quadrant | BADHDUFLAG | Total packets | Discarded packets |
| A | 0 | 100 | 0 |
| B | 0 | 100 | 0 |
| C | 0 | 100 | 0 |
| D | 0 | 100 | 0 |
| Quadrant | Total seconds | Saturated seconds | Saturation percentage |
|---|---|---|---|
| A | 4932 | 595 | 12.064071% |
| B | 4932 | 42 | 0.851582% |
| C | 4932 | 145 | 2.939984% |
| D | 4932 | 33 | 0.669100% |
Noise dominated data is calculated using 1-second bins in cleaned event files. If a bin has >2000 counts, and if more than 50% of those come from <1% of pixels, then it is considered to be noise-dominated and hence unusable.
| Quadrant | # 1 sec bins | Bins with >0 counts | Bins with >2000 counts | High rate bins dominated by noise | Noise dominated (total time) | Noise dominated (detector-on time) | Marked lightcurve |
|---|---|---|---|---|---|---|---|
| A | 7087 | 4933 | 495 | 495 | 6.98% | 10.03% | 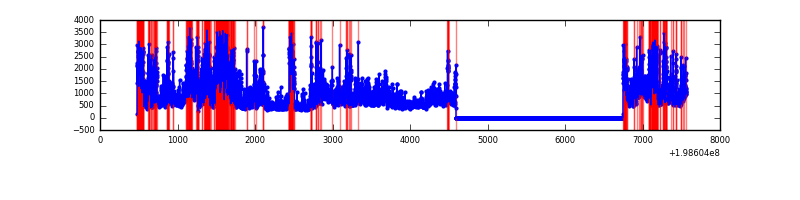 |
| B | 7087 | 4933 | 25 | 25 | 0.35% | 0.51% | 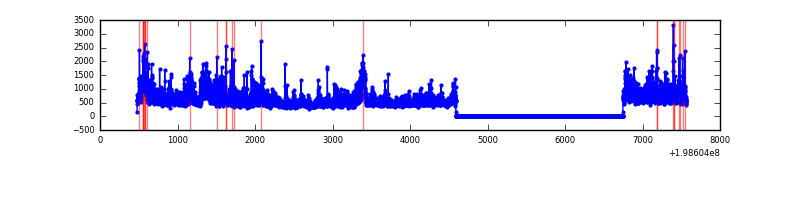 |
| C | 7087 | 4933 | 120 | 120 | 1.69% | 2.43% | 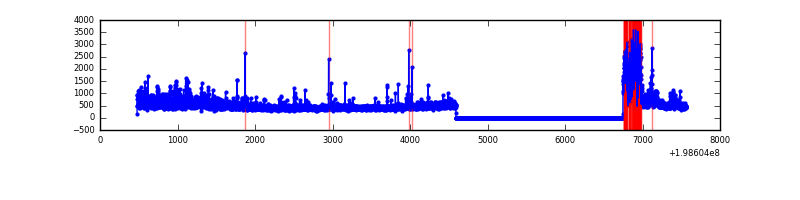 |
| D | 7087 | 4933 | 28 | 28 | 0.40% | 0.57% | 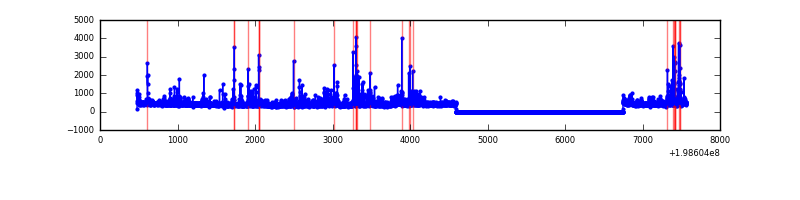 |
Top three noisy pixels from each quadrant. If the there are fewer than three noisy pixels in the level2.evt file, extra rows are filled as -1
| Pixel properties | Quadrant properties | ||||||
|---|---|---|---|---|---|---|---|
| Quadrant | DetID | PixID | Counts | Sigma | Mean | Median | Sigma |
| A | 13 | 9 | 2885873 | 28554.97 | 494 | 483 | 101.0 |
| A | 14 | 249 | 284243 | 2808.2 | 494 | 483 | 101.0 |
| A | 8 | 15 | 27789 | 270.23 | 494 | 483 | 101.0 |
| B | 8 | 3 | 1023874 | 10053.58 | 527 | 514 | 101.8 |
| B | 2 | 249 | 60300 | 587.34 | 527 | 514 | 101.8 |
| B | 3 | 226 | 45427 | 441.23 | 527 | 514 | 101.8 |
| C | 0 | 219 | 706727 | 5932.73 | 504 | 507 | 119.0 |
| C | 6 | 80 | 63325 | 527.71 | 504 | 507 | 119.0 |
| C | 1 | 192 | 60024 | 499.98 | 504 | 507 | 119.0 |
| D | 7 | 80 | 114888 | 921.91 | 506 | 490 | 124.1 |
| D | 13 | 239 | 76689 | 614.07 | 506 | 490 | 124.1 |
| D | 2 | 152 | 60650 | 484.82 | 506 | 490 | 124.1 |
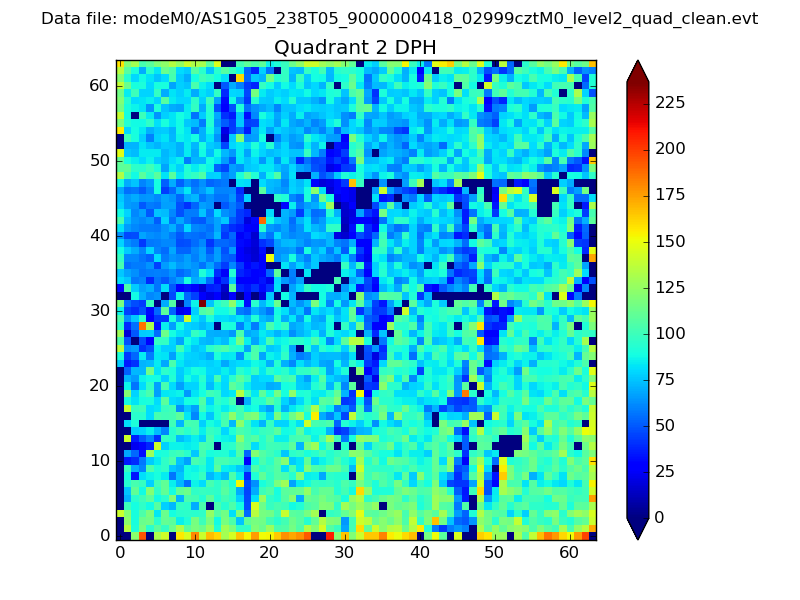
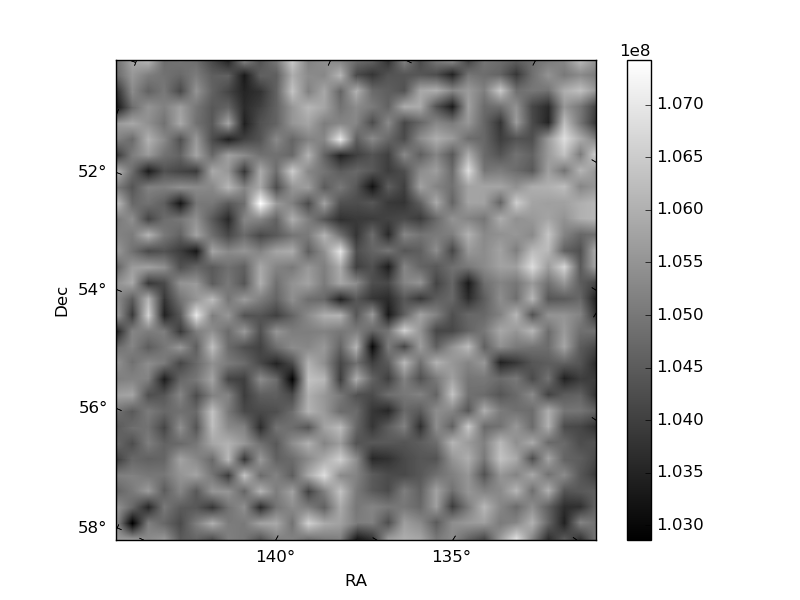
Histogram calculated using DETX and DETY for each event in the final _common_clean file
| Quadrant A | 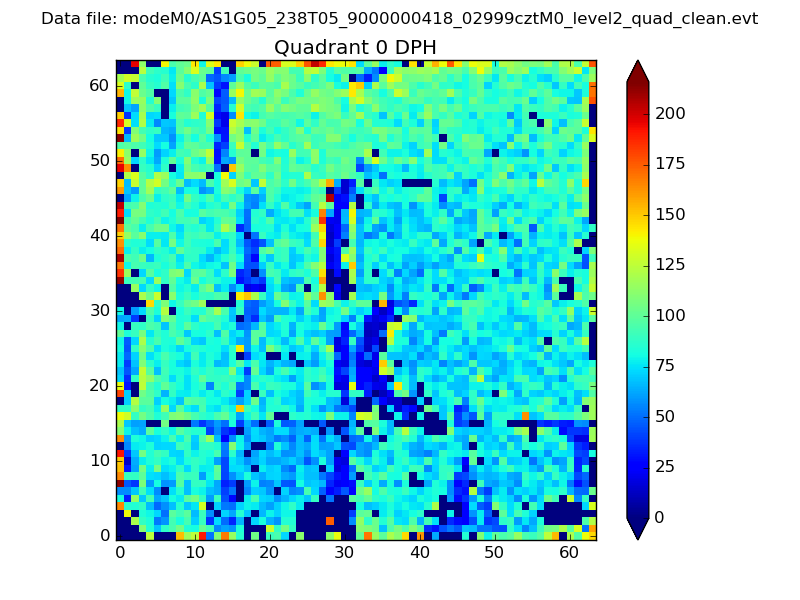 |
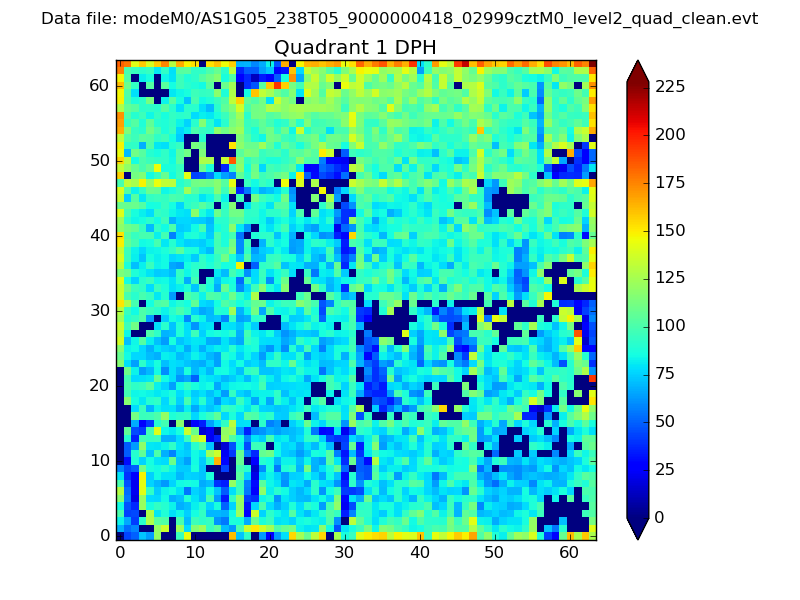 |
Quadrant B |
|---|---|---|---|
| Quadrant D | 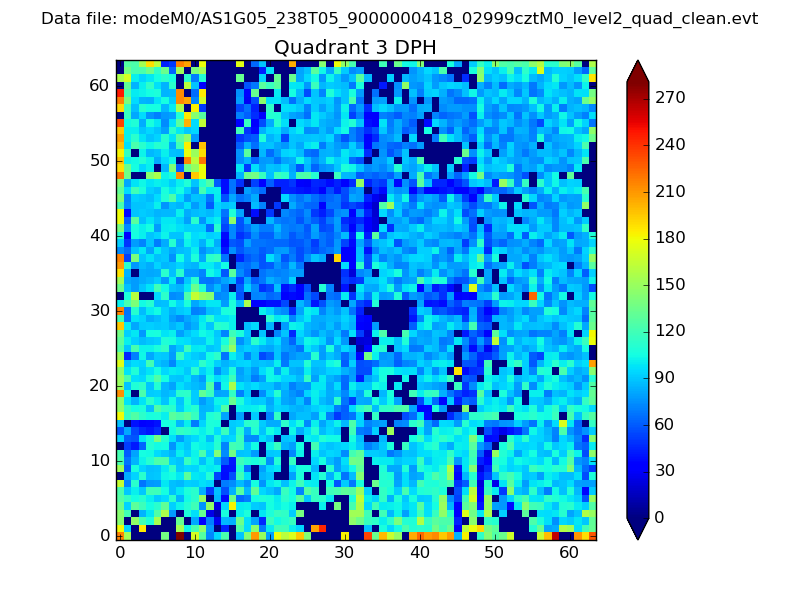 |
 |
Quadrant C |
| Plot type | Count rate plots | Images |
|---|---|---|
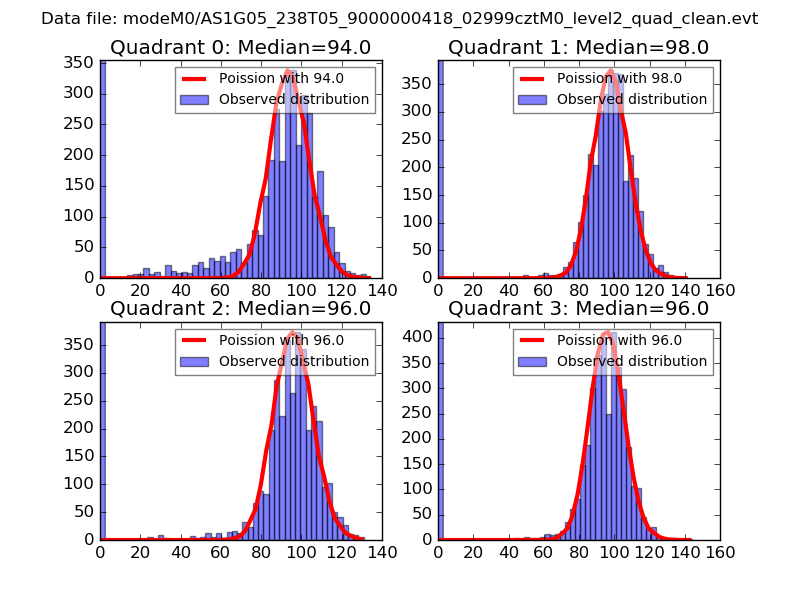
| Comparison with Poisson distribution Blue bars denote a histogram of data divided into 1 sec bins. Red curve is a Poisson curve with rate = median count rate of data. |
 |
 |
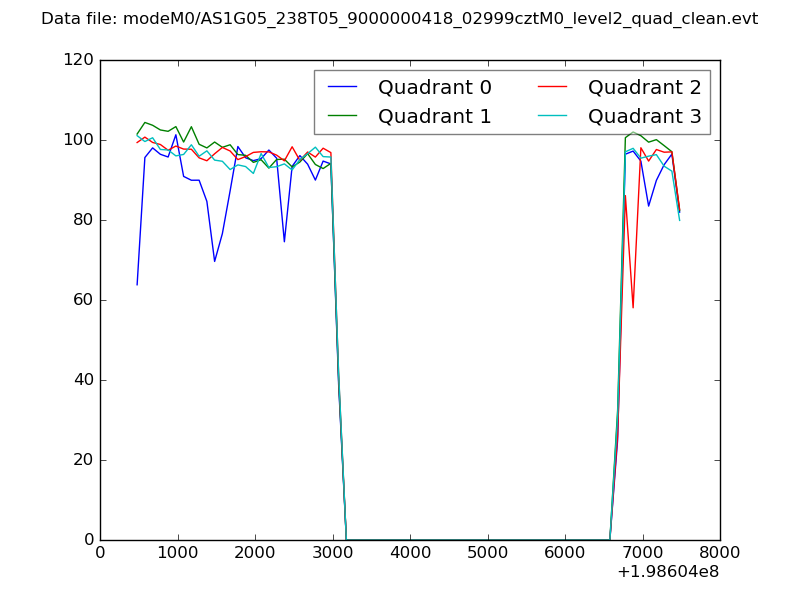
| Quadrant-wise count rates Data is divided into 100 sec bins |
 |
|
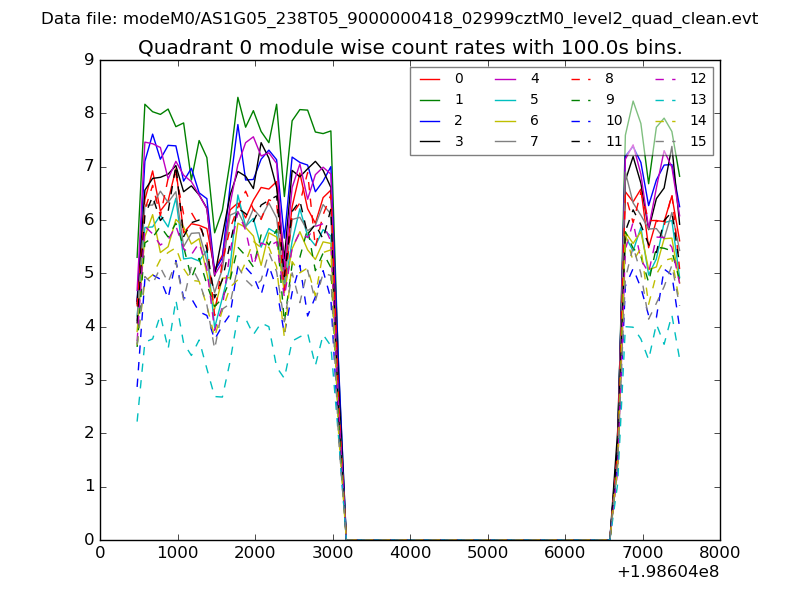
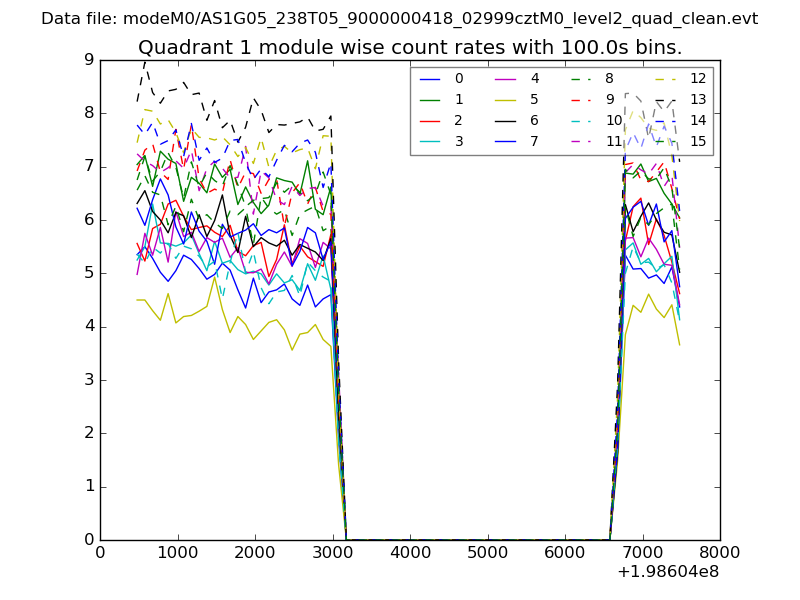
| Module-wise count rates for Quadrant A Data is divided into 100 sec bins |
 |
 |
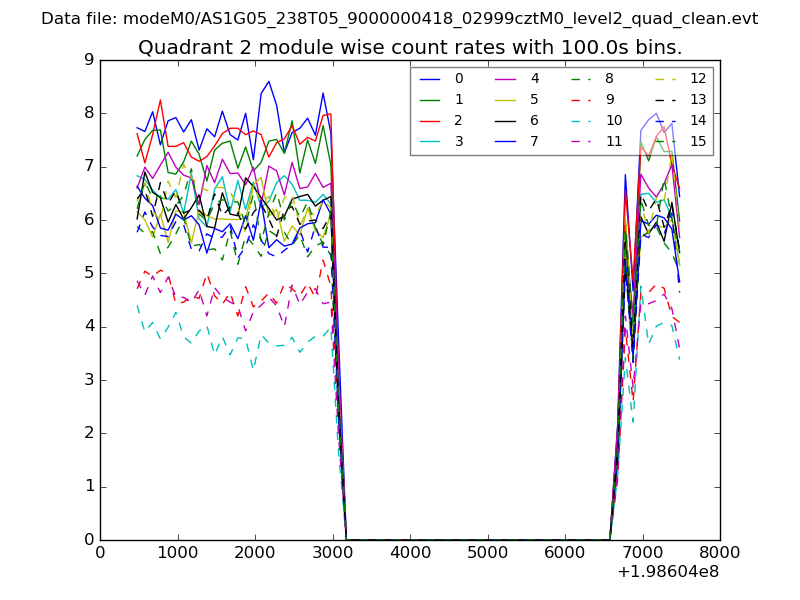
| Module-wise count rates for Quadrant B Data is divided into 100 sec bins |
 |
 |
| Module-wise count rates for Quadrant C Data is divided into 100 sec bins |
 |
 |
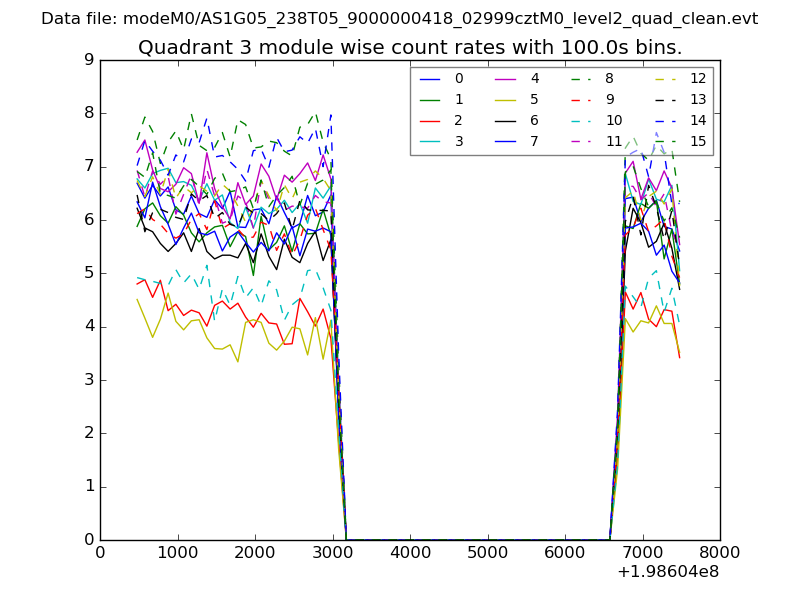
| Module-wise count rates for Quadrant D Data is divided into 100 sec bins |
 |
 |
| Parameter | Plot |
|---|---|
| CZT HV Monitor | 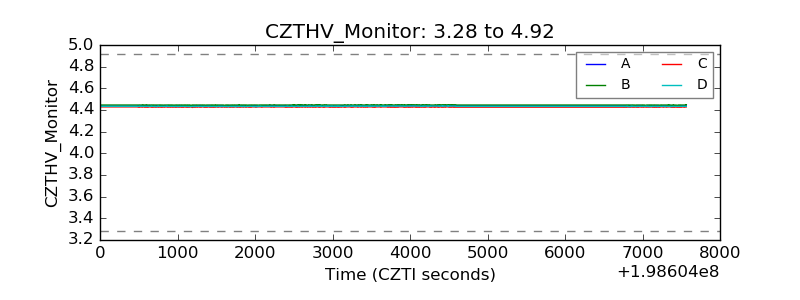 |
| D_VDD |  |
| Temperature 1 | 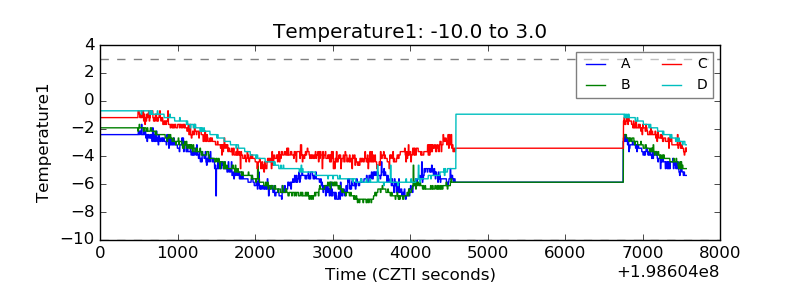 |
| Veto HV Monitor | 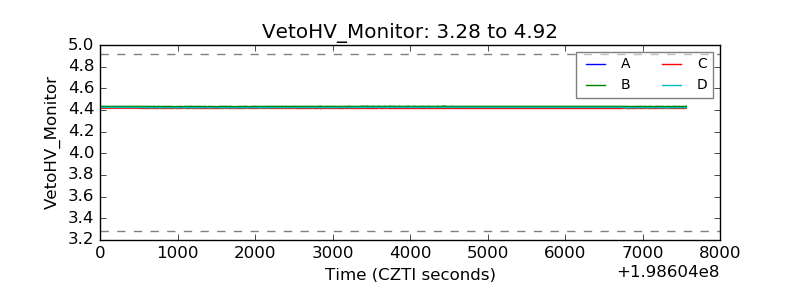 |
| Veto LLD | 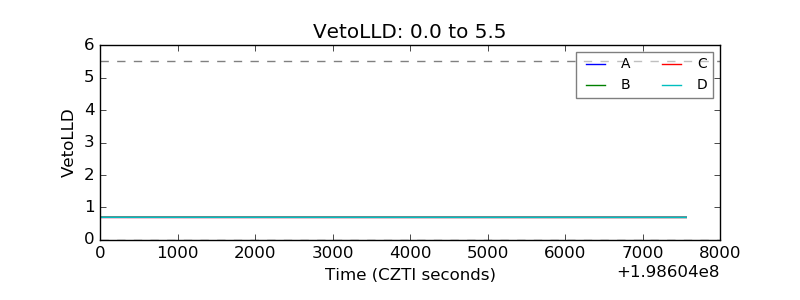 |
| Alpha Counter | 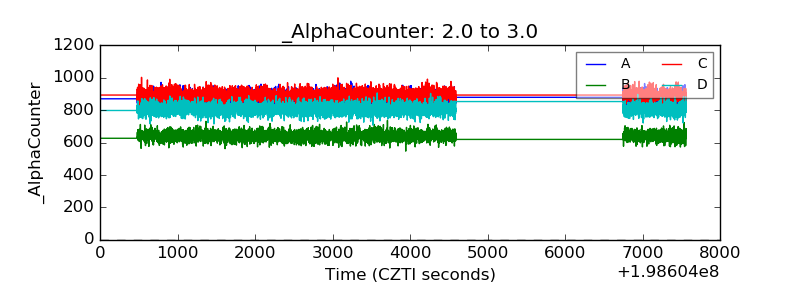 |
| _CPM_Rate | 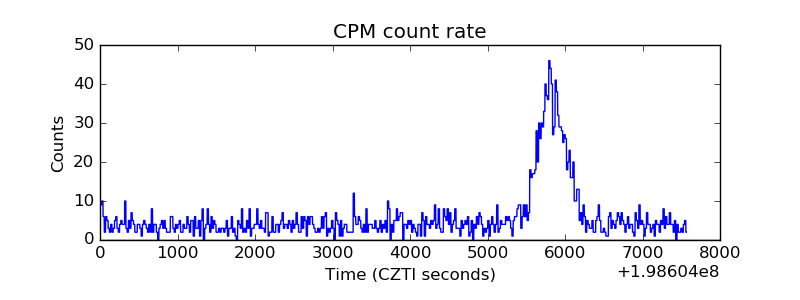 |
| CZT Counter | 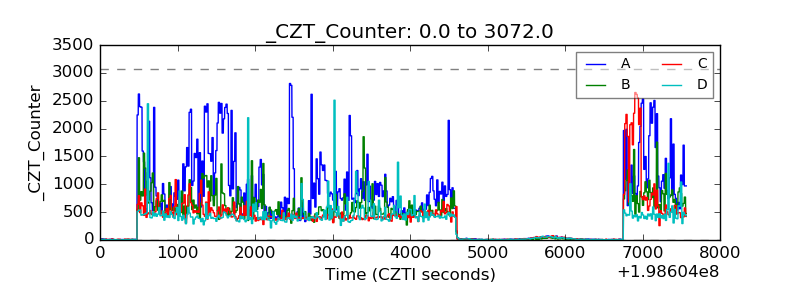 |
| +2.5 Volts monitor |  |
| +5 Volts monitor | 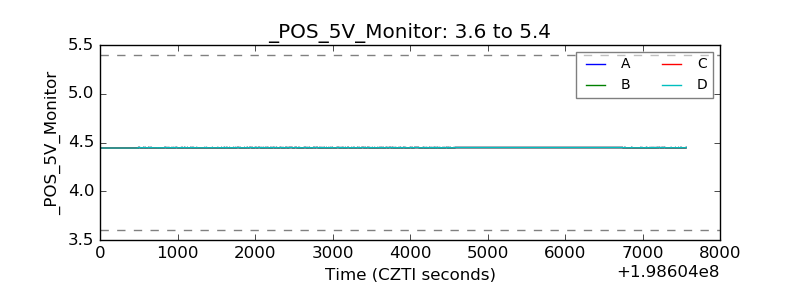 |
| _ROLL_ROT | 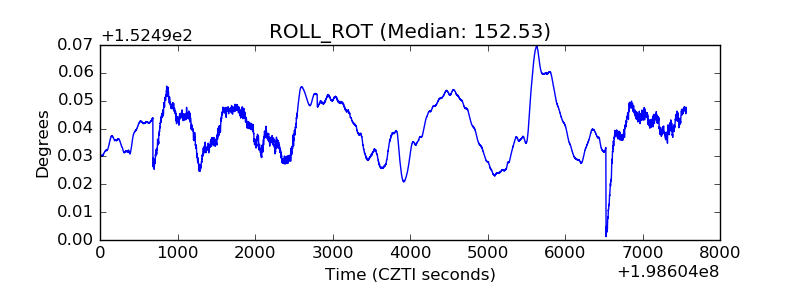 |
| _Roll_DEC | 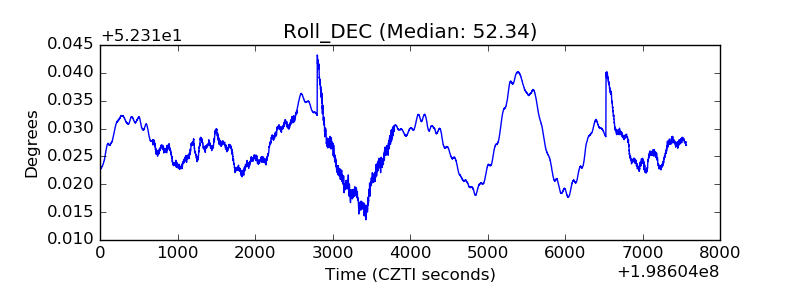 |
| _Roll_RA | 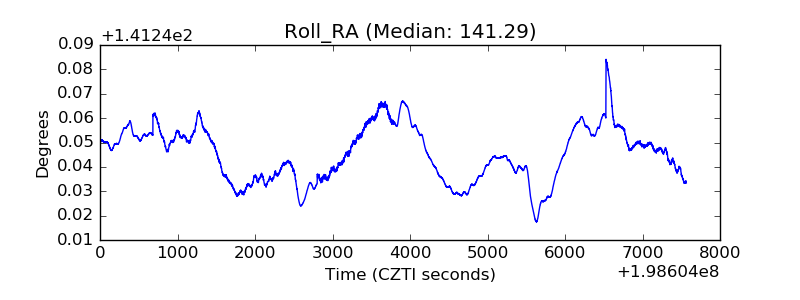 |
| Veto Counter | 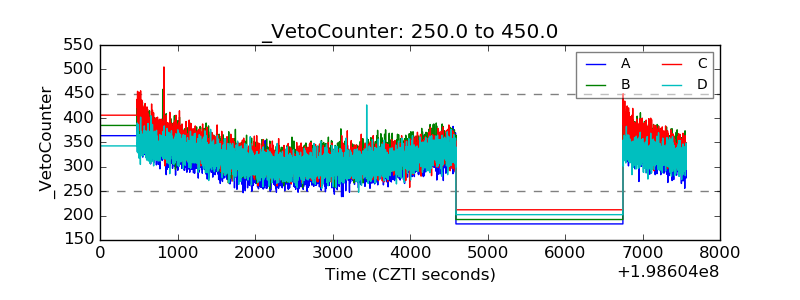 |