| Param | Original file | Final file |
|---|---|---|
| Filename | modeM0/AS1G05_238T05_9000000418_03000cztM0_level2.evt | modeM0/AS1G05_238T05_9000000418_03000cztM0_level2_quad_clean.evt |
| Size (bytes) | 371,266,560 | 37,146,240 |
| Size | 354.1 MB | 35.4 MB |
| Events in quadrant A | 3,807,018 | 204,634 |
| Events in quadrant B | 2,466,869 | 213,837 |
| Events in quadrant C | 2,261,942 | 207,173 |
| Events in quadrant D | 2,428,105 | 208,459 |
| Mode M0 | |||
|---|---|---|---|
| Quadrant | BADHDUFLAG | Total packets | Discarded packets |
| A | 0 | 14213 | 1 |
| B | 0 | 10143 | 1 |
| C | 0 | 9793 | 1 |
| D | 0 | 10253 | 1 |
| Mode M9 | |||
|---|---|---|---|
| Quadrant | BADHDUFLAG | Total packets | Discarded packets |
| A | 0 | 28 | 0 |
| B | 0 | 28 | 0 |
| C | 0 | 28 | 0 |
| D | 0 | 29 | 0 |
| Mode SS | |||
|---|---|---|---|
| Quadrant | BADHDUFLAG | Total packets | Discarded packets |
| A | 0 | 84 | 0 |
| B | 0 | 84 | 0 |
| C | 0 | 84 | 0 |
| D | 0 | 84 | 0 |
| Quadrant | Total seconds | Saturated seconds | Saturation percentage |
|---|---|---|---|
| A | 4115 | 266 | 6.464156% |
| B | 4115 | 17 | 0.413123% |
| C | 4115 | 149 | 3.620899% |
| D | 4115 | 67 | 1.628190% |
Noise dominated data is calculated using 1-second bins in cleaned event files. If a bin has >2000 counts, and if more than 50% of those come from <1% of pixels, then it is considered to be noise-dominated and hence unusable.
| Quadrant | # 1 sec bins | Bins with >0 counts | Bins with >2000 counts | High rate bins dominated by noise | Noise dominated (total time) | Noise dominated (detector-on time) | Marked lightcurve |
|---|---|---|---|---|---|---|---|
| A | 4115 | 4115 | 247 | 247 | 6.00% | 6.00% | 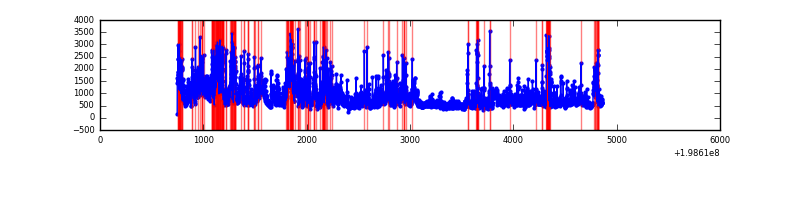 |
| B | 4115 | 4115 | 12 | 12 | 0.29% | 0.29% | 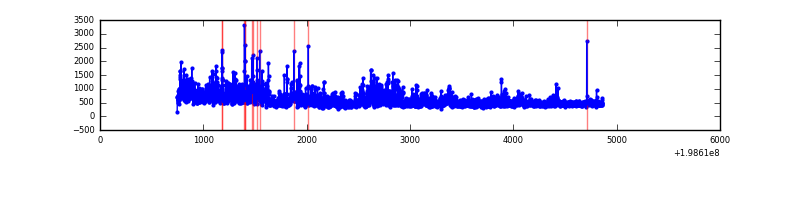 |
| C | 4115 | 4115 | 125 | 125 | 3.04% | 3.04% | 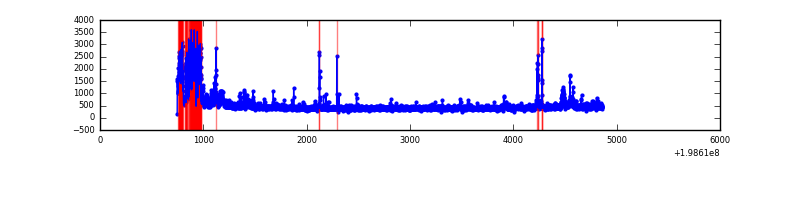 |
| D | 4115 | 4115 | 68 | 68 | 1.65% | 1.65% | 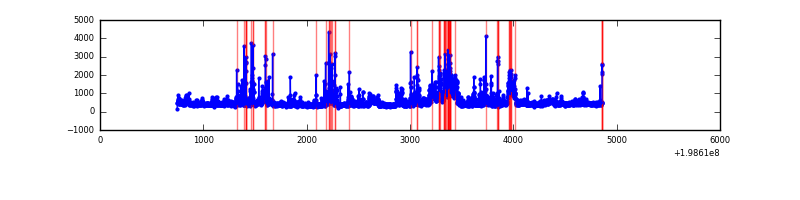 |
Top three noisy pixels from each quadrant. If the there are fewer than three noisy pixels in the level2.evt file, extra rows are filled as -1
| Pixel properties | Quadrant properties | ||||||
|---|---|---|---|---|---|---|---|
| Quadrant | DetID | PixID | Counts | Sigma | Mean | Median | Sigma |
| A | 13 | 9 | 2073308 | 24082.33 | 413 | 404 | 86.1 |
| A | 14 | 249 | 107876 | 1248.57 | 413 | 404 | 86.1 |
| A | 14 | 63 | 9601 | 106.85 | 413 | 404 | 86.1 |
| B | 8 | 3 | 679959 | 8099.82 | 431 | 422 | 83.9 |
| B | 0 | 219 | 34236 | 403.05 | 431 | 422 | 83.9 |
| B | 2 | 249 | 28965 | 340.22 | 431 | 422 | 83.9 |
| C | 0 | 219 | 470685 | 4823.63 | 412 | 414 | 97.5 |
| C | 6 | 80 | 79310 | 809.25 | 412 | 414 | 97.5 |
| C | 1 | 192 | 64841 | 660.84 | 412 | 414 | 97.5 |
| D | 10 | 237 | 277981 | 2763.05 | 409 | 397 | 100.5 |
| D | 7 | 80 | 192176 | 1908.95 | 409 | 397 | 100.5 |
| D | 13 | 114 | 173151 | 1719.58 | 409 | 397 | 100.5 |
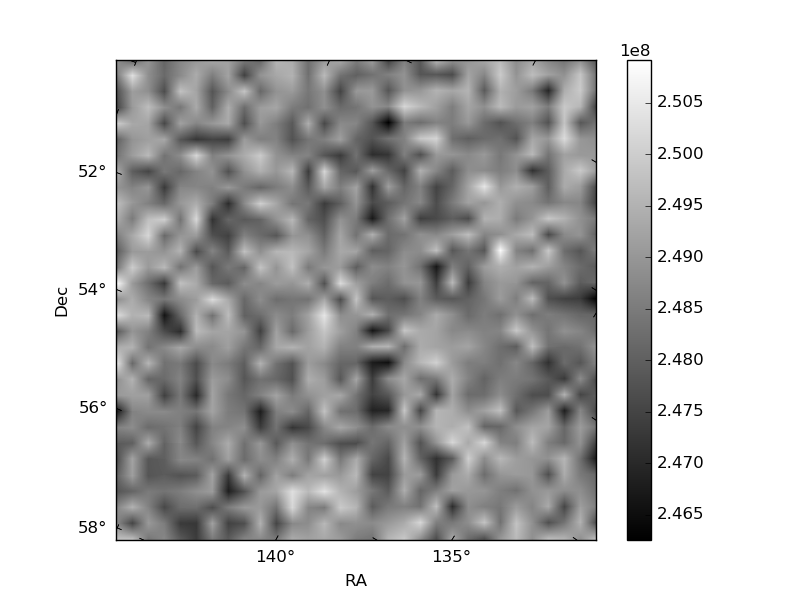
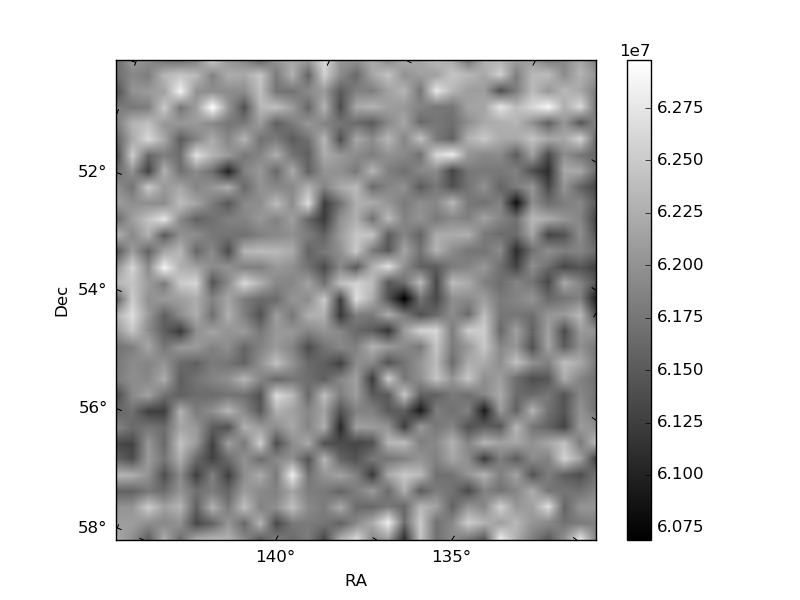
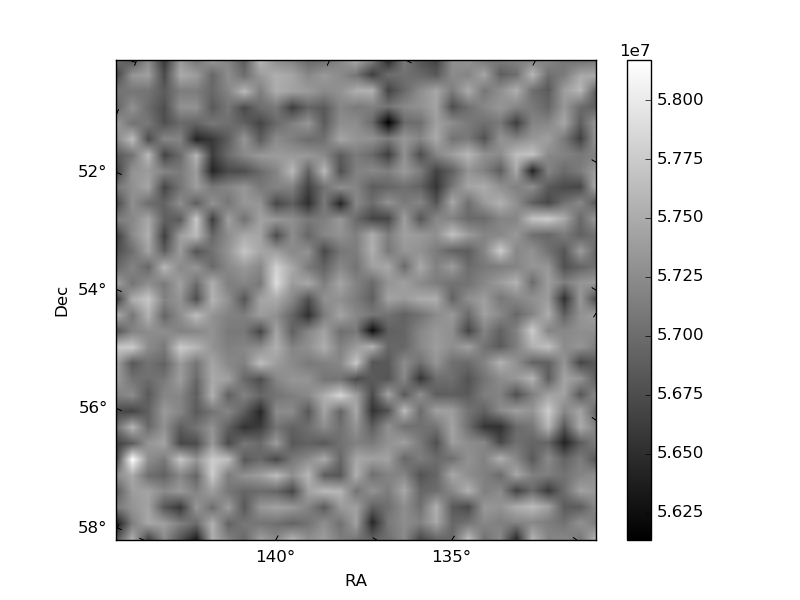
Histogram calculated using DETX and DETY for each event in the final _common_clean file
| Quadrant A | 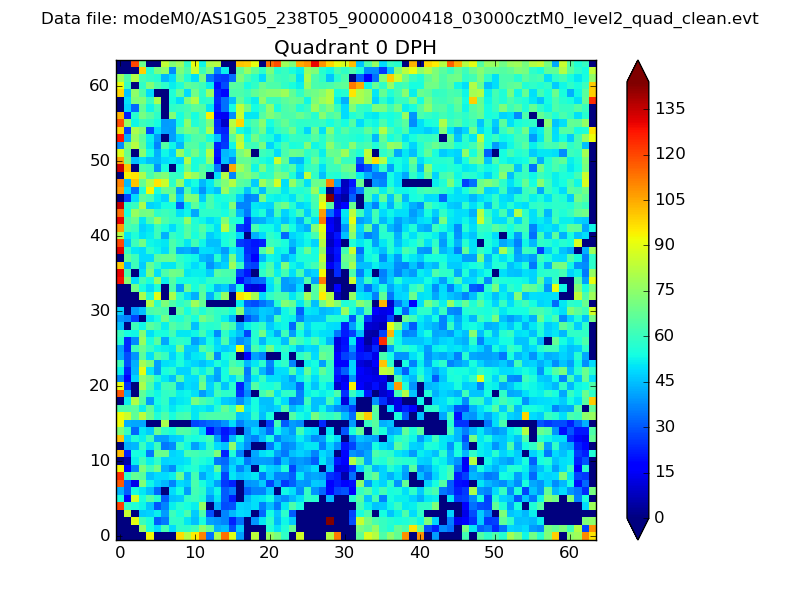 |
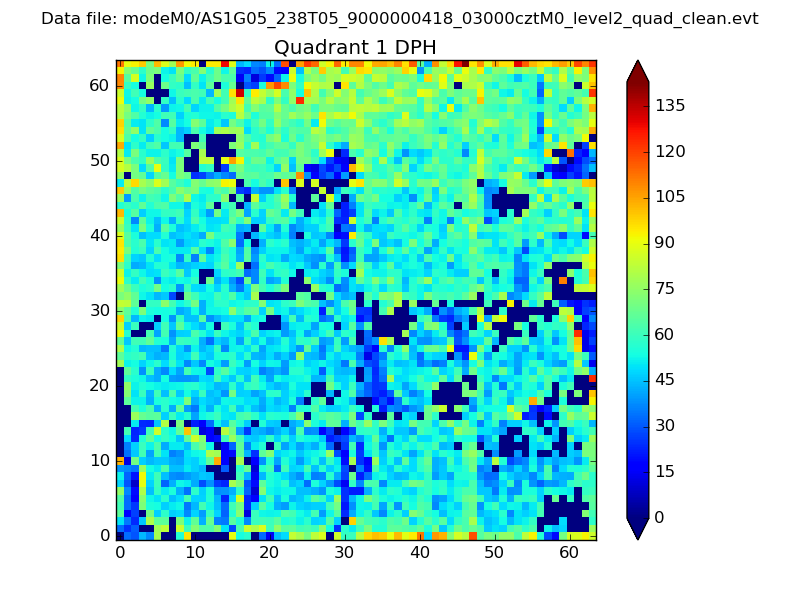 |
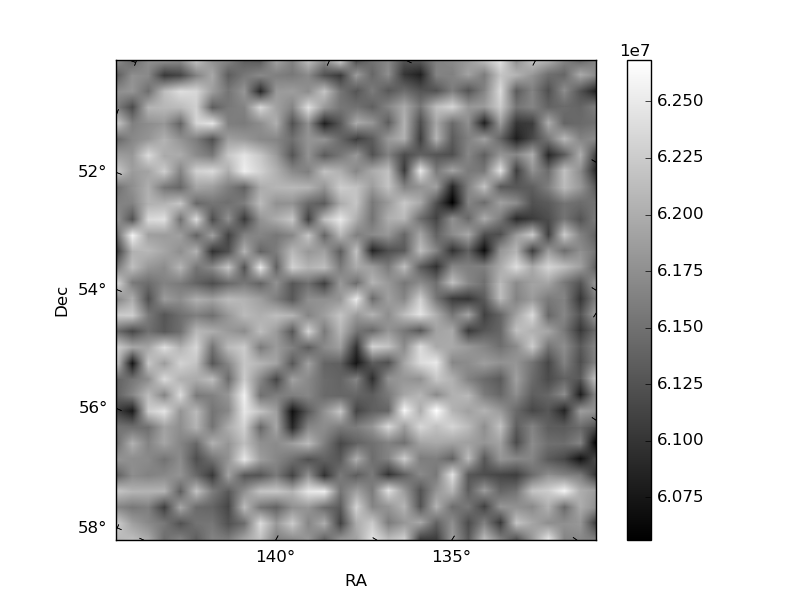
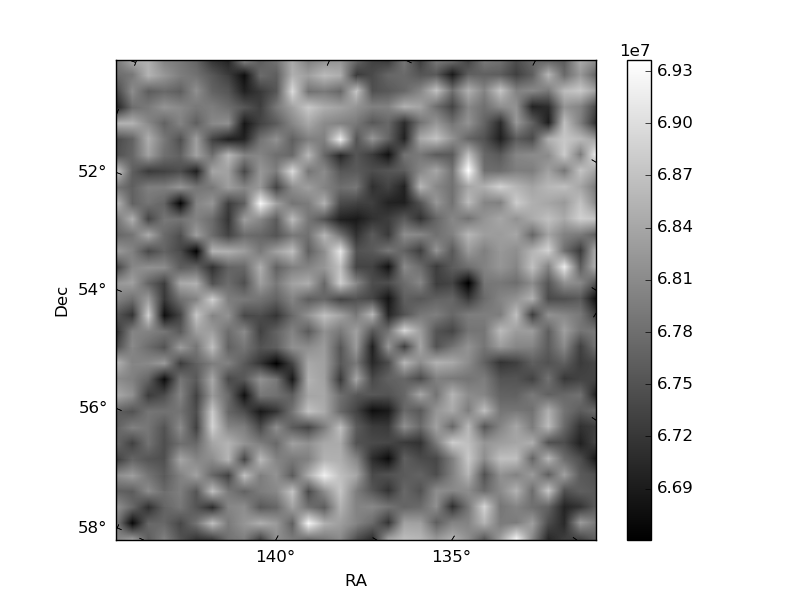
Quadrant B |
|---|---|---|---|
| Quadrant D | 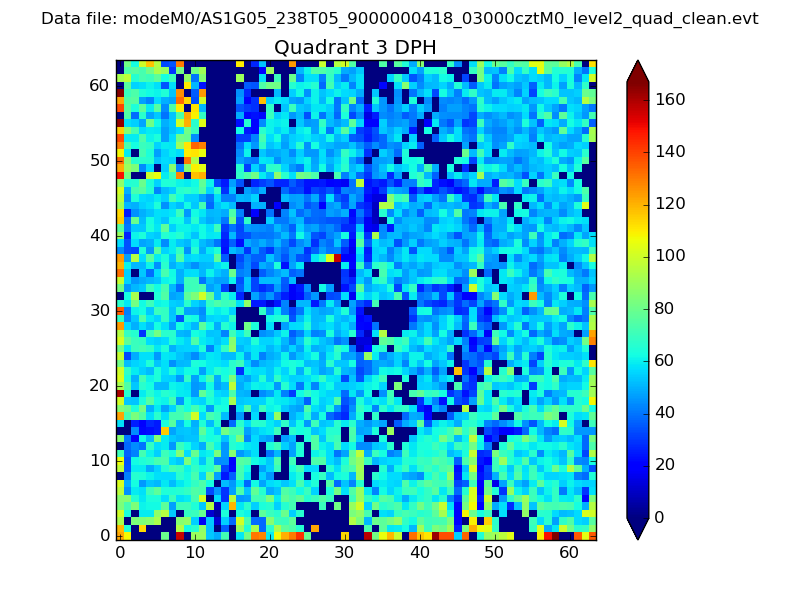 |
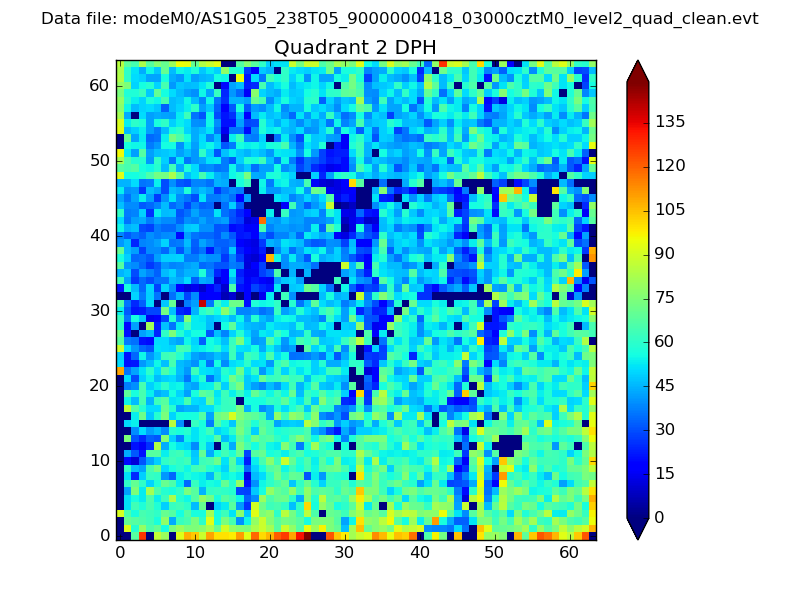 |
Quadrant C |
| Plot type | Count rate plots | Images |
|---|---|---|
| Comparison with Poisson distribution Blue bars denote a histogram of data divided into 1 sec bins. Red curve is a Poisson curve with rate = median count rate of data. |
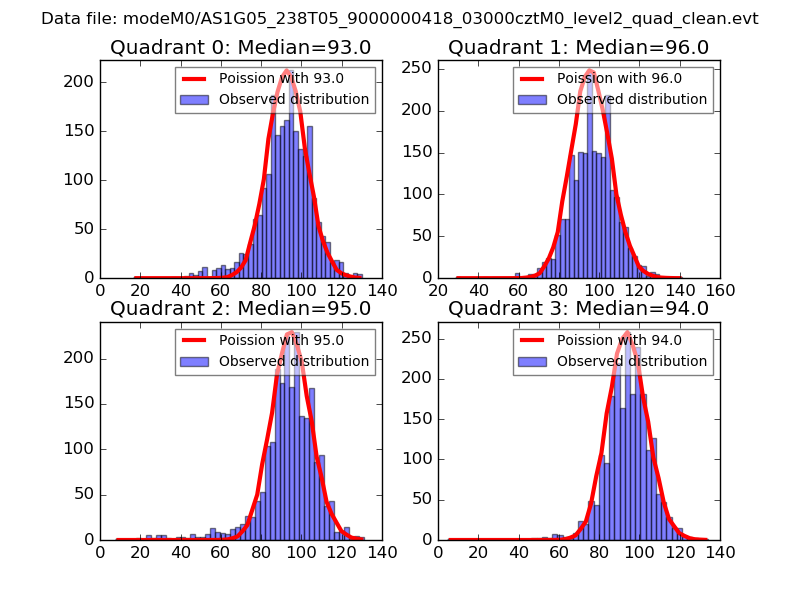 |
 |
| Quadrant-wise count rates Data is divided into 100 sec bins |
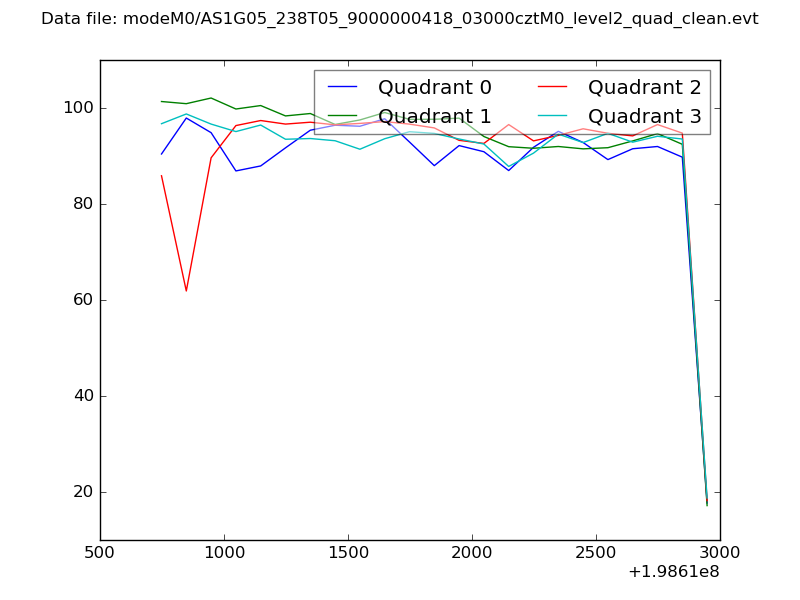 |
|
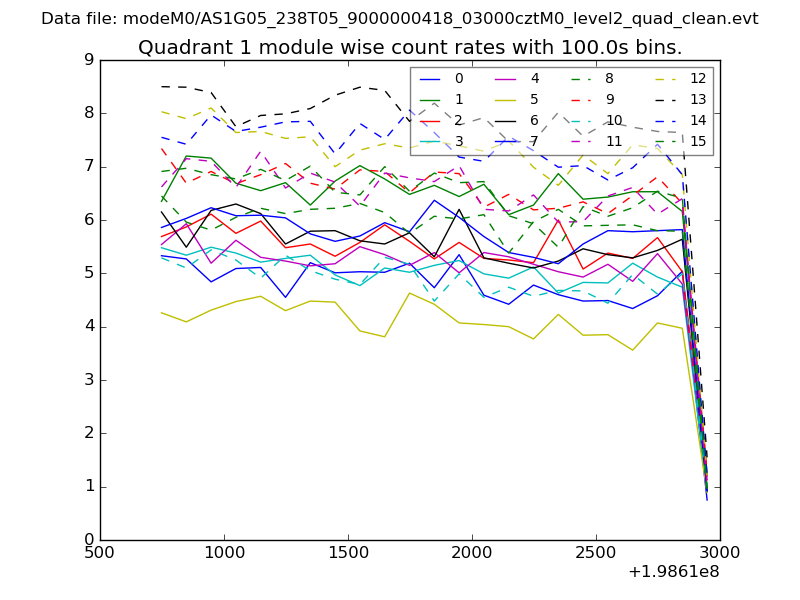
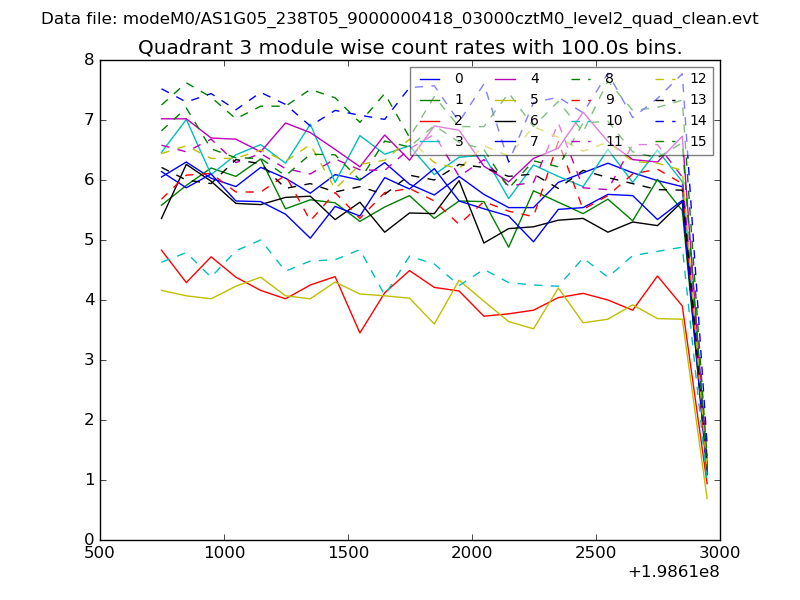
| Module-wise count rates for Quadrant A Data is divided into 100 sec bins |
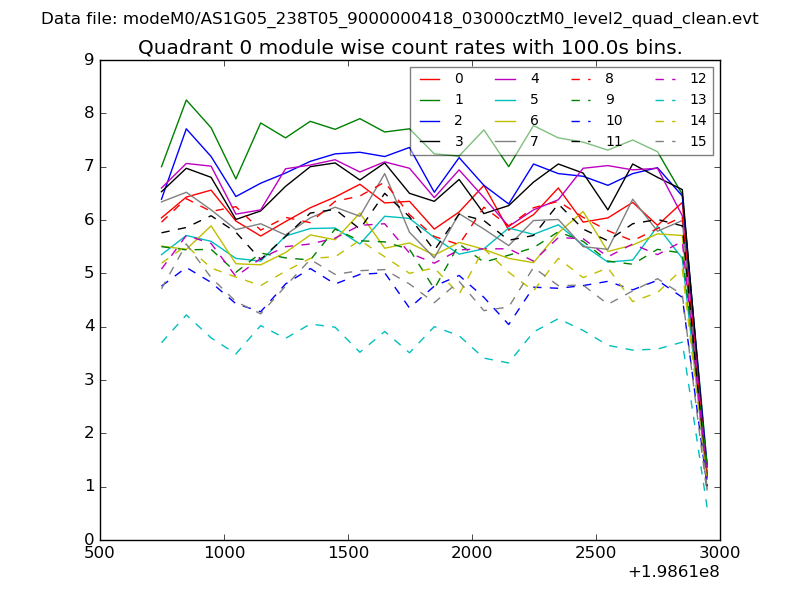 |
 |
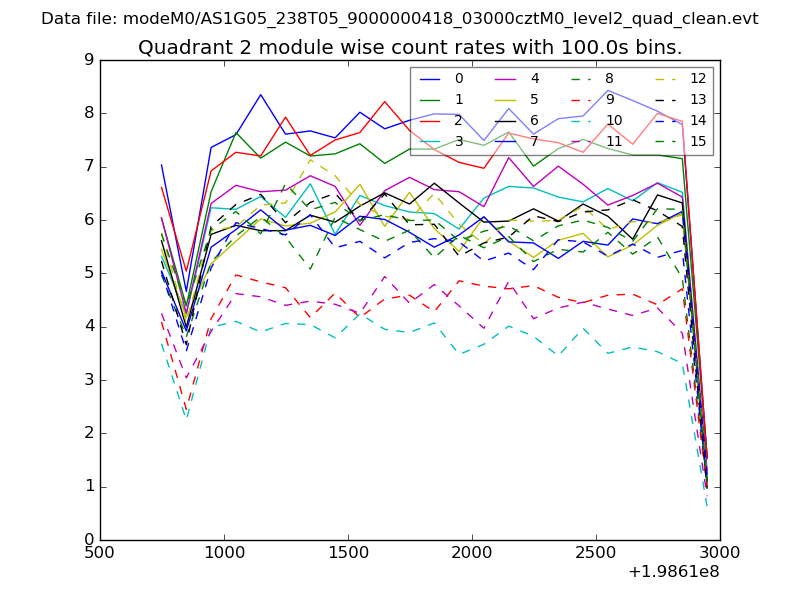
| Module-wise count rates for Quadrant B Data is divided into 100 sec bins |
 |
 |
| Module-wise count rates for Quadrant C Data is divided into 100 sec bins |
 |
 |
| Module-wise count rates for Quadrant D Data is divided into 100 sec bins |
 |
 |
| Parameter | Plot |
|---|---|
| CZT HV Monitor | 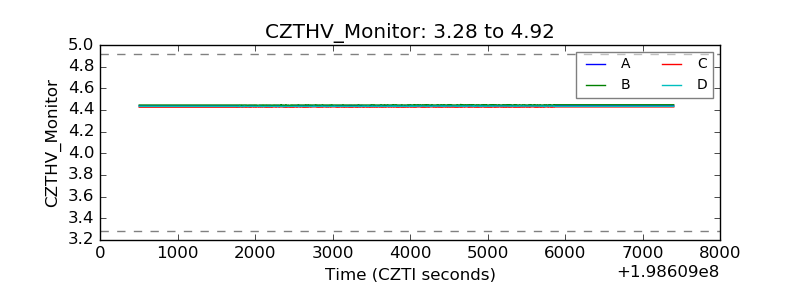 |
| D_VDD | 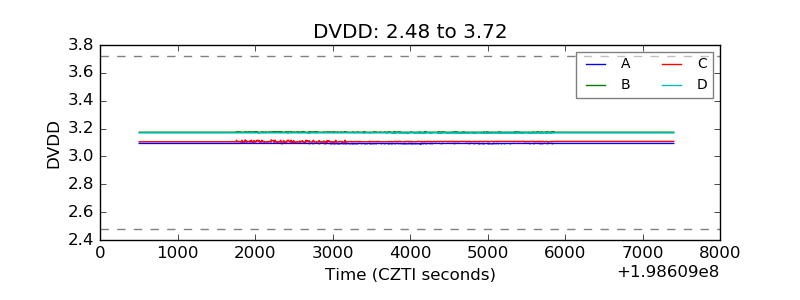 |
| Temperature 1 | 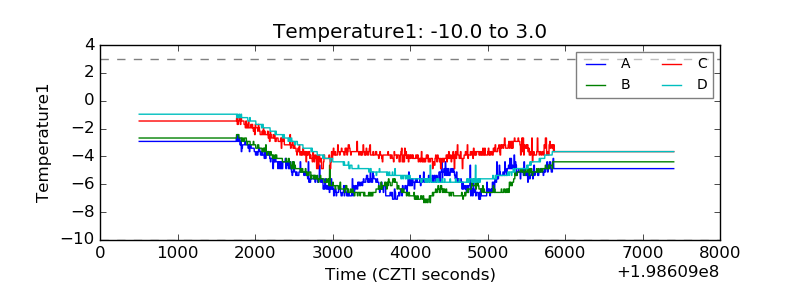 |
| Veto HV Monitor | 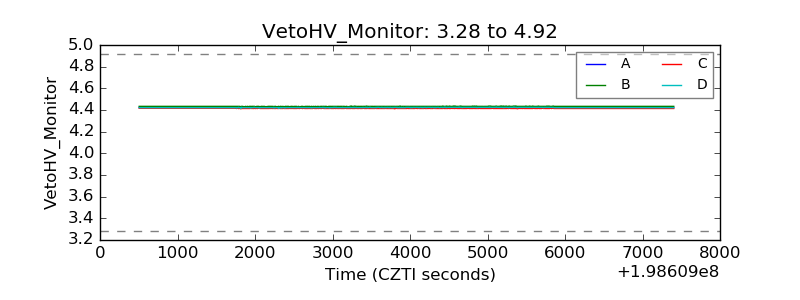 |
| Veto LLD | 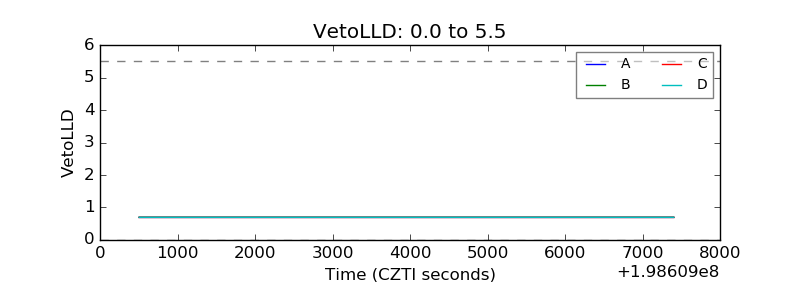 |
| Alpha Counter | 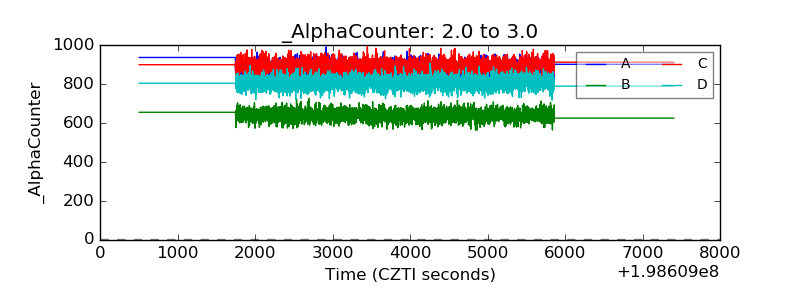 |
| _CPM_Rate | 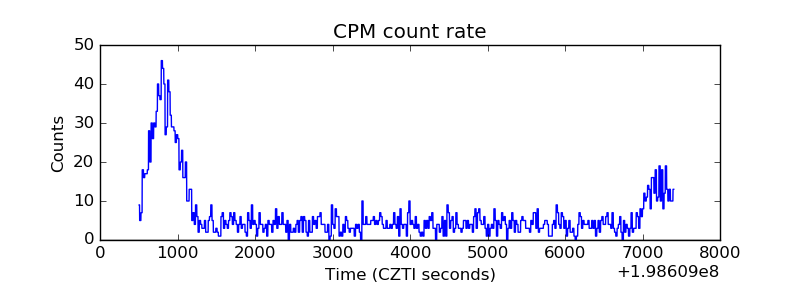 |
| CZT Counter | 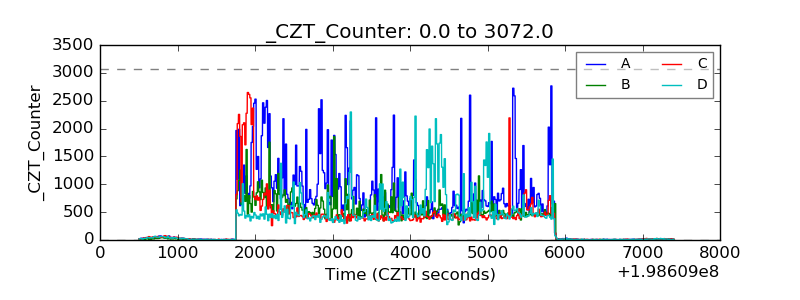 |
| +2.5 Volts monitor | 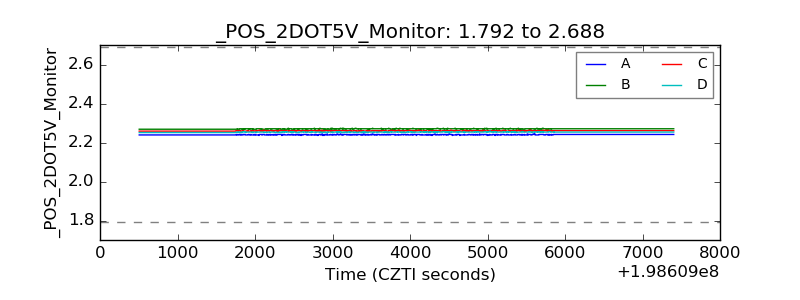 |
| +5 Volts monitor |  |
| _ROLL_ROT | 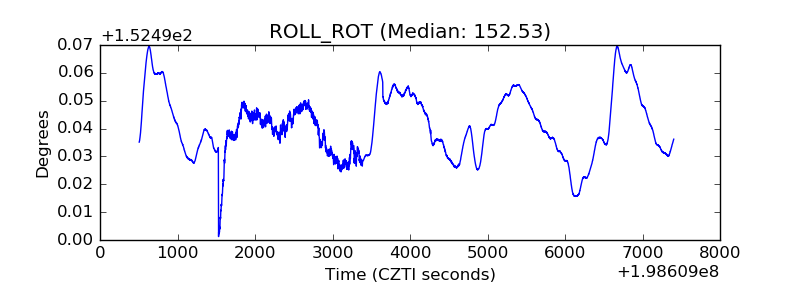 |
| _Roll_DEC | 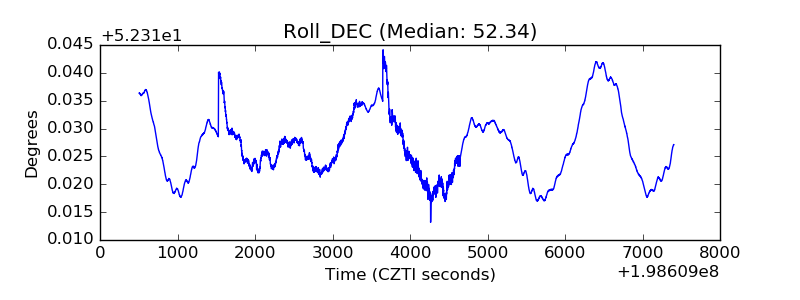 |
| _Roll_RA | 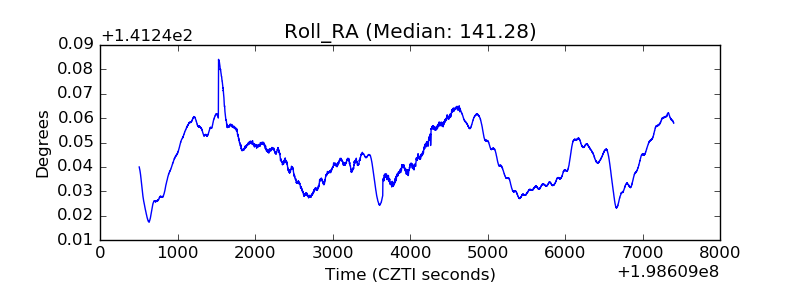 |
| Veto Counter | 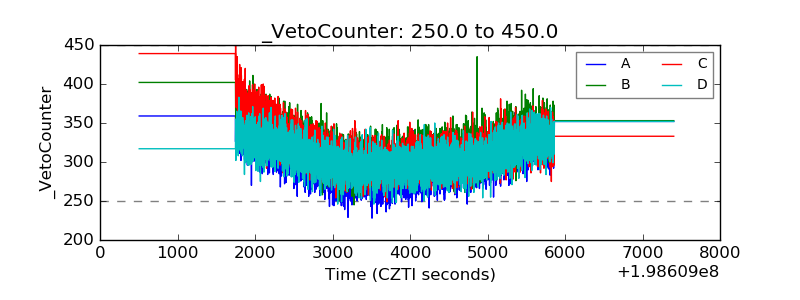 |