| Param | Original file | Final file |
|---|---|---|
| Filename | modeM0/AS1G05_238T02_9000000420cztM0_level2.fits | modeM0/AS1G05_238T02_9000000420cztM0_level2_quad_clean.evt |
| Size (bytes) | 774,285,120 | 858,859,200 |
| Size | 738.4 MB | 819.1 MB |
| Events in quadrant A | 4,522,592 | 5,202,428 |
| Events in quadrant B | 4,479,916 | 5,320,996 |
| Events in quadrant C | 4,428,688 | 4,710,145 |
| Events in quadrant D | 3,891,980 | 4,657,142 |
| Mode M0 | |||
|---|---|---|---|
| Quadrant | BADHDUFLAG | Total packets | Discarded packets |
| A | 0 | 244151 | 0 |
| B | 0 | 203094 | 0 |
| C | 0 | 245200 | 0 |
| D | 0 | 213410 | 0 |
| Mode SS | |||
|---|---|---|---|
| Quadrant | BADHDUFLAG | Total packets | Discarded packets |
| A | 0 | 1826 | 0 |
| B | 0 | 1826 | 0 |
| C | 0 | 1826 | 0 |
| D | 0 | 1826 | 0 |
| Mode M9 | |||
|---|---|---|---|
| Quadrant | BADHDUFLAG | Total packets | Discarded packets |
| A | 0 | 475 | 0 |
| B | 0 | 475 | 0 |
| C | 0 | 475 | 0 |
| D | 0 | 475 | 0 |
| Quadrant | Total seconds | Saturated seconds | Saturation percentage |
|---|---|---|---|
| A | 89266 | 4954 | 5.549705% |
| B | 89309 | 614 | 0.687501% |
| C | 89309 | 6186 | 6.926514% |
| D | 89309 | 1573 | 1.761301% |
Noise dominated data is calculated using 1-second bins in cleaned event files. If a bin has >2000 counts, and if more than 50% of those come from <1% of pixels, then it is considered to be noise-dominated and hence unusable.
| Quadrant | # 1 sec bins | Bins with >0 counts | Bins with >2000 counts | High rate bins dominated by noise | Noise dominated (total time) | Noise dominated (detector-on time) | Marked lightcurve |
|---|---|---|---|---|---|---|---|
| A | 151728 | 89217 | 0 | 0 | 0.00% | 0.00% |  |
| B | 151729 | 89300 | 0 | 0 | 0.00% | 0.00% |  |
| C | 151729 | 89269 | 0 | 0 | 0.00% | 0.00% |  |
| D | 151729 | 89261 | 0 | 0 | 0.00% | 0.00% |  |
Top three noisy pixels from each quadrant. If the there are fewer than three noisy pixels in the level2.evt file, extra rows are filled as -1
| Pixel properties | Quadrant properties | ||||||
|---|---|---|---|---|---|---|---|
| Quadrant | DetID | PixID | Counts | Sigma | Mean | Median | Sigma |
| A | 0 | 29 | 4394 | 11.01 | 1176 | 1100 | 299.1 |
| A | 7 | 110 | 3994 | 9.67 | 1176 | 1100 | 299.1 |
| A | 9 | 19 | 3462 | 7.89 | 1176 | 1100 | 299.1 |
| B | 2 | 9 | 4007 | 12.34 | 1187 | 1131 | 233.0 |
| B | 5 | 128 | 3338 | 9.47 | 1187 | 1131 | 233.0 |
| B | 12 | 226 | 3245 | 9.07 | 1187 | 1131 | 233.0 |
| C | 1 | 81 | 3376 | 7.37 | 1170 | 1086 | 310.6 |
| C | 1 | 80 | 3354 | 7.3 | 1170 | 1086 | 310.6 |
| C | 9 | 188 | 3086 | 6.44 | 1170 | 1086 | 310.6 |
| D | 3 | 14 | 3002 | 6.8 | 1113 | 1011 | 292.6 |
| D | 6 | 44 | 2970 | 6.69 | 1113 | 1011 | 292.6 |
| D | 6 | 231 | 2907 | 6.48 | 1113 | 1011 | 292.6 |
Histogram calculated using DETX and DETY for each event in the final _common_clean file
| Quadrant A | 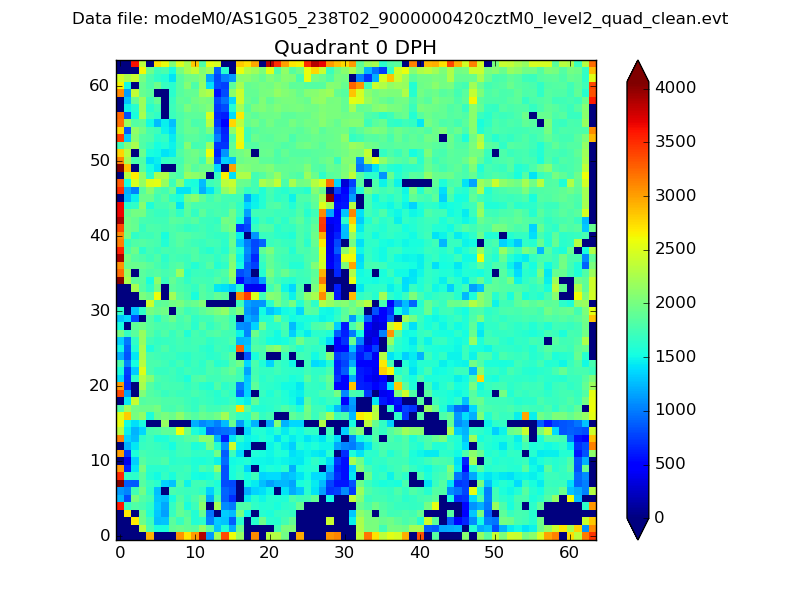 |
 |
Quadrant B |
|---|---|---|---|
| Quadrant D | 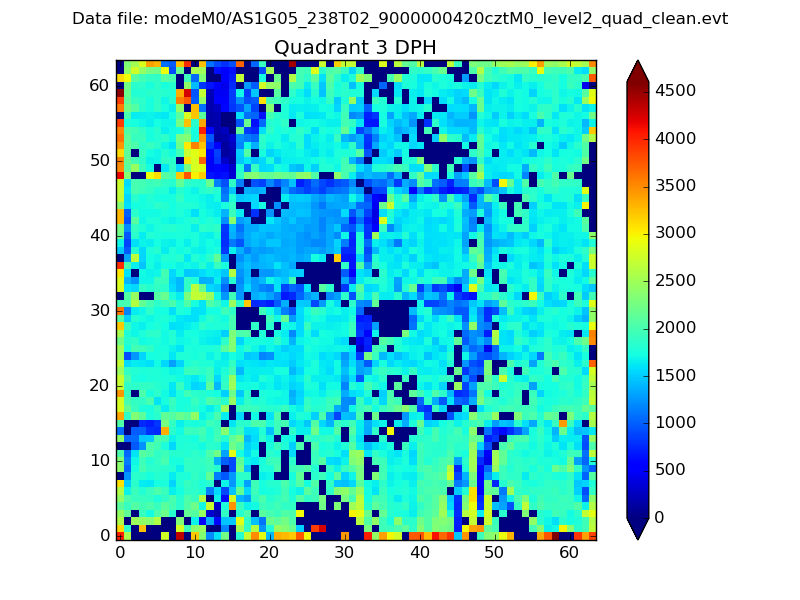 |
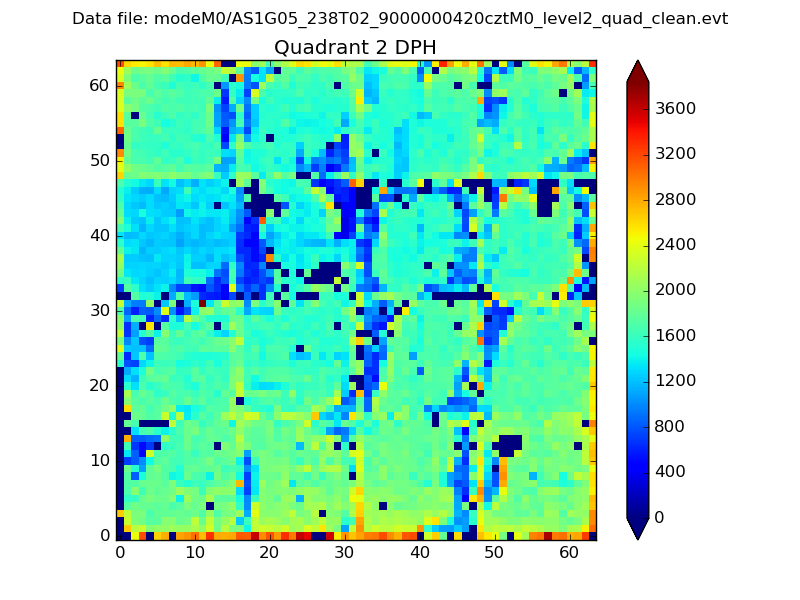 |
Quadrant C |
| Plot type | Count rate plots | Images |
|---|---|---|
| Comparison with Poisson distribution Blue bars denote a histogram of data divided into 1 sec bins. Red curve is a Poisson curve with rate = median count rate of data. |
 |
 |
| Quadrant-wise count rates Data is divided into 100 sec bins |
 |
|
| Module-wise count rates for Quadrant A Data is divided into 100 sec bins |
 |
 |
| Module-wise count rates for Quadrant B Data is divided into 100 sec bins |
 |
 |
| Module-wise count rates for Quadrant C Data is divided into 100 sec bins |
 |
 |
| Module-wise count rates for Quadrant D Data is divided into 100 sec bins |
 |
 |
| Parameter | Plot |
|---|---|
| CZT HV Monitor |  |
| D_VDD |  |
| Temperature 1 |  |
| Veto HV Monitor |  |
| Veto LLD |  |
| Alpha Counter |  |
| _CPM_Rate |  |
| CZT Counter |  |
| +2.5 Volts monitor |  |
| +5 Volts monitor |  |
| _ROLL_ROT |  |
| _Roll_DEC |  |
| _Roll_RA |  |
| Veto Counter |  |