| Param | Original file | Final file |
|---|---|---|
| Filename | modeM0/AS1G05_238T02_9000000420_03001cztM0_level2.evt | modeM0/AS1G05_238T02_9000000420_03001cztM0_level2_quad_clean.evt |
| Size (bytes) | 423,685,440 | 53,709,120 |
| Size | 404.1 MB | 51.2 MB |
| Events in quadrant A | 3,668,888 | 312,422 |
| Events in quadrant B | 2,609,144 | 322,829 |
| Events in quadrant C | 2,776,123 | 313,485 |
| Events in quadrant D | 3,427,058 | 315,852 |
| Mode M0 | |||
|---|---|---|---|
| Quadrant | BADHDUFLAG | Total packets | Discarded packets |
| A | 0 | 14414 | 3 |
| B | 0 | 11313 | 2 |
| C | 0 | 12327 | 2 |
| D | 0 | 13921 | 2 |
| Mode SS | |||
|---|---|---|---|
| Quadrant | BADHDUFLAG | Total packets | Discarded packets |
| A | 0 | 106 | 0 |
| B | 0 | 106 | 0 |
| C | 0 | 106 | 0 |
| D | 0 | 106 | 0 |
| Mode M9 | |||
|---|---|---|---|
| Quadrant | BADHDUFLAG | Total packets | Discarded packets |
| A | 0 | 22 | 0 |
| B | 0 | 22 | 0 |
| C | 0 | 22 | 0 |
| D | 0 | 22 | 0 |
| Quadrant | Total seconds | Saturated seconds | Saturation percentage |
|---|---|---|---|
| A | 5150 | 248 | 4.815534% |
| B | 5150 | 32 | 0.621359% |
| C | 5150 | 241 | 4.679612% |
| D | 5150 | 91 | 1.766990% |
Noise dominated data is calculated using 1-second bins in cleaned event files. If a bin has >2000 counts, and if more than 50% of those come from <1% of pixels, then it is considered to be noise-dominated and hence unusable.
| Quadrant | # 1 sec bins | Bins with >0 counts | Bins with >2000 counts | High rate bins dominated by noise | Noise dominated (total time) | Noise dominated (detector-on time) | Marked lightcurve |
|---|---|---|---|---|---|---|---|
| A | 7307 | 5151 | 191 | 191 | 2.61% | 3.71% | 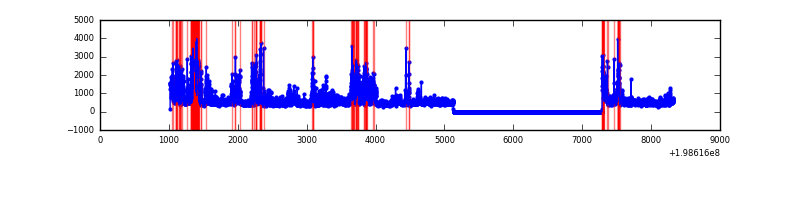 |
| B | 7307 | 5151 | 14 | 14 | 0.19% | 0.27% | 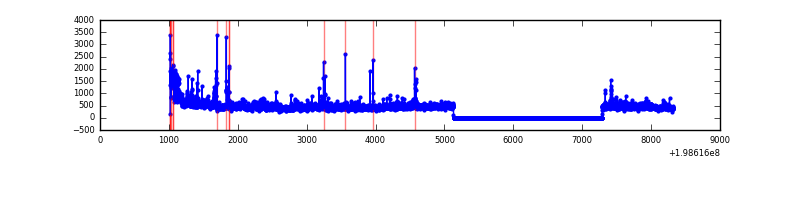 |
| C | 7307 | 5151 | 208 | 208 | 2.85% | 4.04% | 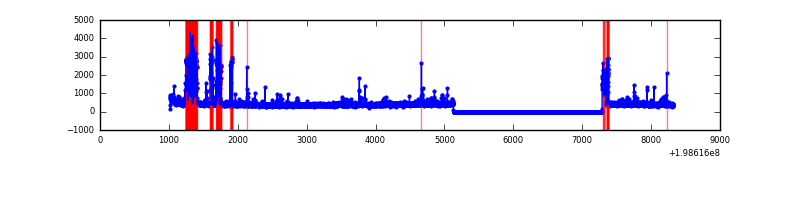 |
| D | 7307 | 5151 | 110 | 110 | 1.51% | 2.14% | 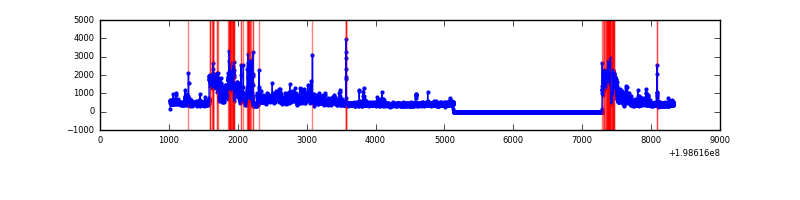 |
Top three noisy pixels from each quadrant. If the there are fewer than three noisy pixels in the level2.evt file, extra rows are filled as -1
| Pixel properties | Quadrant properties | ||||||
|---|---|---|---|---|---|---|---|
| Quadrant | DetID | PixID | Counts | Sigma | Mean | Median | Sigma |
| A | 13 | 9 | 1050909 | 9892.88 | 514 | 503 | 106.2 |
| A | 0 | 50 | 442085 | 4158.89 | 514 | 503 | 106.2 |
| A | 14 | 249 | 165153 | 1550.7 | 514 | 503 | 106.2 |
| B | 8 | 3 | 240056 | 2300.42 | 539 | 526 | 104.1 |
| B | 6 | 203 | 142564 | 1364.12 | 539 | 526 | 104.1 |
| B | 2 | 249 | 40398 | 382.93 | 539 | 526 | 104.1 |
| C | 0 | 219 | 681780 | 5734.98 | 505 | 507 | 118.8 |
| C | 6 | 80 | 74419 | 622.19 | 505 | 507 | 118.8 |
| C | 1 | 16 | 27445 | 226.77 | 505 | 507 | 118.8 |
| D | 13 | 114 | 1257383 | 9656.74 | 510 | 496 | 130.2 |
| D | 13 | 239 | 72640 | 554.28 | 510 | 496 | 130.2 |
| D | 7 | 80 | 41882 | 317.97 | 510 | 496 | 130.2 |
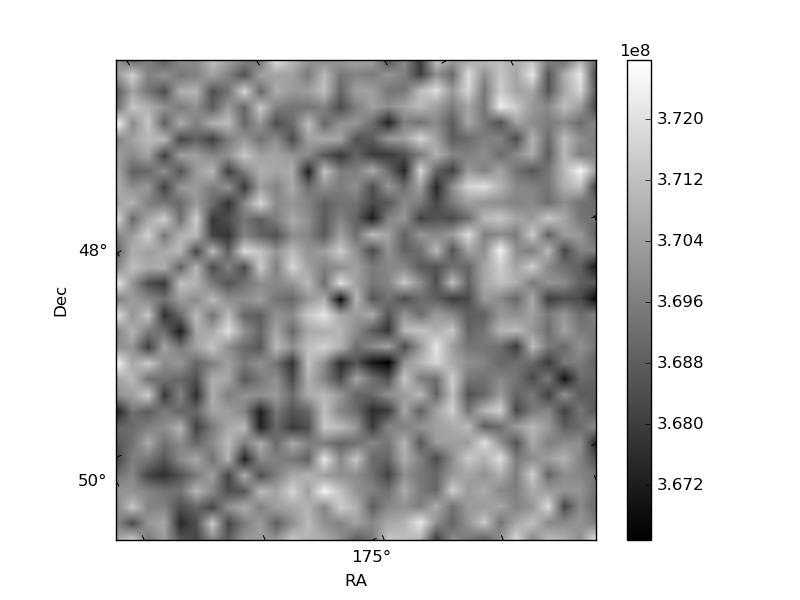
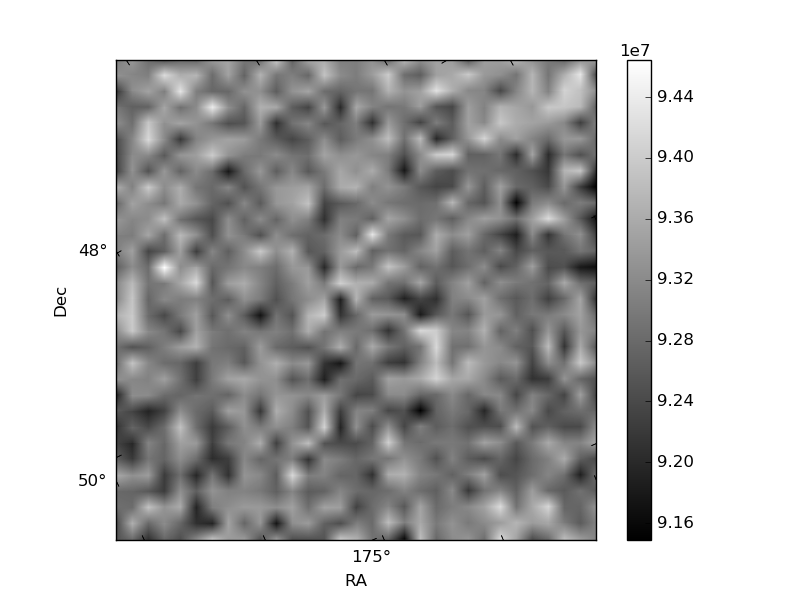
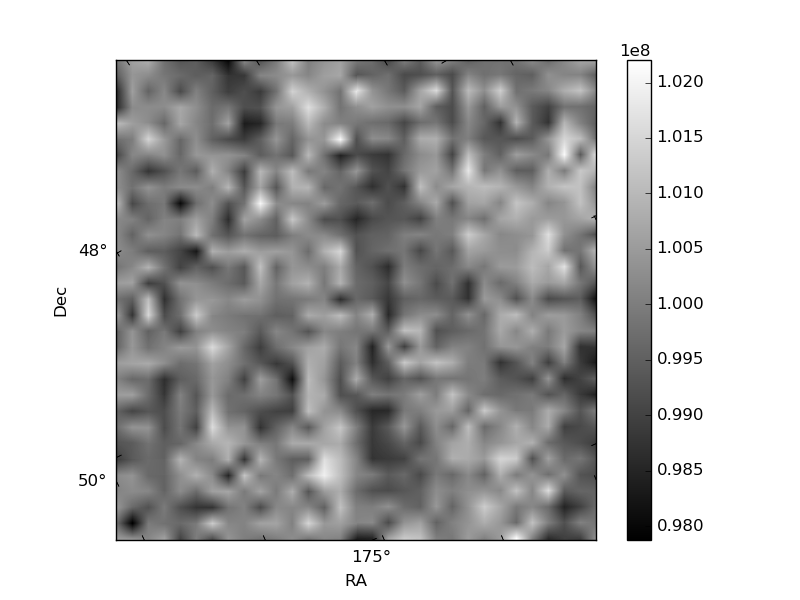
Histogram calculated using DETX and DETY for each event in the final _common_clean file
| Quadrant A | 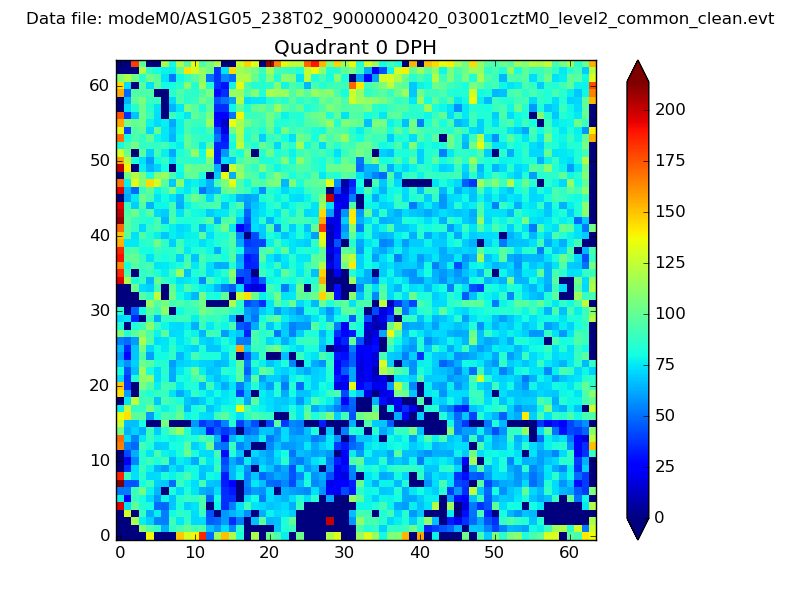 |
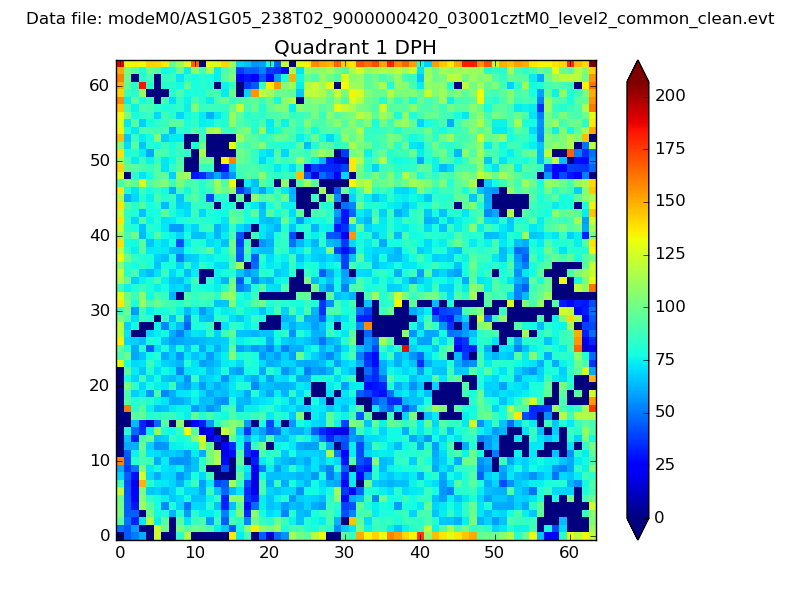 |
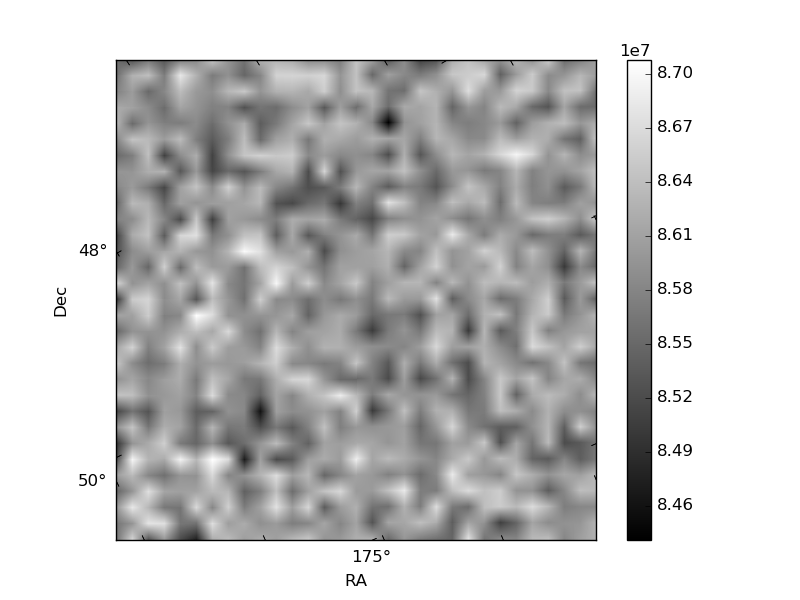
Quadrant B |
|---|---|---|---|
| Quadrant D | 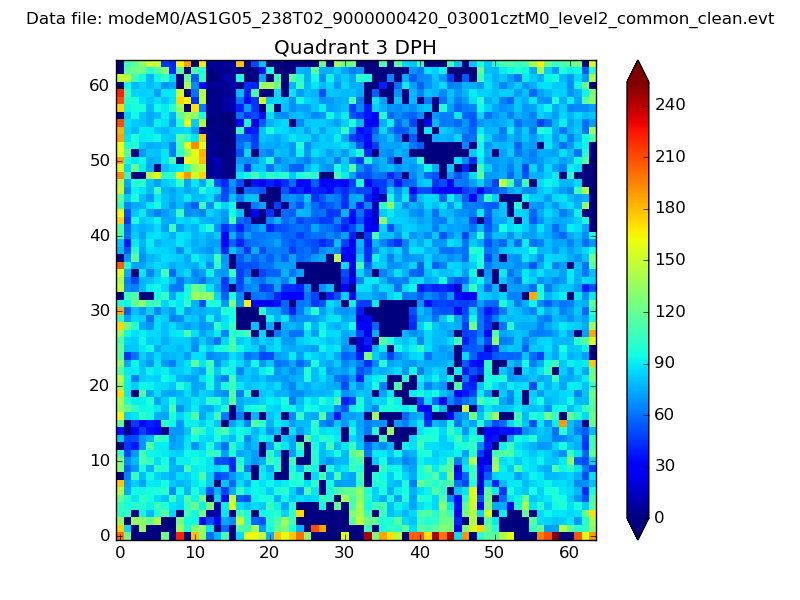 |
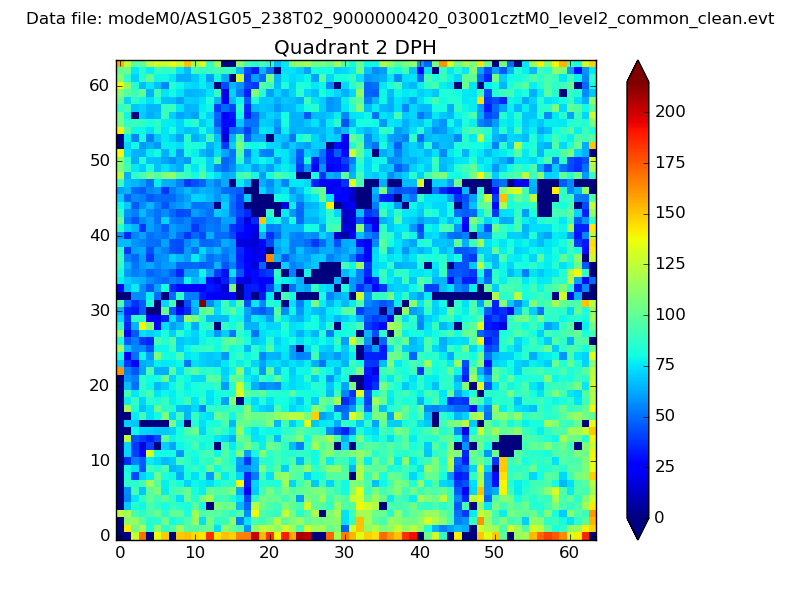 |
Quadrant C |
| Plot type | Count rate plots | Images |
|---|---|---|
| Comparison with Poisson distribution Blue bars denote a histogram of data divided into 1 sec bins. Red curve is a Poisson curve with rate = median count rate of data. |
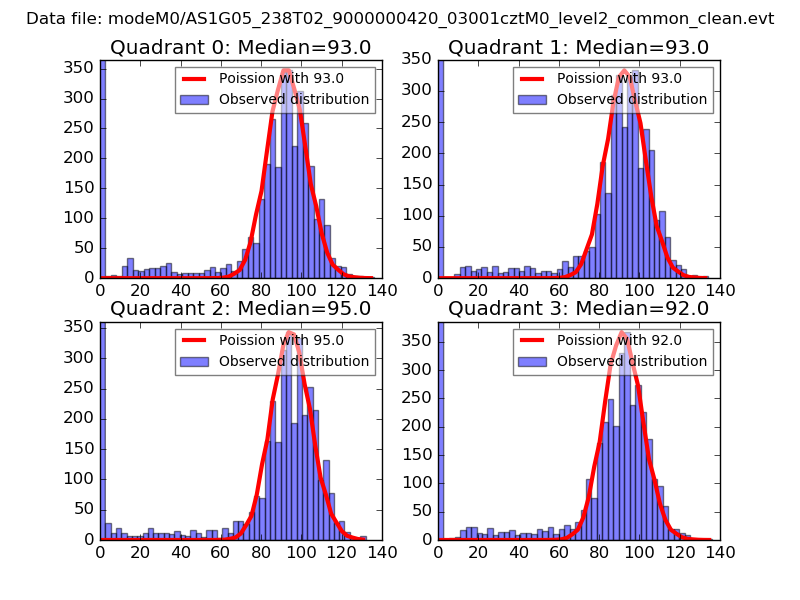 |
 |
| Quadrant-wise count rates Data is divided into 100 sec bins |
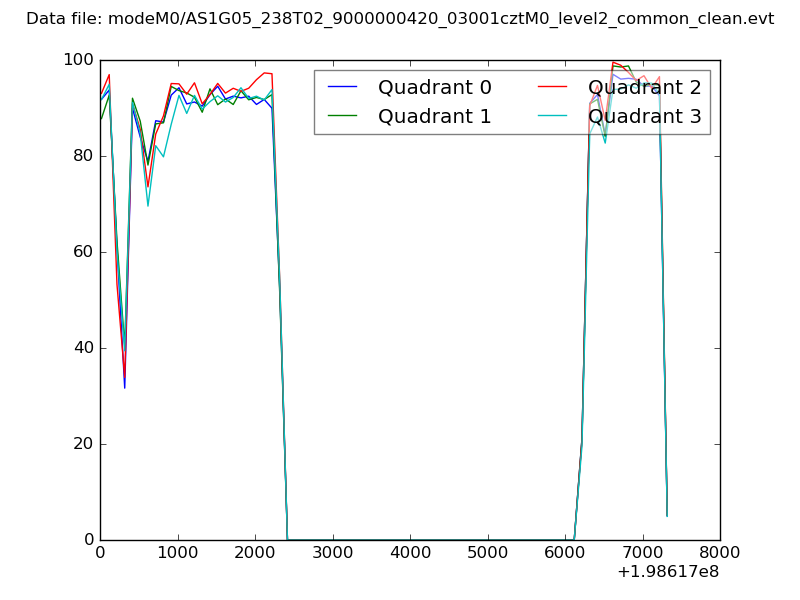 |
|
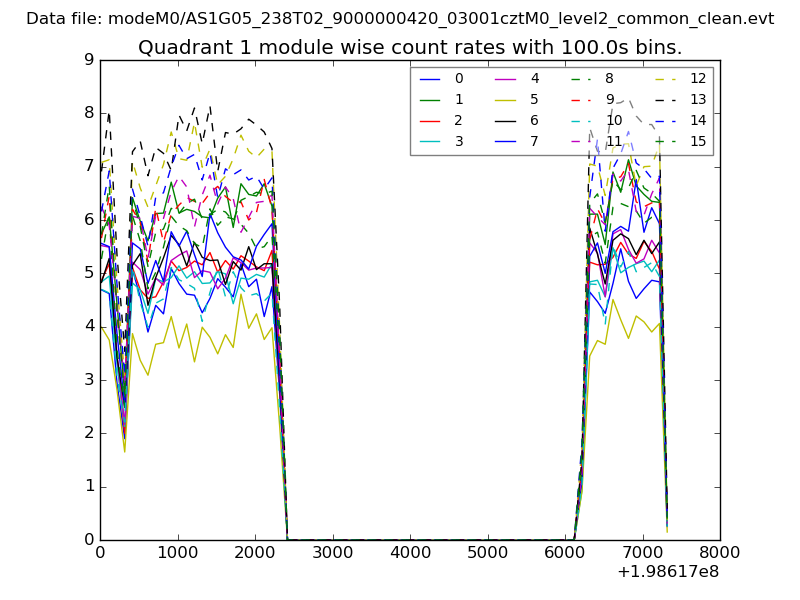
| Module-wise count rates for Quadrant A Data is divided into 100 sec bins |
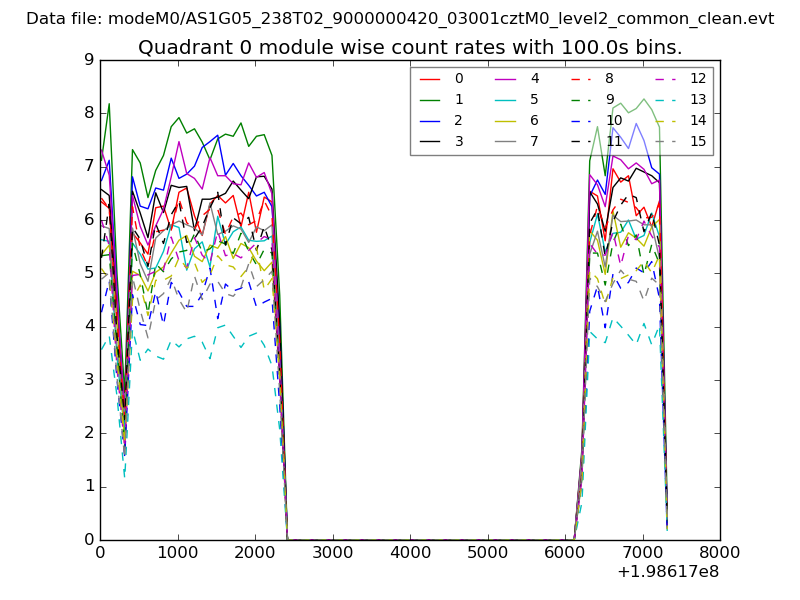 |
 |
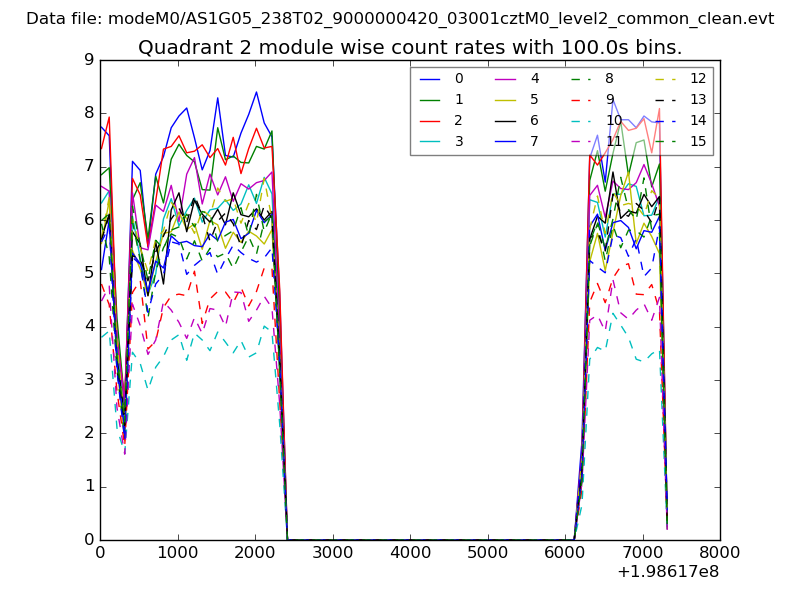
| Module-wise count rates for Quadrant B Data is divided into 100 sec bins |
 |
 |
| Module-wise count rates for Quadrant C Data is divided into 100 sec bins |
 |
 |
| Module-wise count rates for Quadrant D Data is divided into 100 sec bins |
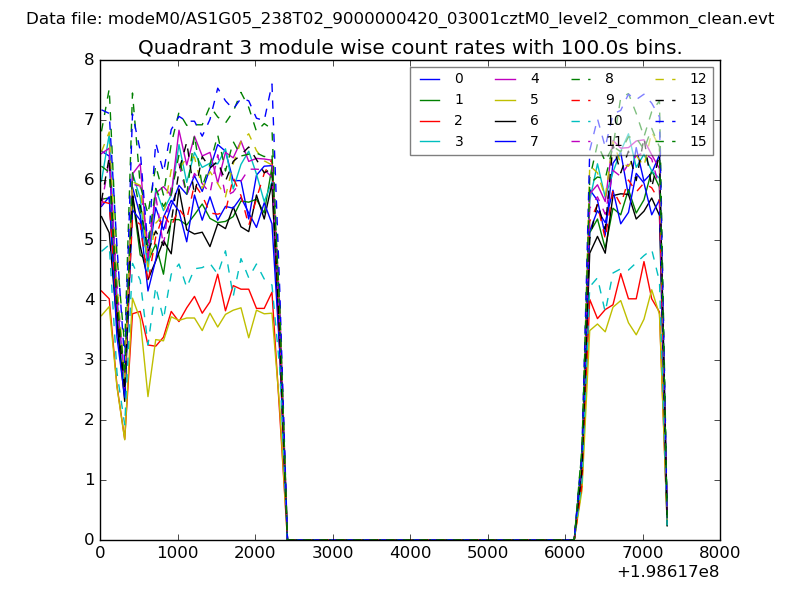 |
 |
| Parameter | Plot |
|---|---|
| CZT HV Monitor | 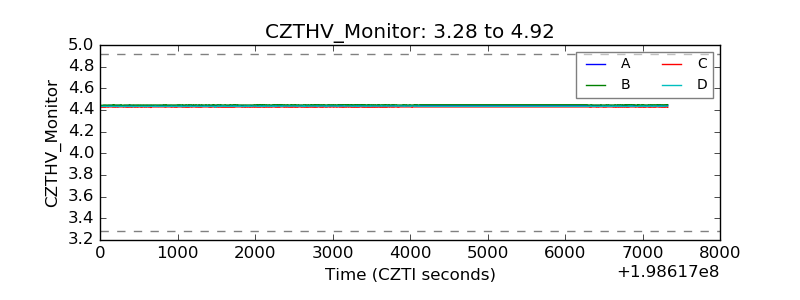 |
| D_VDD | 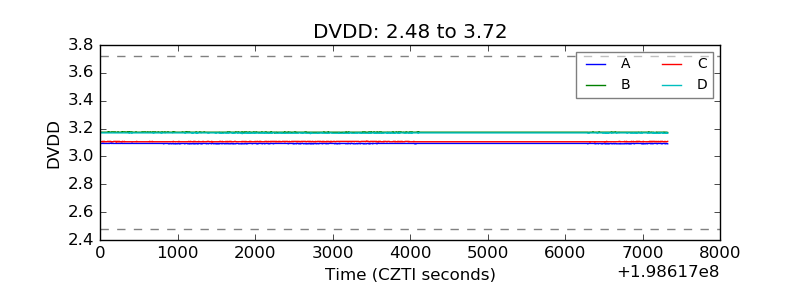 |
| Temperature 1 | 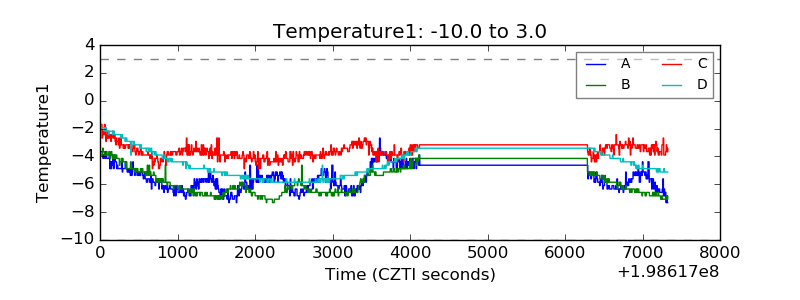 |
| Veto HV Monitor | 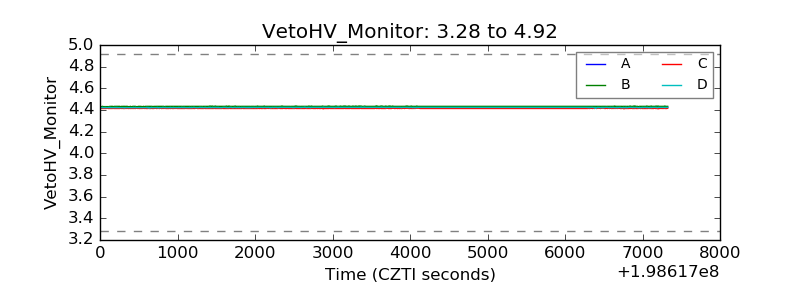 |
| Veto LLD | 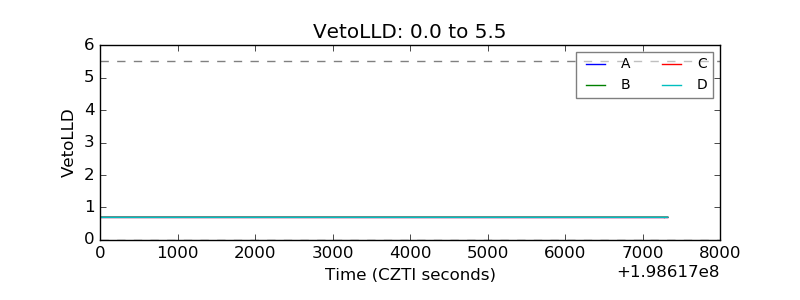 |
| Alpha Counter | 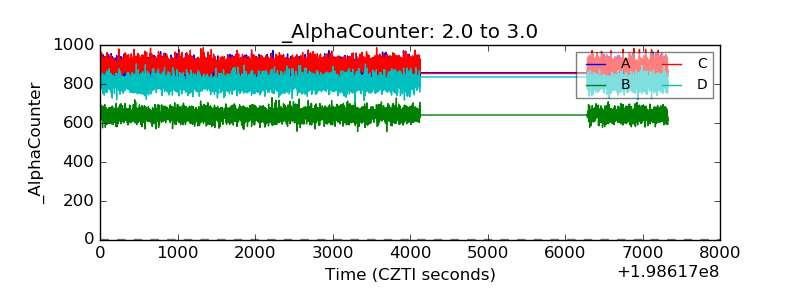 |
| _CPM_Rate | 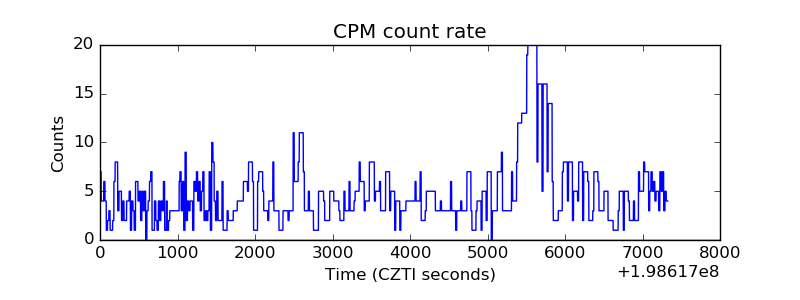 |
| CZT Counter | 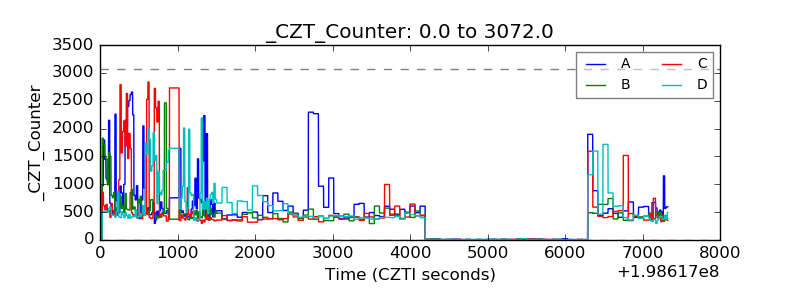 |
| +2.5 Volts monitor |  |
| +5 Volts monitor |  |
| Veto Counter | 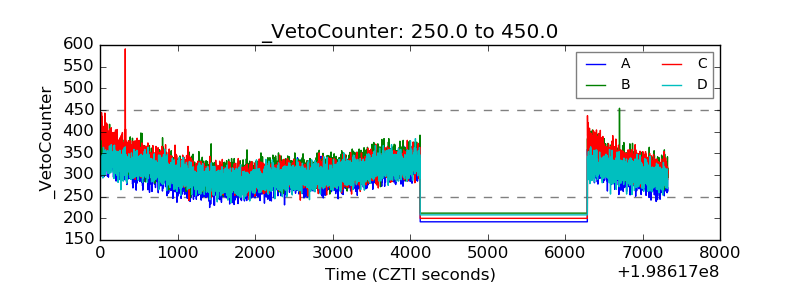 |