| Param | Original file | Final file |
|---|---|---|
| Filename | modeM0/AS1G05_238T02_9000000420_03004cztM0_level2.evt | modeM0/AS1G05_238T02_9000000420_03004cztM0_level2_quad_clean.evt |
| Size (bytes) | 838,068,480 | 80,861,760 |
| Size | 799.2 MB | 77.1 MB |
| Events in quadrant A | 8,669,742 | 424,208 |
| Events in quadrant B | 5,890,661 | 458,631 |
| Events in quadrant C | 6,025,252 | 459,817 |
| Events in quadrant D | 4,161,260 | 454,427 |
| Mode M0 | |||
|---|---|---|---|
| Quadrant | BADHDUFLAG | Total packets | Discarded packets |
| A | 0 | 32141 | 4 |
| B | 0 | 23778 | 3 |
| C | 0 | 24804 | 3 |
| D | 0 | 20029 | 3 |
| Mode SS | |||
|---|---|---|---|
| Quadrant | BADHDUFLAG | Total packets | Discarded packets |
| A | 0 | 192 | 0 |
| B | 0 | 192 | 0 |
| C | 0 | 192 | 0 |
| D | 0 | 192 | 0 |
| Mode M9 | |||
|---|---|---|---|
| Quadrant | BADHDUFLAG | Total packets | Discarded packets |
| A | 0 | 58 | 0 |
| B | 0 | 58 | 0 |
| C | 0 | 58 | 0 |
| D | 0 | 59 | 0 |
| Quadrant | Total seconds | Saturated seconds | Saturation percentage |
|---|---|---|---|
| A | 9382 | 1003 | 10.690684% |
| B | 9382 | 92 | 0.980601% |
| C | 9382 | 316 | 3.368152% |
| D | 9382 | 94 | 1.001919% |
Noise dominated data is calculated using 1-second bins in cleaned event files. If a bin has >2000 counts, and if more than 50% of those come from <1% of pixels, then it is considered to be noise-dominated and hence unusable.
| Quadrant | # 1 sec bins | Bins with >0 counts | Bins with >2000 counts | High rate bins dominated by noise | Noise dominated (total time) | Noise dominated (detector-on time) | Marked lightcurve |
|---|---|---|---|---|---|---|---|
| A | 13693 | 9384 | 885 | 885 | 6.46% | 9.43% | 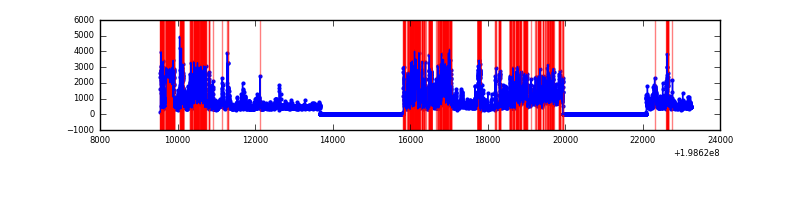 |
| B | 13693 | 9384 | 57 | 57 | 0.42% | 0.61% | 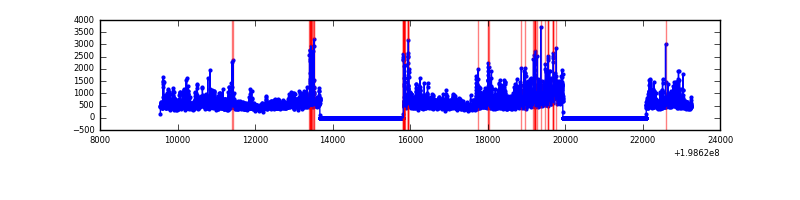 |
| C | 13693 | 9384 | 343 | 343 | 2.50% | 3.66% | 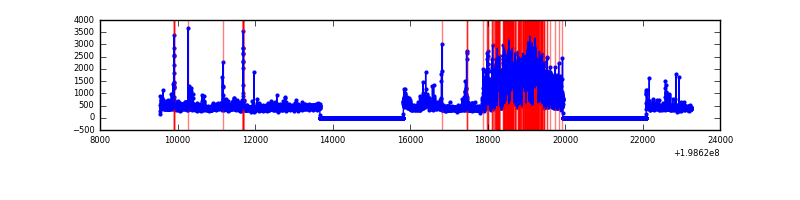 |
| D | 13693 | 9384 | 73 | 73 | 0.53% | 0.78% | 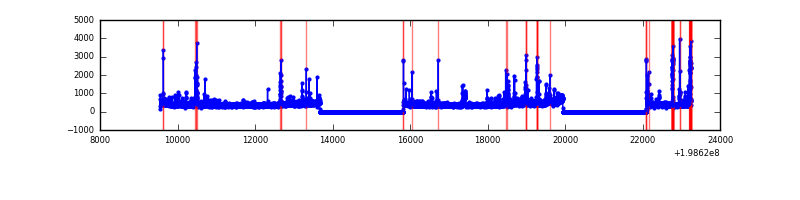 |
Top three noisy pixels from each quadrant. If the there are fewer than three noisy pixels in the level2.evt file, extra rows are filled as -1
| Pixel properties | Quadrant properties | ||||||
|---|---|---|---|---|---|---|---|
| Quadrant | DetID | PixID | Counts | Sigma | Mean | Median | Sigma |
| A | 13 | 9 | 4454870 | 23205.34 | 944 | 924 | 191.9 |
| A | 14 | 249 | 334811 | 1739.57 | 944 | 924 | 191.9 |
| A | 0 | 50 | 145326 | 752.34 | 944 | 924 | 191.9 |
| B | 8 | 3 | 1790818 | 9327.55 | 999 | 975 | 191.9 |
| B | 5 | 70 | 65699 | 337.3 | 999 | 975 | 191.9 |
| B | 3 | 27 | 43380 | 220.99 | 999 | 975 | 191.9 |
| C | 0 | 219 | 2082931 | 9435.89 | 947 | 953 | 220.6 |
| C | 6 | 80 | 173986 | 784.22 | 947 | 953 | 220.6 |
| C | 1 | 192 | 51945 | 231.1 | 947 | 953 | 220.6 |
| D | 7 | 80 | 119436 | 511.46 | 940 | 913 | 231.7 |
| D | 13 | 114 | 72236 | 307.78 | 940 | 913 | 231.7 |
| D | 13 | 239 | 70434 | 300.0 | 940 | 913 | 231.7 |
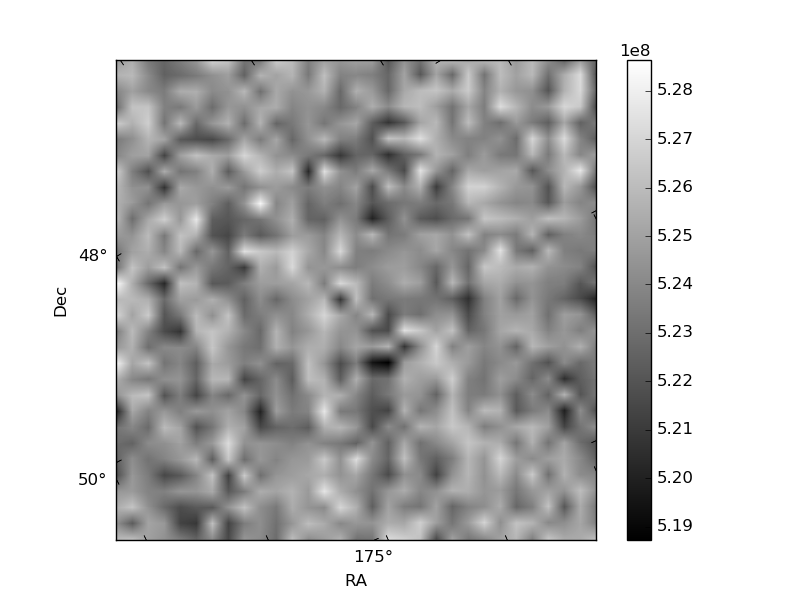
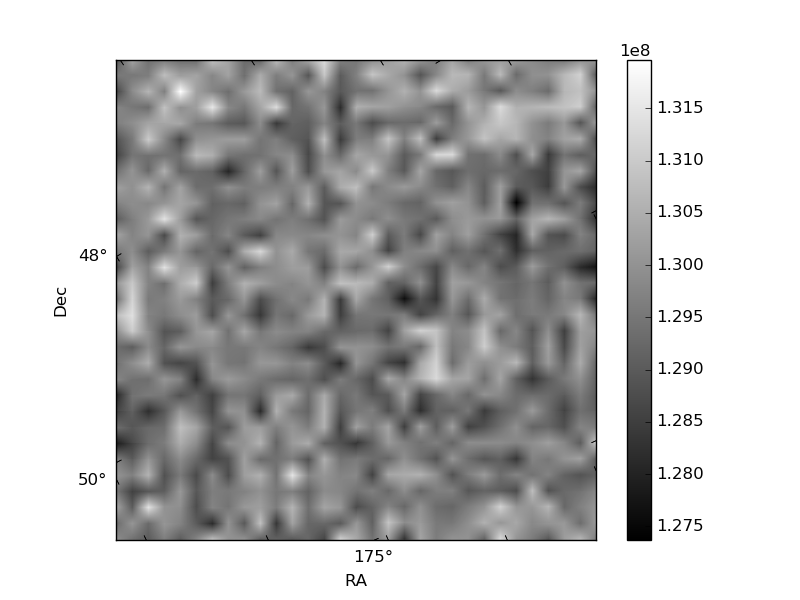
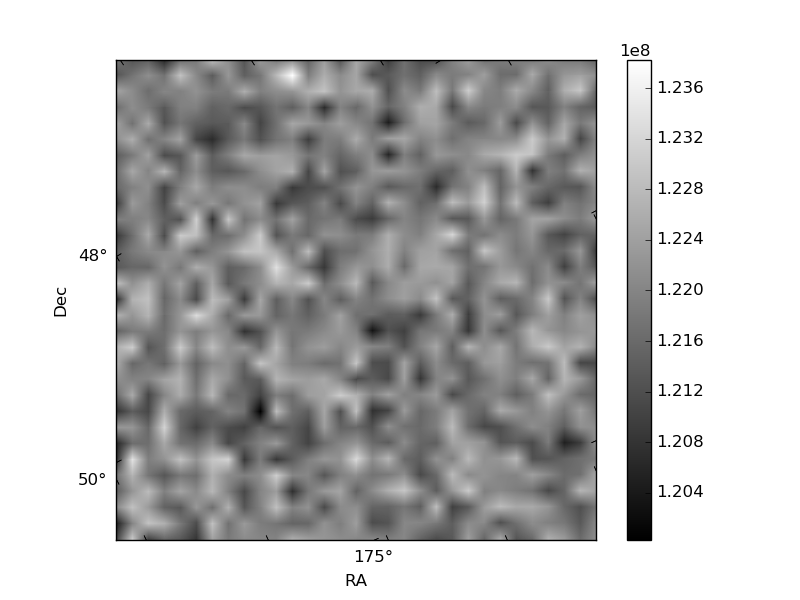
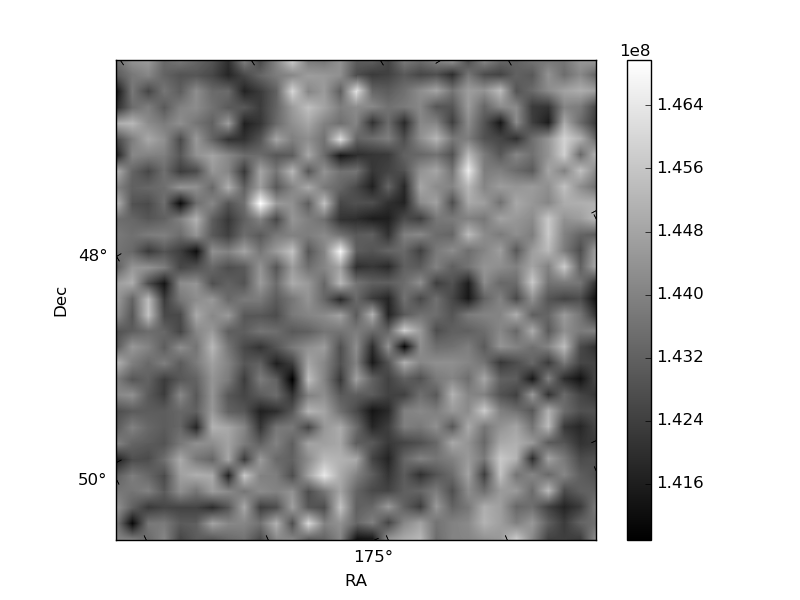
Histogram calculated using DETX and DETY for each event in the final _common_clean file
| Quadrant A | 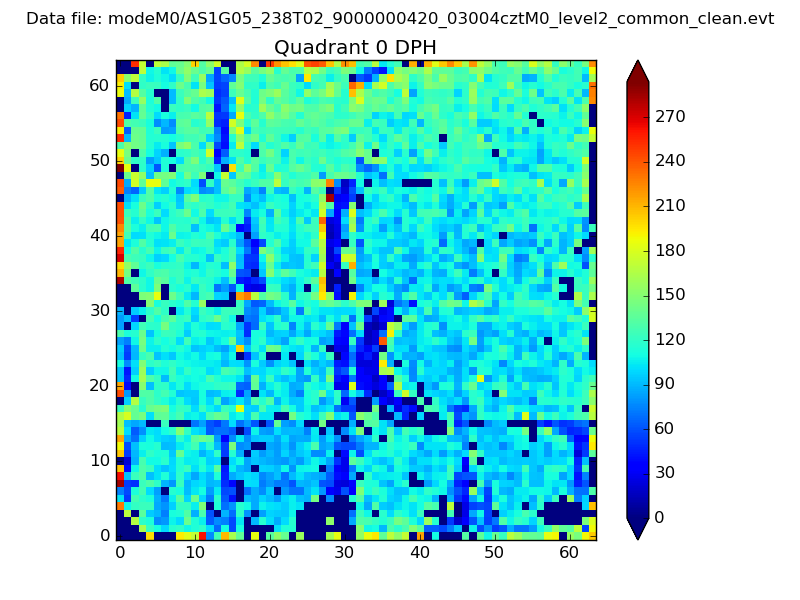 |
 |
Quadrant B |
|---|---|---|---|
| Quadrant D | 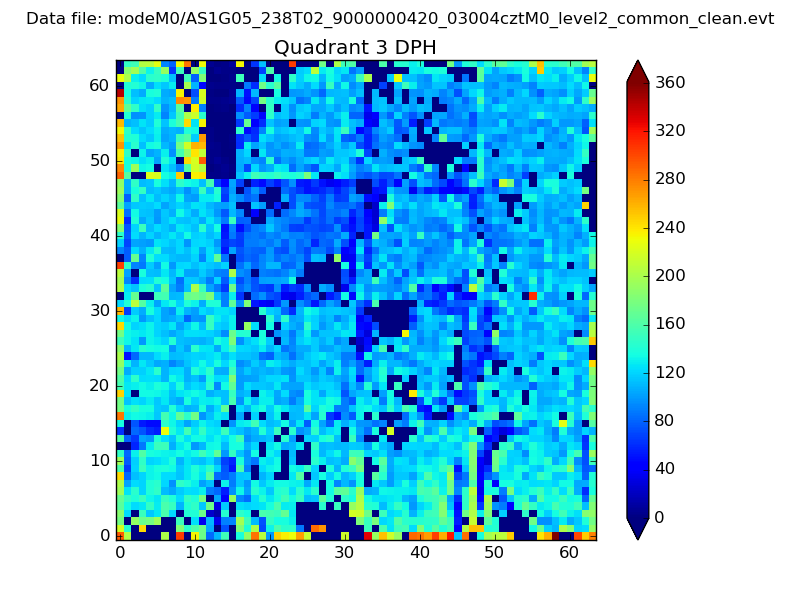 |
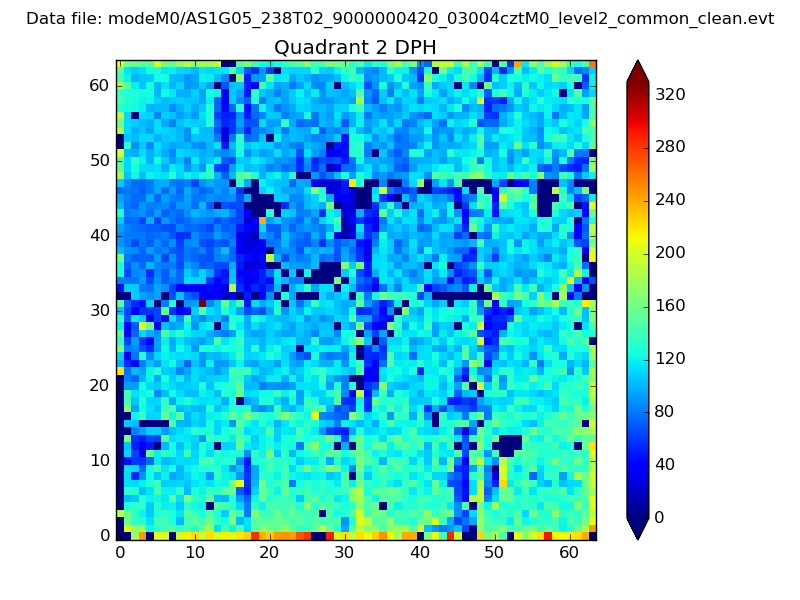 |
Quadrant C |
| Plot type | Count rate plots | Images |
|---|---|---|
| Comparison with Poisson distribution Blue bars denote a histogram of data divided into 1 sec bins. Red curve is a Poisson curve with rate = median count rate of data. |
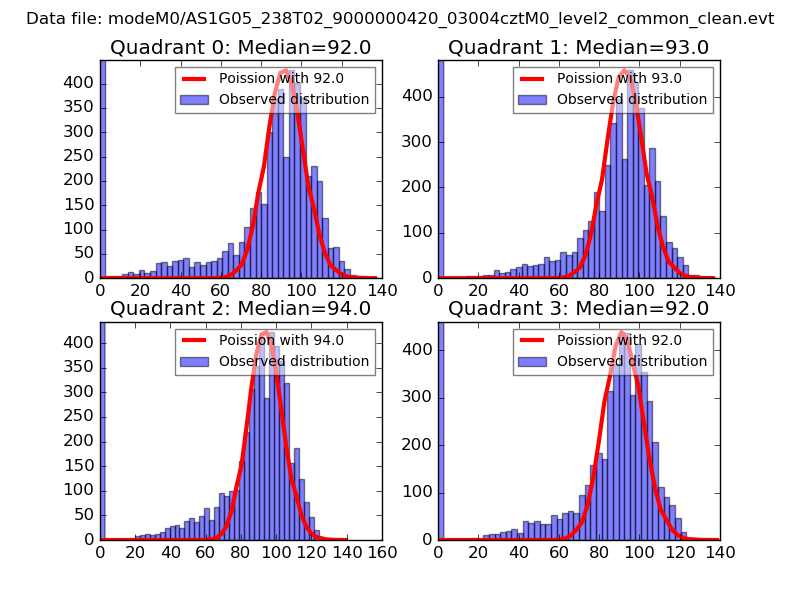 |
 |
| Quadrant-wise count rates Data is divided into 100 sec bins |
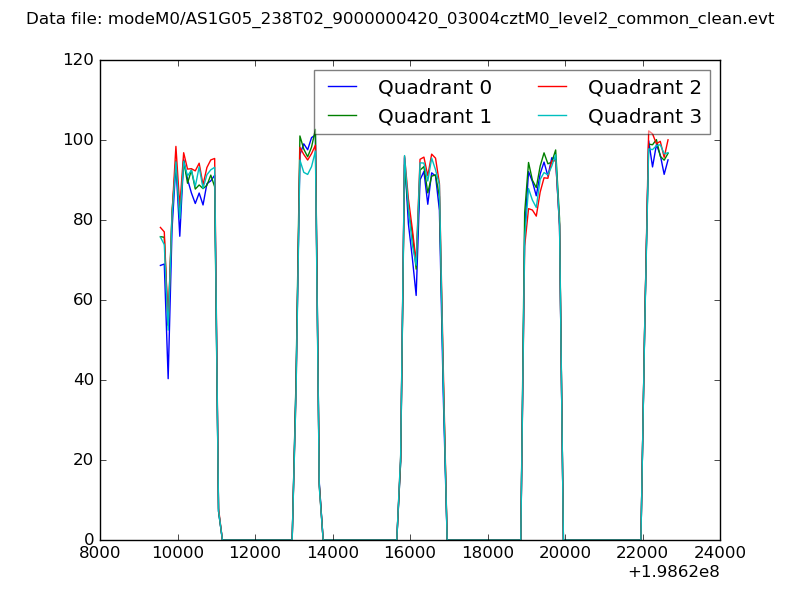 |
|
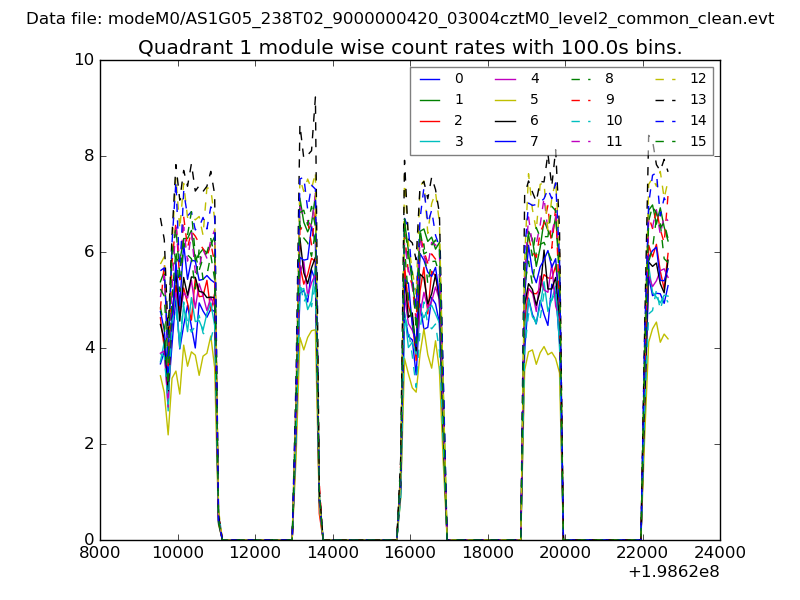
| Module-wise count rates for Quadrant A Data is divided into 100 sec bins |
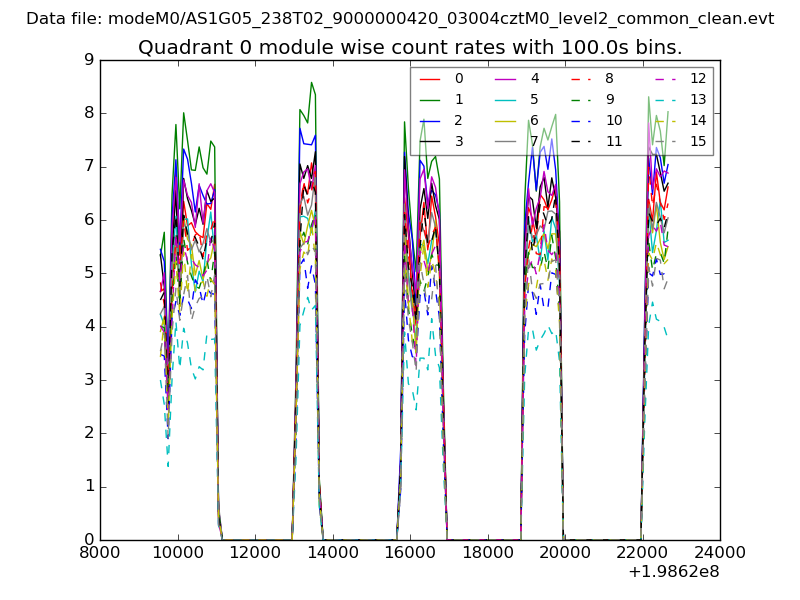 |
 |
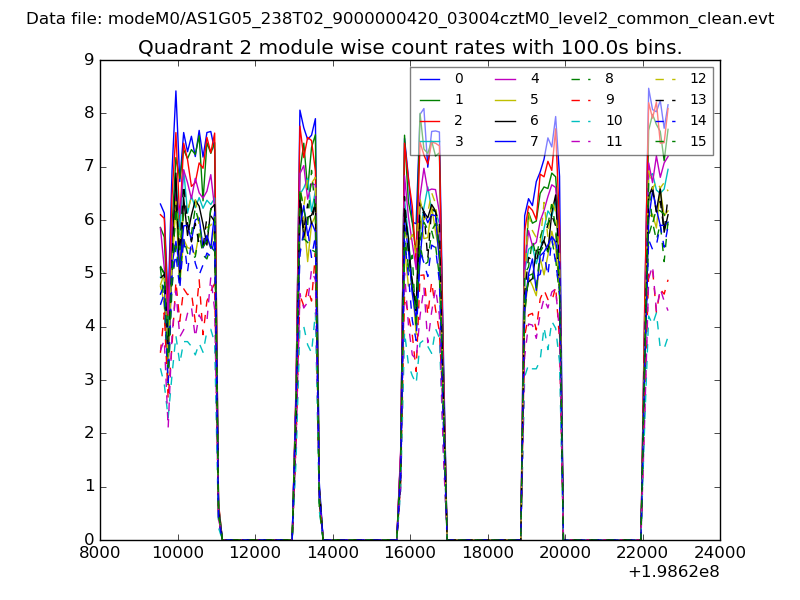
| Module-wise count rates for Quadrant B Data is divided into 100 sec bins |
 |
 |
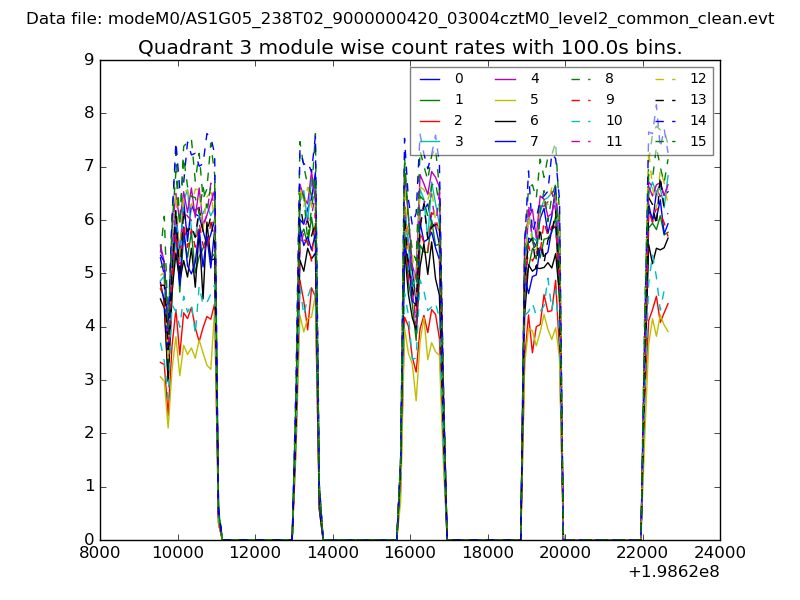
| Module-wise count rates for Quadrant C Data is divided into 100 sec bins |
 |
 |
| Module-wise count rates for Quadrant D Data is divided into 100 sec bins |
 |
 |
| Parameter | Plot |
|---|---|
| CZT HV Monitor | 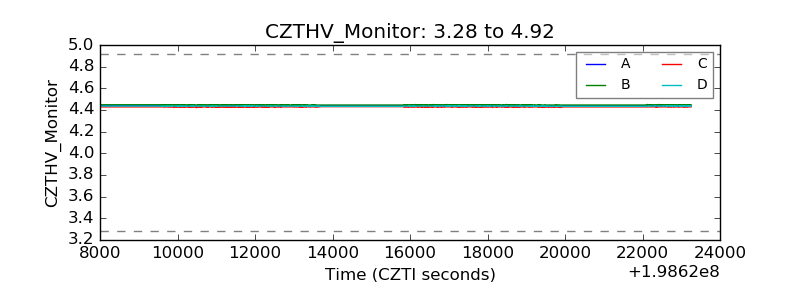 |
| D_VDD | 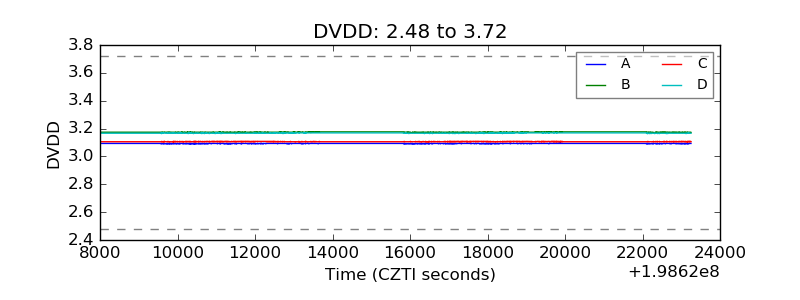 |
| Temperature 1 | 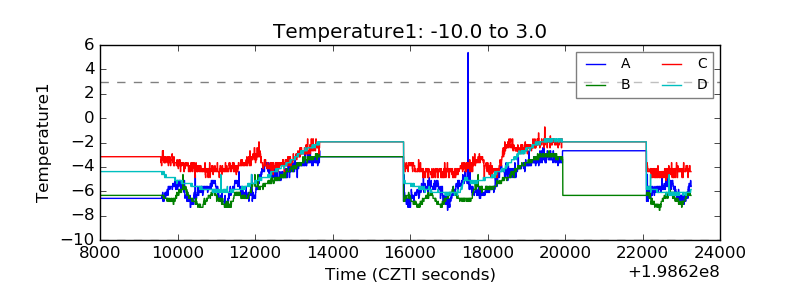 |
| Veto HV Monitor | 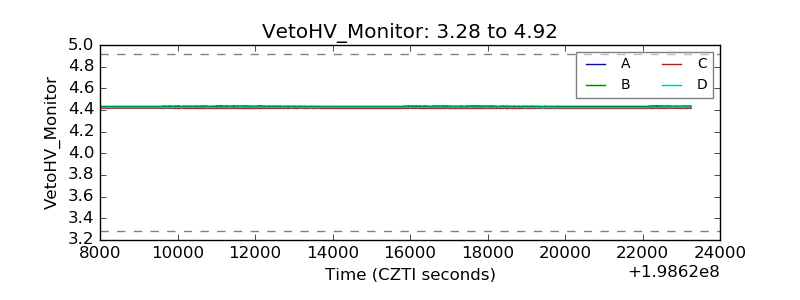 |
| Veto LLD | 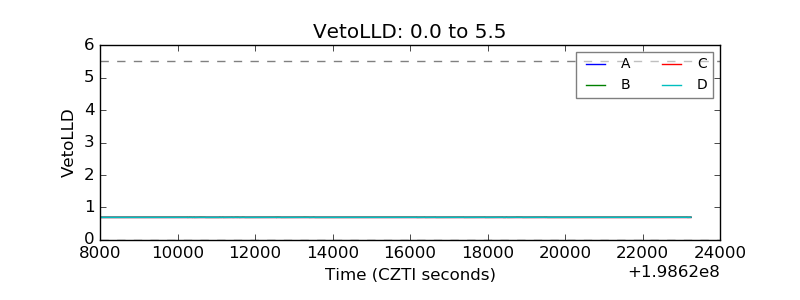 |
| Alpha Counter | 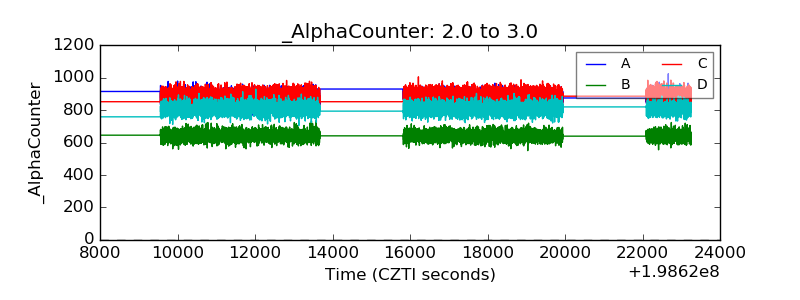 |
| _CPM_Rate | 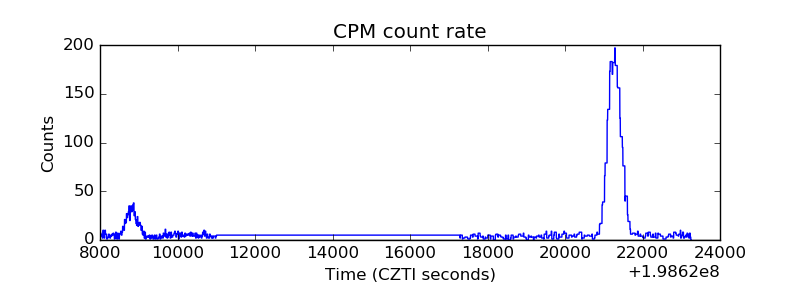 |
| CZT Counter | 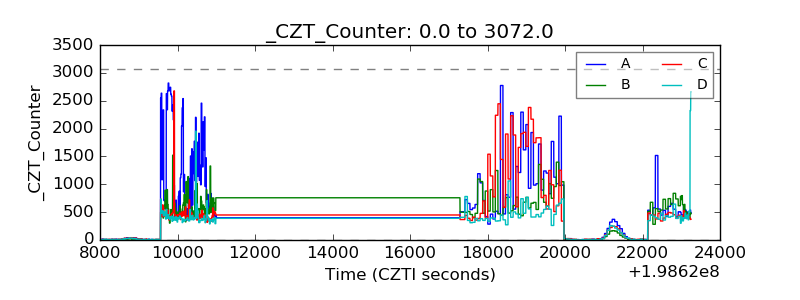 |
| +2.5 Volts monitor |  |
| +5 Volts monitor |  |
| Veto Counter | 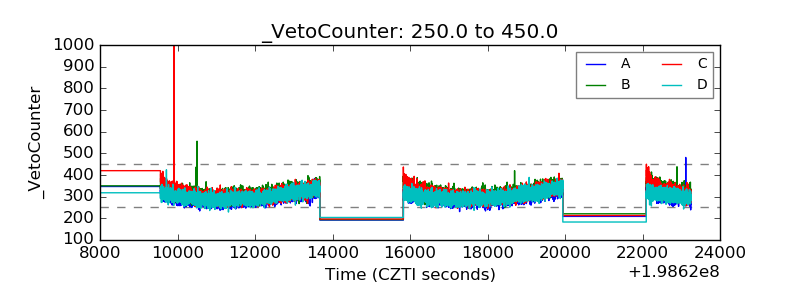 |