| Param | Original file | Final file |
|---|---|---|
| Filename | modeM0/AS1G05_238T02_9000000420_03005cztM0_level2.evt | modeM0/AS1G05_238T02_9000000420_03005cztM0_level2_quad_clean.evt |
| Size (bytes) | 452,692,800 | 41,492,160 |
| Size | 431.7 MB | 39.6 MB |
| Events in quadrant A | 5,023,089 | 217,438 |
| Events in quadrant B | 3,280,493 | 227,754 |
| Events in quadrant C | 2,221,275 | 227,916 |
| Events in quadrant D | 2,835,825 | 222,118 |
| Mode M0 | |||
|---|---|---|---|
| Quadrant | BADHDUFLAG | Total packets | Discarded packets |
| A | 0 | 18500 | 3 |
| B | 0 | 13185 | 2 |
| C | 0 | 10455 | 2 |
| D | 0 | 12328 | 2 |
| Mode SS | |||
|---|---|---|---|
| Quadrant | BADHDUFLAG | Total packets | Discarded packets |
| A | 0 | 106 | 0 |
| B | 0 | 106 | 0 |
| C | 0 | 106 | 0 |
| D | 0 | 106 | 0 |
| Mode M9 | |||
|---|---|---|---|
| Quadrant | BADHDUFLAG | Total packets | Discarded packets |
| A | 0 | 41 | 0 |
| B | 0 | 41 | 0 |
| C | 0 | 41 | 0 |
| D | 0 | 41 | 0 |
| Quadrant | Total seconds | Saturated seconds | Saturation percentage |
|---|---|---|---|
| A | 5138 | 593 | 11.541456% |
| B | 5138 | 60 | 1.167770% |
| C | 5138 | 9 | 0.175165% |
| D | 5138 | 191 | 3.717400% |
Noise dominated data is calculated using 1-second bins in cleaned event files. If a bin has >2000 counts, and if more than 50% of those come from <1% of pixels, then it is considered to be noise-dominated and hence unusable.
| Quadrant | # 1 sec bins | Bins with >0 counts | Bins with >2000 counts | High rate bins dominated by noise | Noise dominated (total time) | Noise dominated (detector-on time) | Marked lightcurve |
|---|---|---|---|---|---|---|---|
| A | 7293 | 5139 | 466 | 466 | 6.39% | 9.07% | 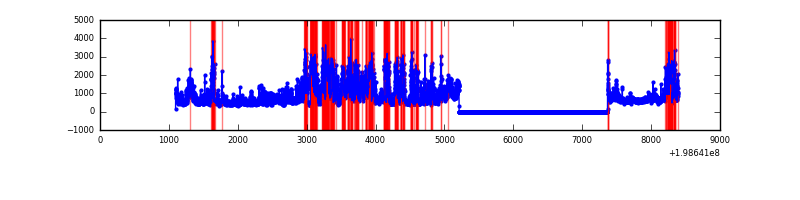 |
| B | 7293 | 5139 | 38 | 38 | 0.52% | 0.74% | 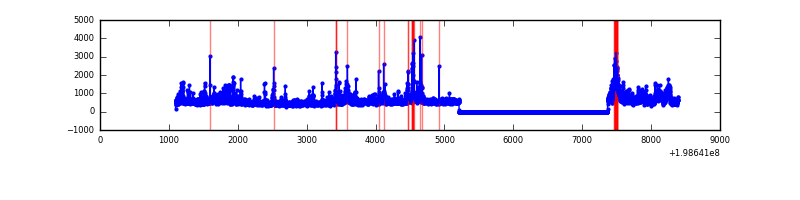 |
| C | 7293 | 5139 | 2 | 2 | 0.03% | 0.04% | 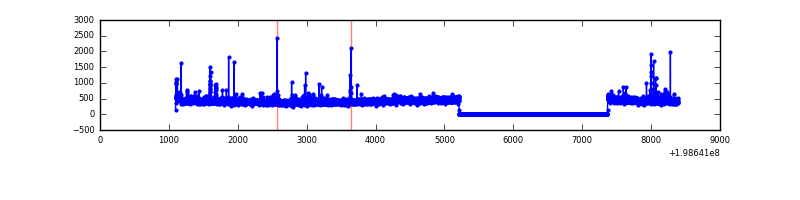 |
| D | 7293 | 5139 | 166 | 166 | 2.28% | 3.23% | 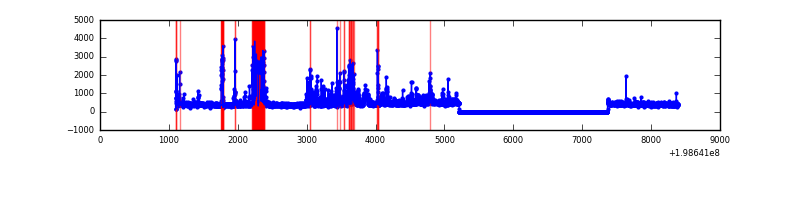 |
Top three noisy pixels from each quadrant. If the there are fewer than three noisy pixels in the level2.evt file, extra rows are filled as -1
| Pixel properties | Quadrant properties | ||||||
|---|---|---|---|---|---|---|---|
| Quadrant | DetID | PixID | Counts | Sigma | Mean | Median | Sigma |
| A | 13 | 9 | 1962991 | 17823.5 | 532 | 522 | 110.1 |
| A | 14 | 249 | 834317 | 7572.68 | 532 | 522 | 110.1 |
| A | 0 | 50 | 114616 | 1036.22 | 532 | 522 | 110.1 |
| B | 8 | 3 | 867038 | 7958.38 | 564 | 553 | 108.9 |
| B | 10 | 249 | 89321 | 815.3 | 564 | 553 | 108.9 |
| B | 2 | 249 | 48357 | 439.06 | 564 | 553 | 108.9 |
| C | 0 | 219 | 59772 | 467.2 | 536 | 538 | 126.8 |
| C | 6 | 80 | 47446 | 369.98 | 536 | 538 | 126.8 |
| C | 1 | 192 | 7504 | 54.94 | 536 | 538 | 126.8 |
| D | 7 | 80 | 357123 | 2769.73 | 523 | 506 | 128.8 |
| D | 12 | 1 | 225918 | 1750.7 | 523 | 506 | 128.8 |
| D | 13 | 223 | 50632 | 389.31 | 523 | 506 | 128.8 |
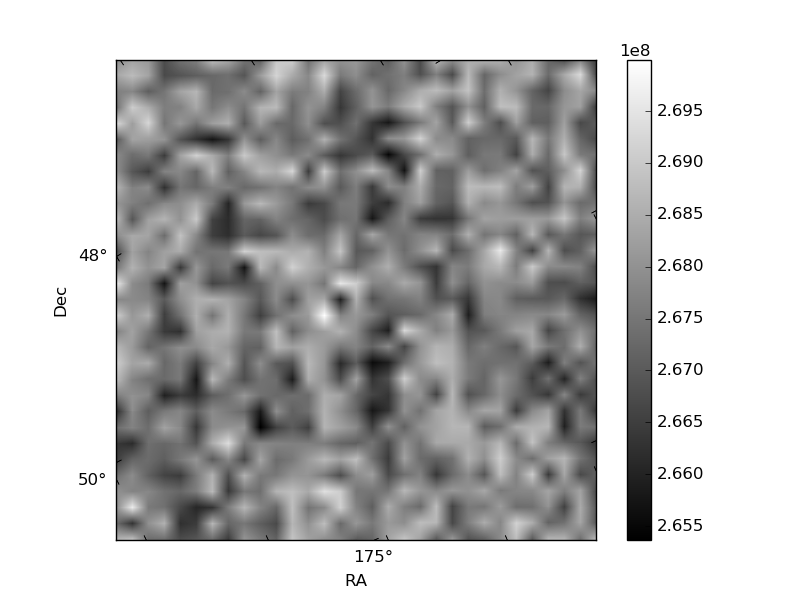
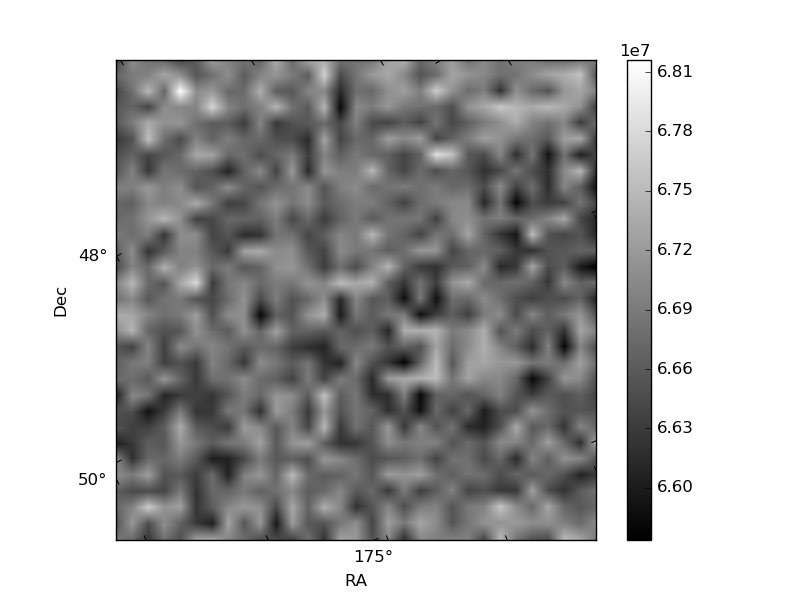
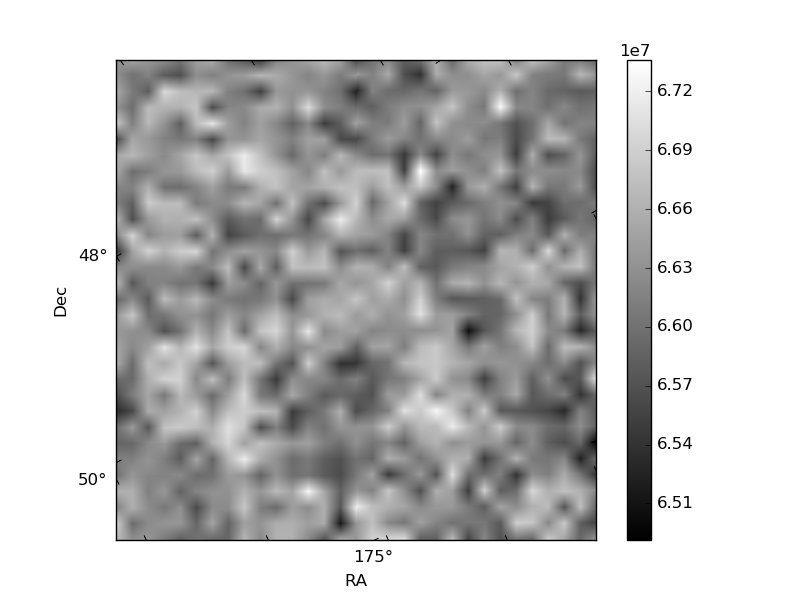
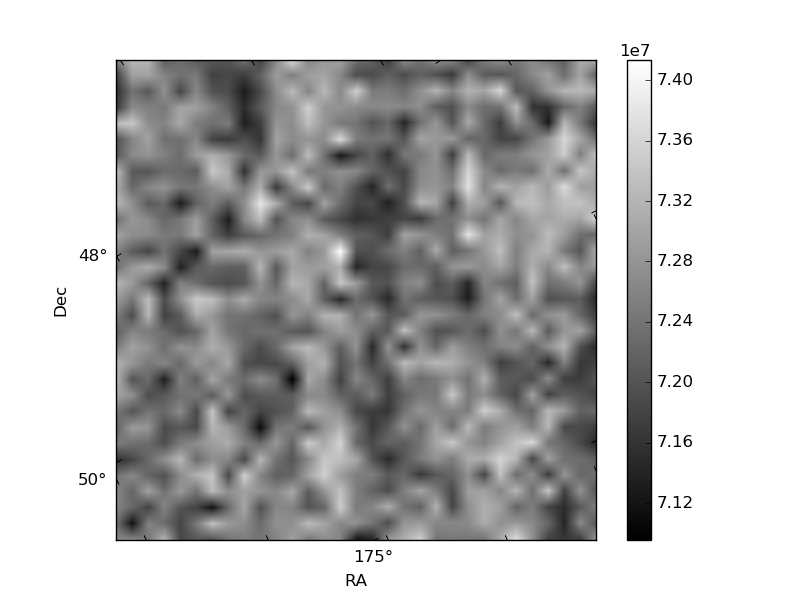
Histogram calculated using DETX and DETY for each event in the final _common_clean file
| Quadrant A | 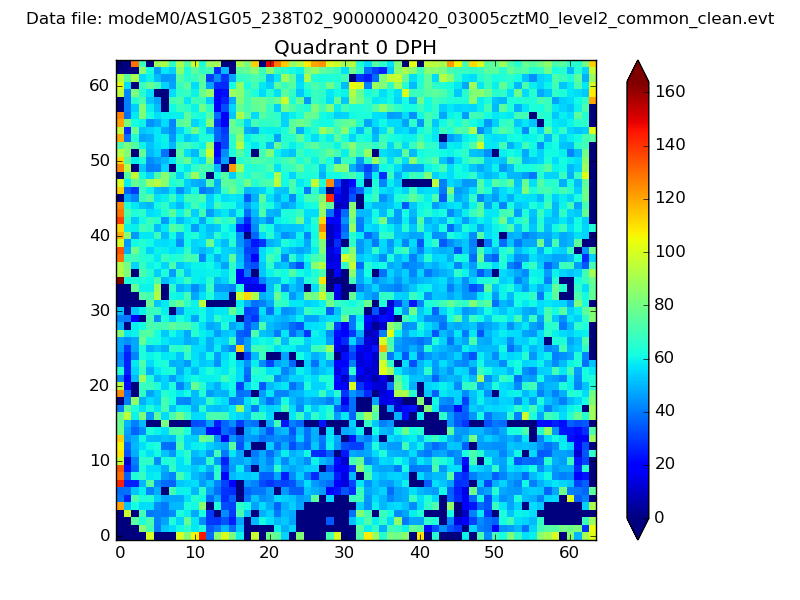 |
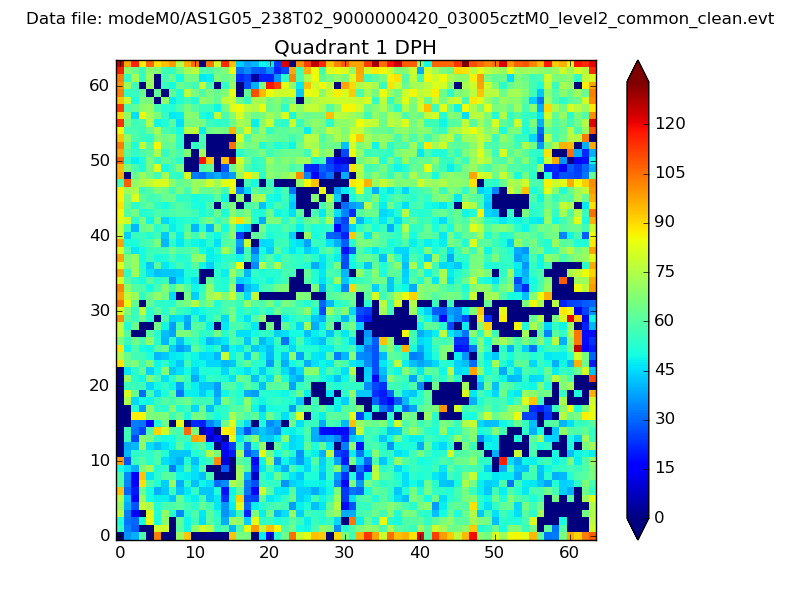 |
Quadrant B |
|---|---|---|---|
| Quadrant D | 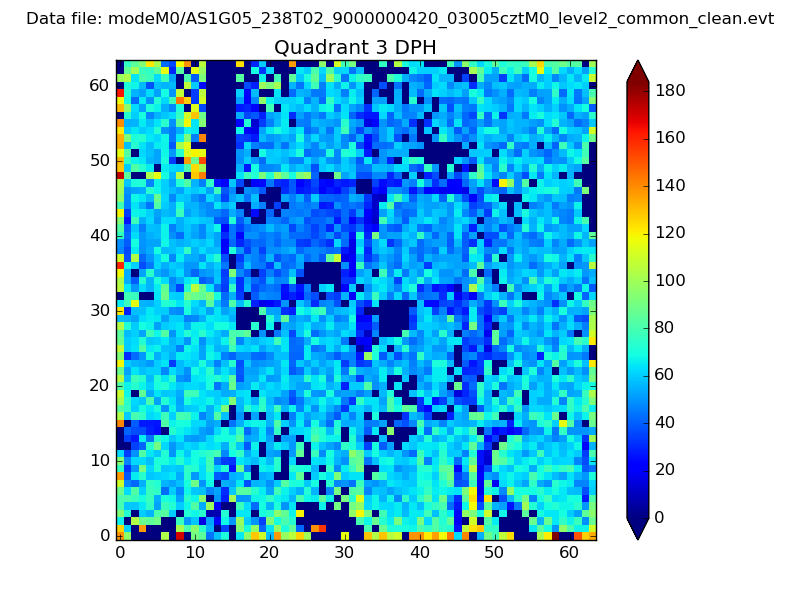 |
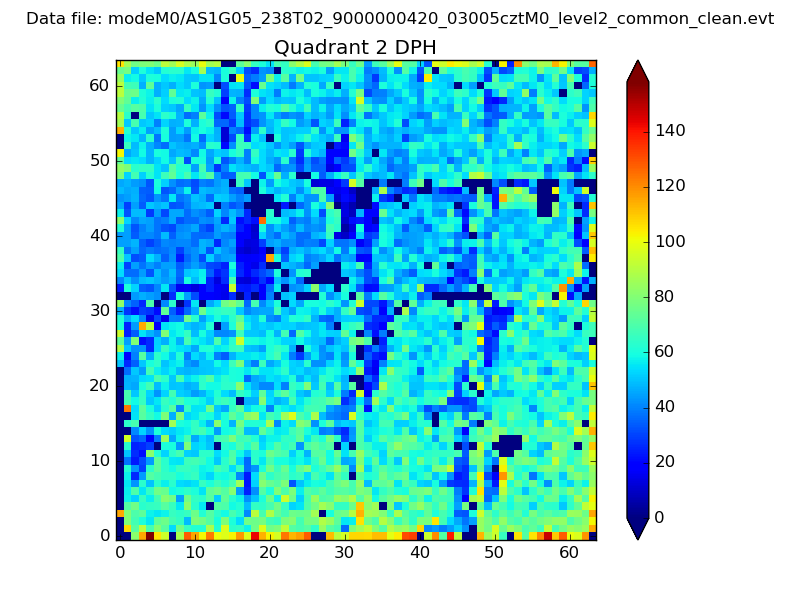 |
Quadrant C |
| Plot type | Count rate plots | Images |
|---|---|---|
| Comparison with Poisson distribution Blue bars denote a histogram of data divided into 1 sec bins. Red curve is a Poisson curve with rate = median count rate of data. |
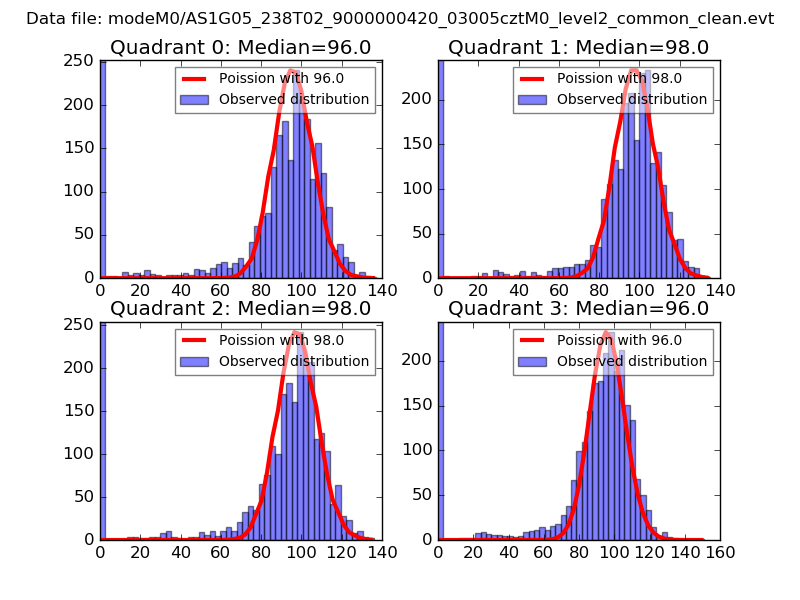 |
 |
| Quadrant-wise count rates Data is divided into 100 sec bins |
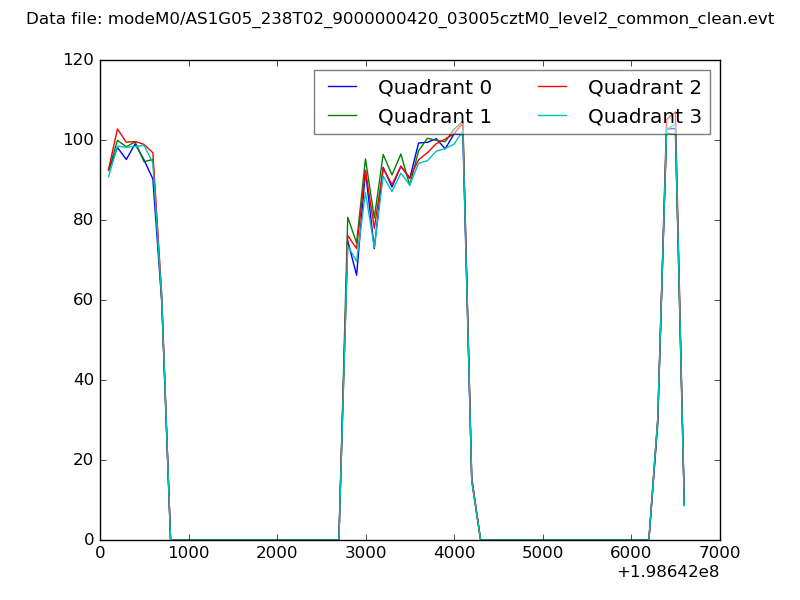 |
|
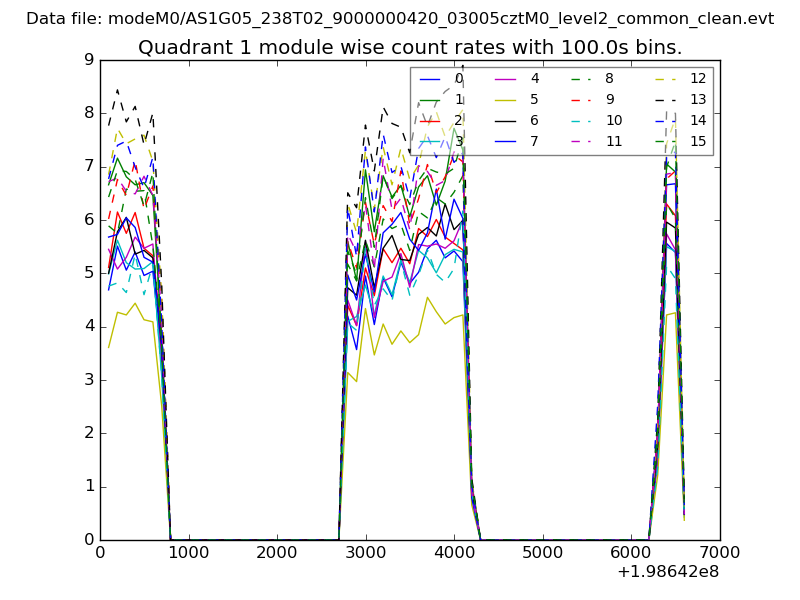
| Module-wise count rates for Quadrant A Data is divided into 100 sec bins |
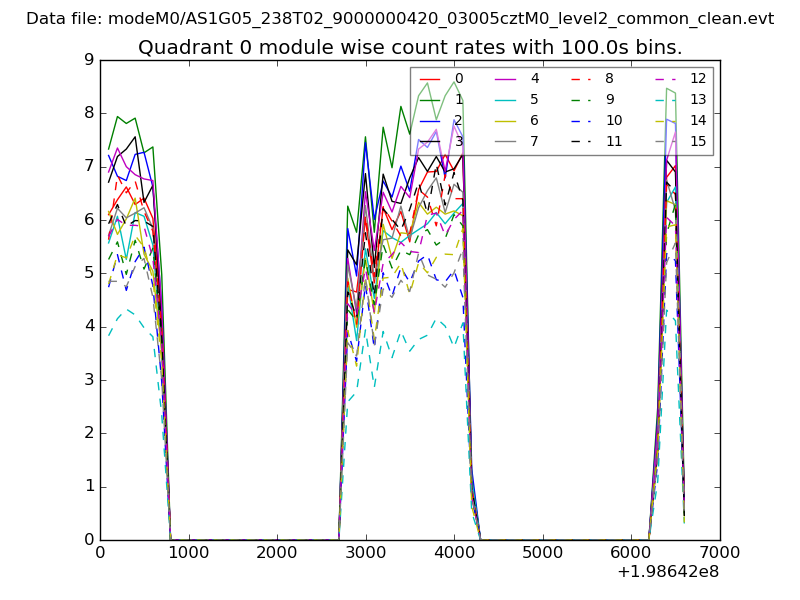 |
 |
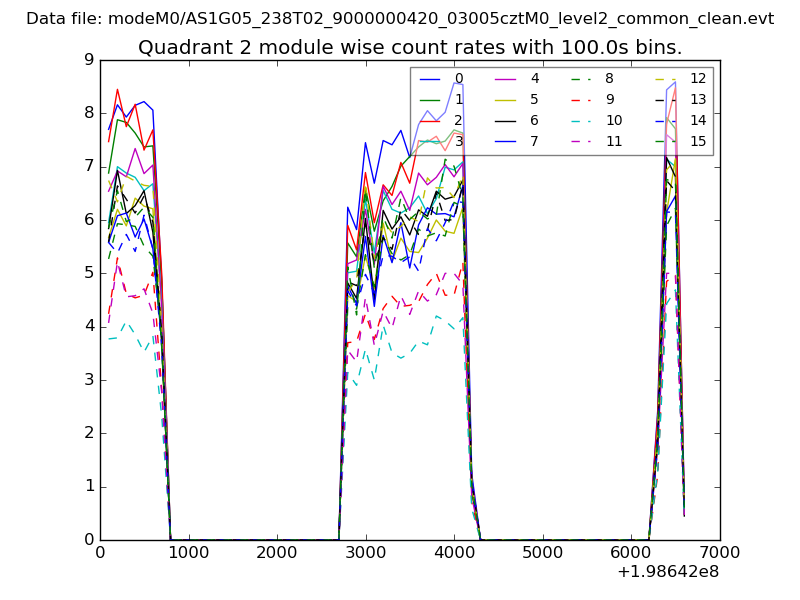
| Module-wise count rates for Quadrant B Data is divided into 100 sec bins |
 |
 |
| Module-wise count rates for Quadrant C Data is divided into 100 sec bins |
 |
 |
| Module-wise count rates for Quadrant D Data is divided into 100 sec bins |
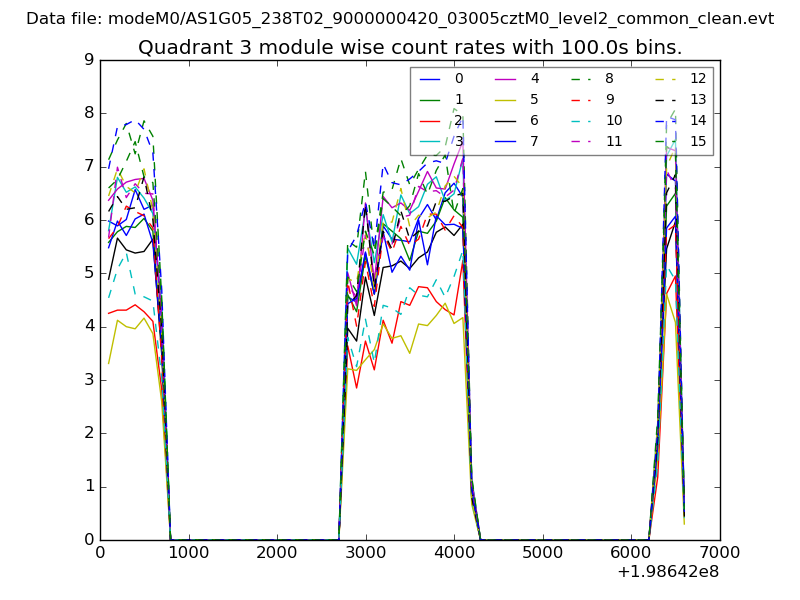 |
 |
| Parameter | Plot |
|---|---|
| CZT HV Monitor | 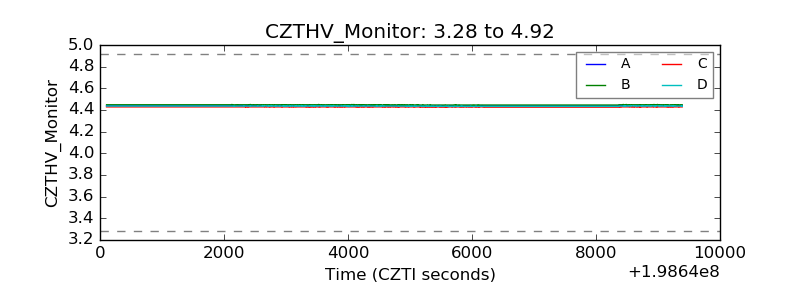 |
| D_VDD |  |
| Temperature 1 | 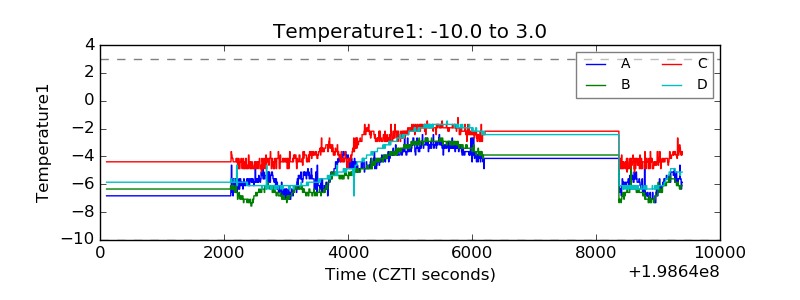 |
| Veto HV Monitor | 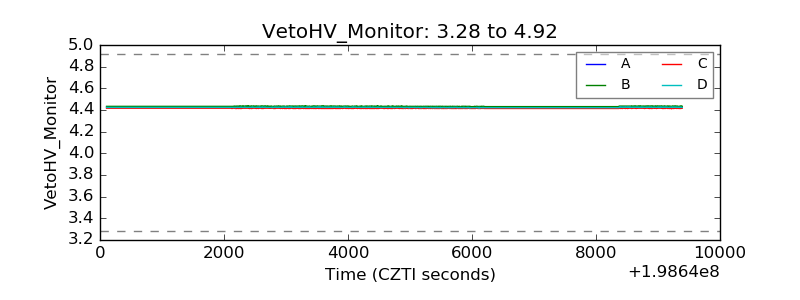 |
| Veto LLD | 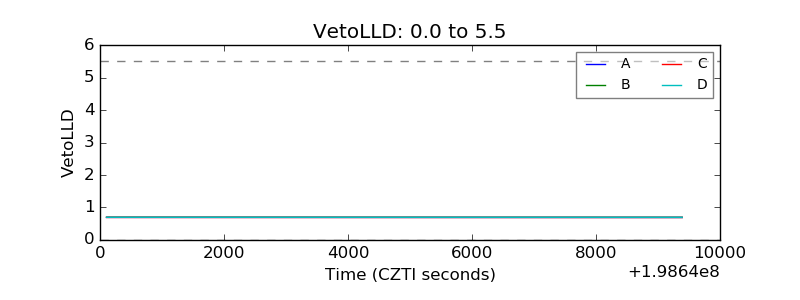 |
| Alpha Counter | 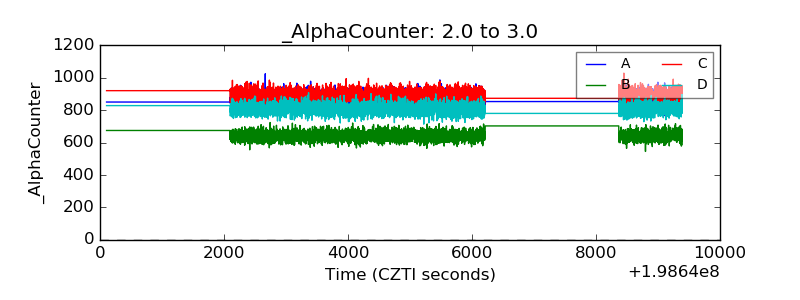 |
| _CPM_Rate | 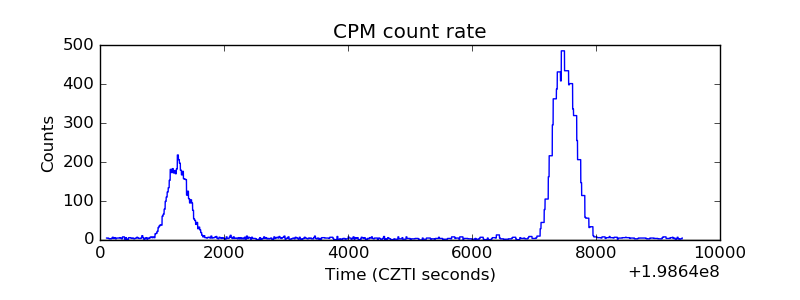 |
| CZT Counter | 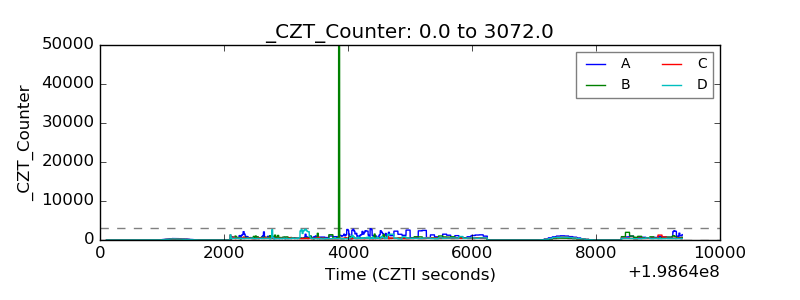 |
| +2.5 Volts monitor |  |
| +5 Volts monitor |  |
| Veto Counter | 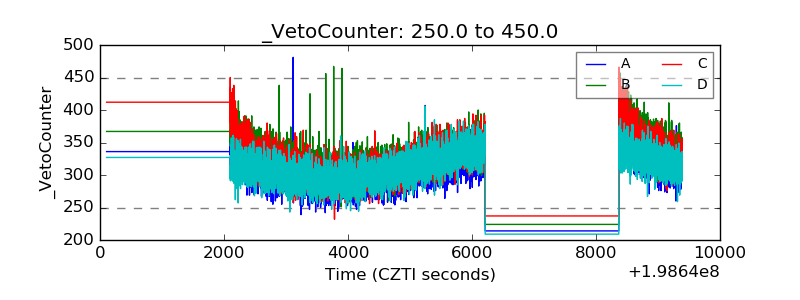 |