| Param | Original file | Final file |
|---|---|---|
| Filename | modeM0/AS1G05_238T02_9000000420_03006cztM0_level2.evt | modeM0/AS1G05_238T02_9000000420_03006cztM0_level2_quad_clean.evt |
| Size (bytes) | 514,166,400 | 38,033,280 |
| Size | 490.3 MB | 36.3 MB |
| Events in quadrant A | 5,526,632 | 196,501 |
| Events in quadrant B | 3,599,147 | 204,684 |
| Events in quadrant C | 3,594,247 | 196,968 |
| Events in quadrant D | 2,508,226 | 197,559 |
| Mode M0 | |||
|---|---|---|---|
| Quadrant | BADHDUFLAG | Total packets | Discarded packets |
| A | 0 | 19843 | 3 |
| B | 0 | 14139 | 2 |
| C | 0 | 14324 | 2 |
| D | 0 | 11289 | 2 |
| Mode SS | |||
|---|---|---|---|
| Quadrant | BADHDUFLAG | Total packets | Discarded packets |
| A | 0 | 102 | 0 |
| B | 0 | 102 | 0 |
| C | 0 | 102 | 0 |
| D | 0 | 102 | 0 |
| Mode M9 | |||
|---|---|---|---|
| Quadrant | BADHDUFLAG | Total packets | Discarded packets |
| A | 0 | 41 | 0 |
| B | 0 | 41 | 0 |
| C | 0 | 41 | 0 |
| D | 0 | 42 | 0 |
| Quadrant | Total seconds | Saturated seconds | Saturation percentage |
|---|---|---|---|
| A | 5071 | 1004 | 19.798856% |
| B | 5071 | 55 | 1.084599% |
| C | 5071 | 273 | 5.383554% |
| D | 5071 | 46 | 0.907119% |
Noise dominated data is calculated using 1-second bins in cleaned event files. If a bin has >2000 counts, and if more than 50% of those come from <1% of pixels, then it is considered to be noise-dominated and hence unusable.
| Quadrant | # 1 sec bins | Bins with >0 counts | Bins with >2000 counts | High rate bins dominated by noise | Noise dominated (total time) | Noise dominated (detector-on time) | Marked lightcurve |
|---|---|---|---|---|---|---|---|
| A | 7226 | 5072 | 860 | 860 | 11.90% | 16.96% |  |
| B | 7226 | 5072 | 30 | 30 | 0.42% | 0.59% |  |
| C | 7226 | 5072 | 230 | 230 | 3.18% | 4.53% | 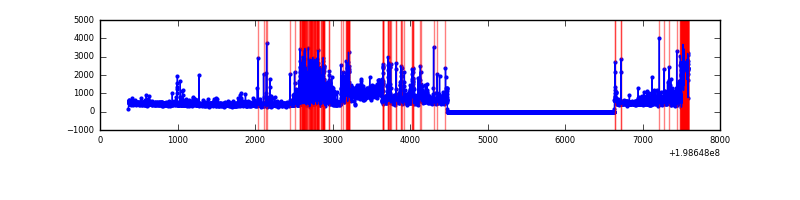 |
| D | 7226 | 5072 | 32 | 32 | 0.44% | 0.63% |  |
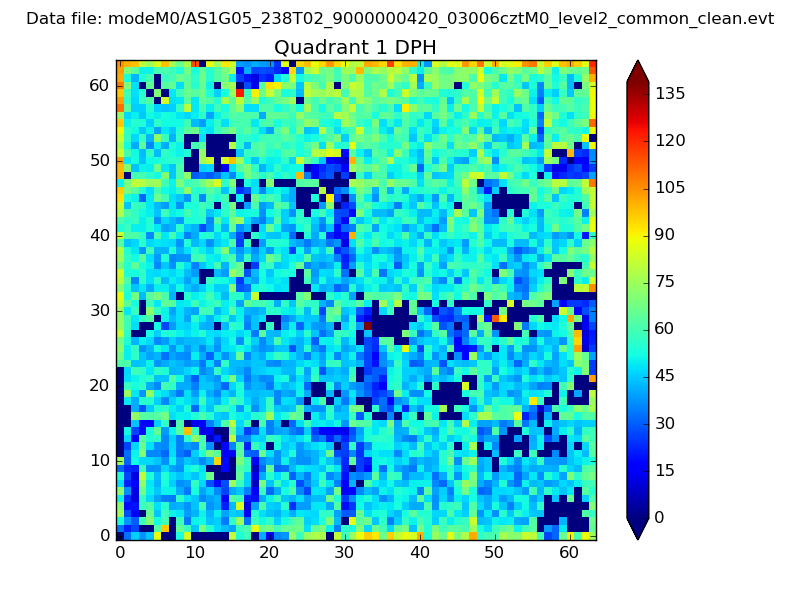
Top three noisy pixels from each quadrant. If the there are fewer than three noisy pixels in the level2.evt file, extra rows are filled as -1
| Pixel properties | Quadrant properties | ||||||
|---|---|---|---|---|---|---|---|
| Quadrant | DetID | PixID | Counts | Sigma | Mean | Median | Sigma |
| A | 13 | 9 | 3127390 | 29628.47 | 517 | 507 | 105.5 |
| A | 0 | 50 | 140694 | 1328.33 | 517 | 507 | 105.5 |
| A | 14 | 249 | 88812 | 836.73 | 517 | 507 | 105.5 |
| B | 8 | 3 | 1305354 | 11907.23 | 567 | 555 | 109.6 |
| B | 2 | 249 | 33524 | 300.87 | 567 | 555 | 109.6 |
| B | 0 | 219 | 14450 | 126.8 | 567 | 555 | 109.6 |
| C | 0 | 219 | 1289549 | 10355.6 | 530 | 531 | 124.5 |
| C | 1 | 192 | 129414 | 1035.41 | 530 | 531 | 124.5 |
| C | 6 | 80 | 77739 | 620.27 | 530 | 531 | 124.5 |
| D | 12 | 112 | 169827 | 1279.42 | 538 | 523 | 132.3 |
| D | 7 | 80 | 90021 | 676.33 | 538 | 523 | 132.3 |
| D | 13 | 114 | 88850 | 667.48 | 538 | 523 | 132.3 |
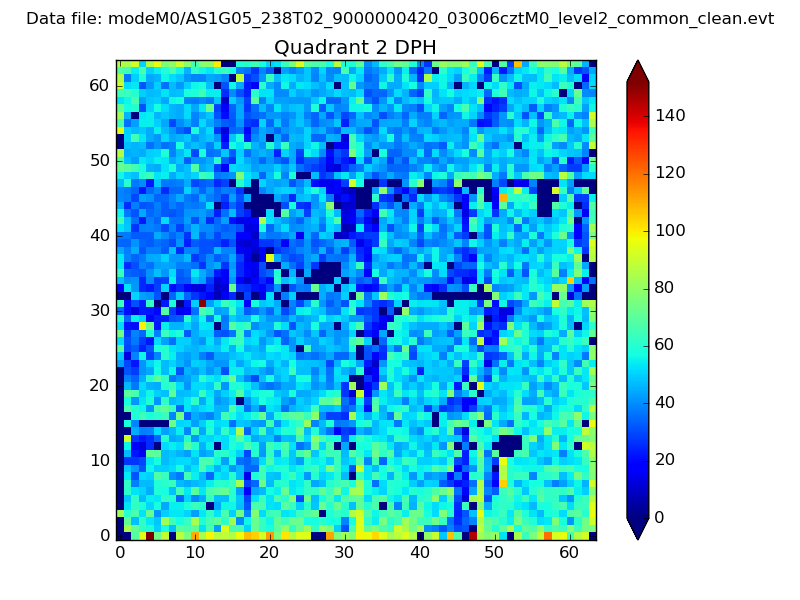
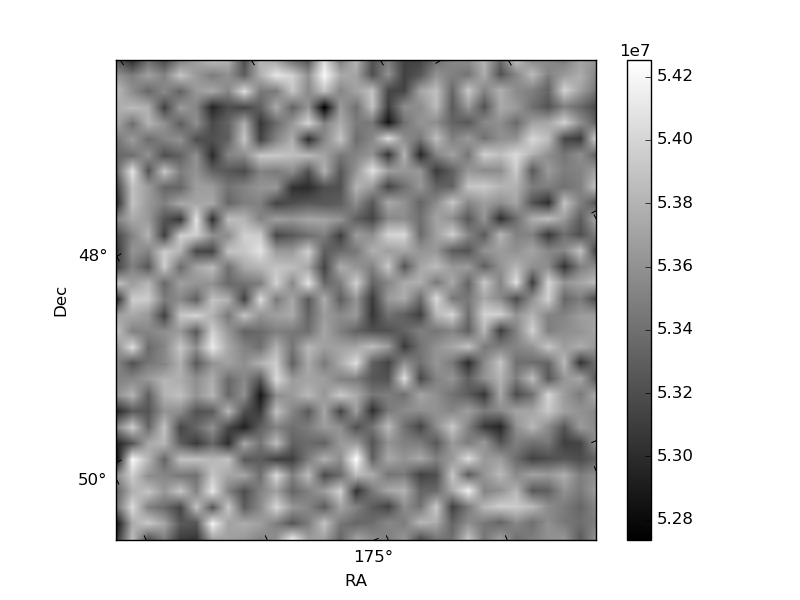
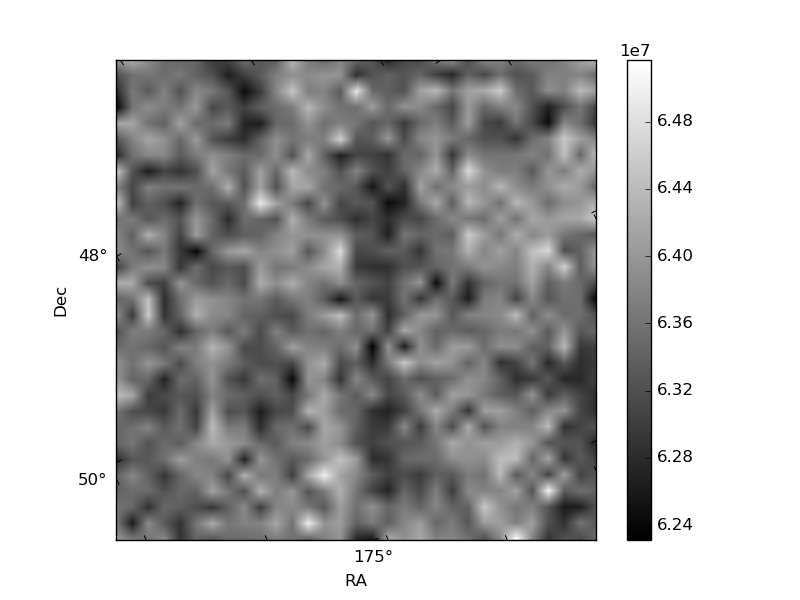
Histogram calculated using DETX and DETY for each event in the final _common_clean file
| Quadrant A | 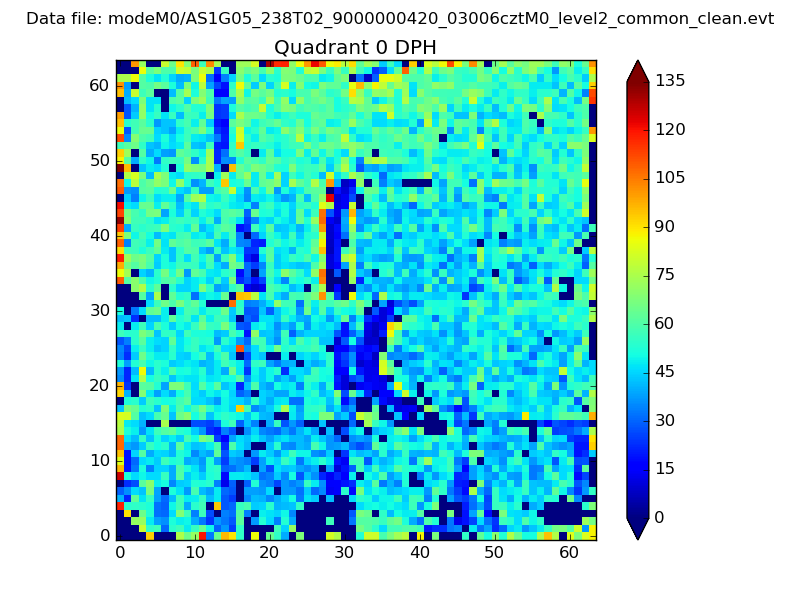 |
 |
Quadrant B |
|---|---|---|---|
| Quadrant D | 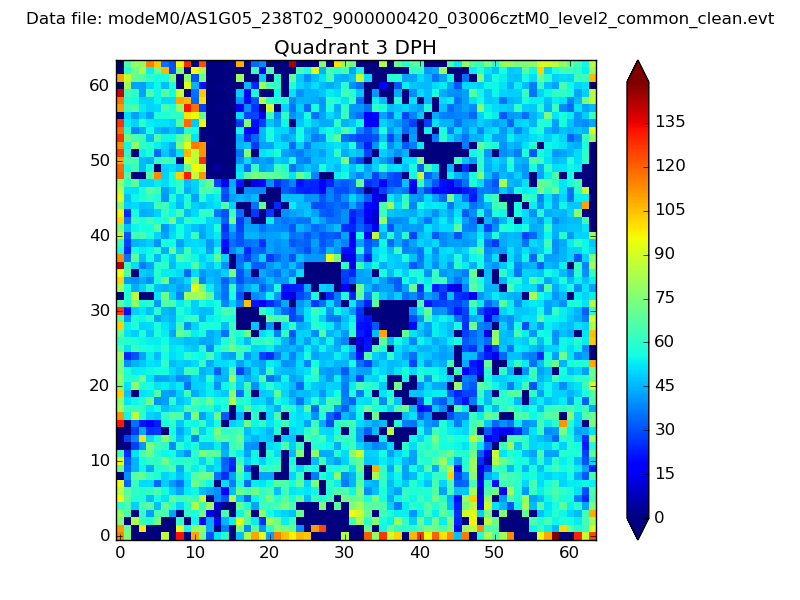 |
 |
Quadrant C |
| Plot type | Count rate plots | Images |
|---|---|---|
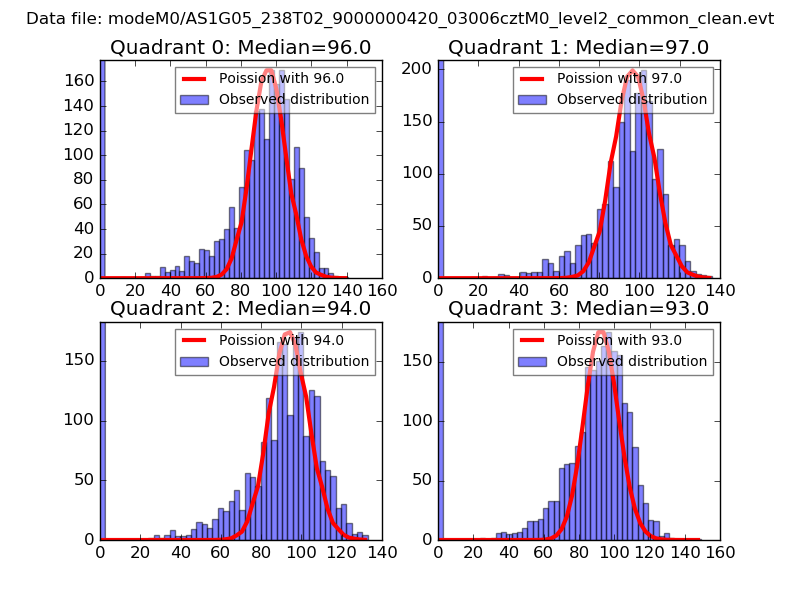
| Comparison with Poisson distribution Blue bars denote a histogram of data divided into 1 sec bins. Red curve is a Poisson curve with rate = median count rate of data. |
 |
 |
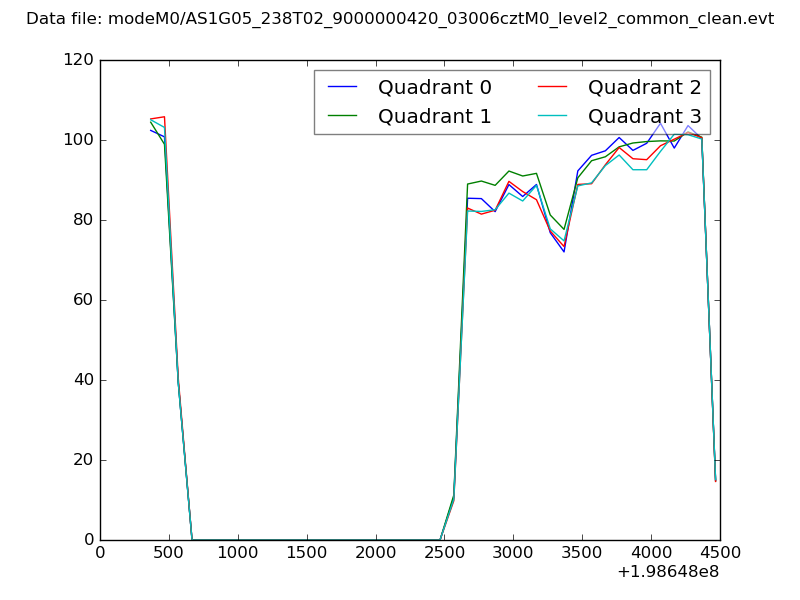
| Quadrant-wise count rates Data is divided into 100 sec bins |
 |
|
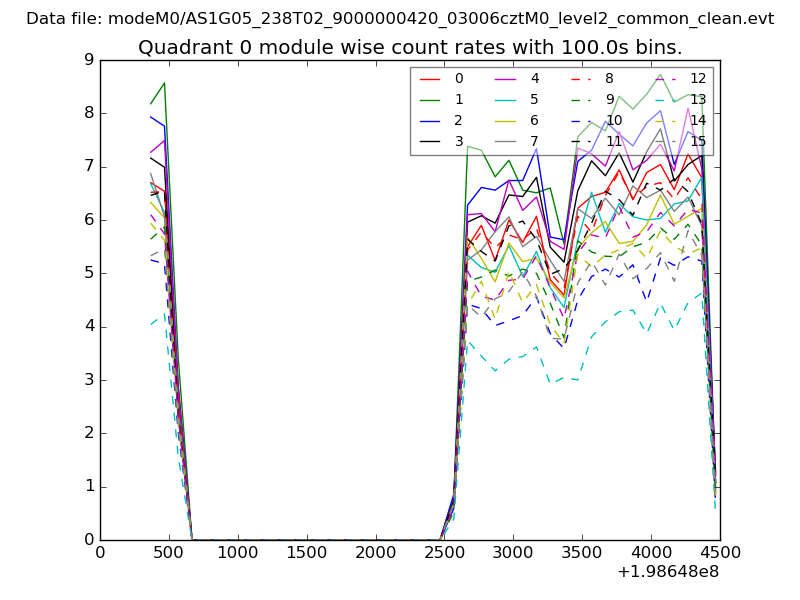
| Module-wise count rates for Quadrant A Data is divided into 100 sec bins |
 |
 |
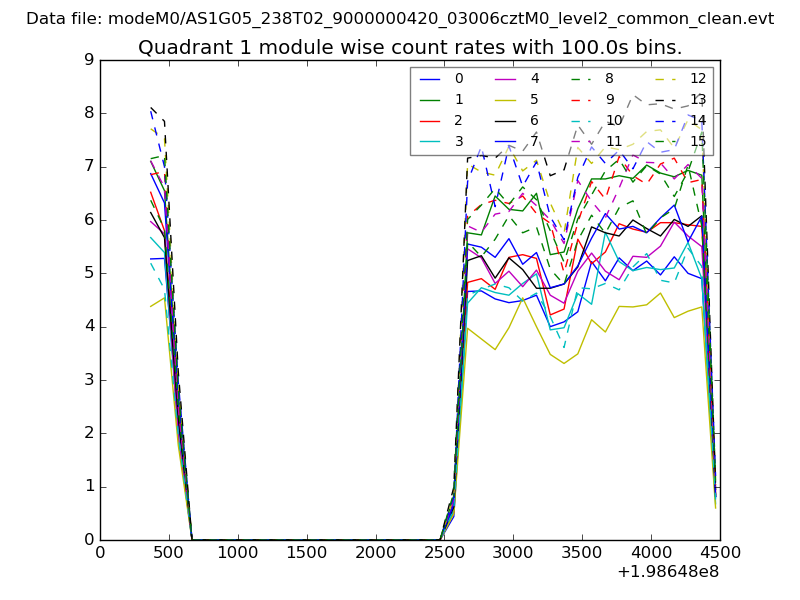
| Module-wise count rates for Quadrant B Data is divided into 100 sec bins |
 |
 |
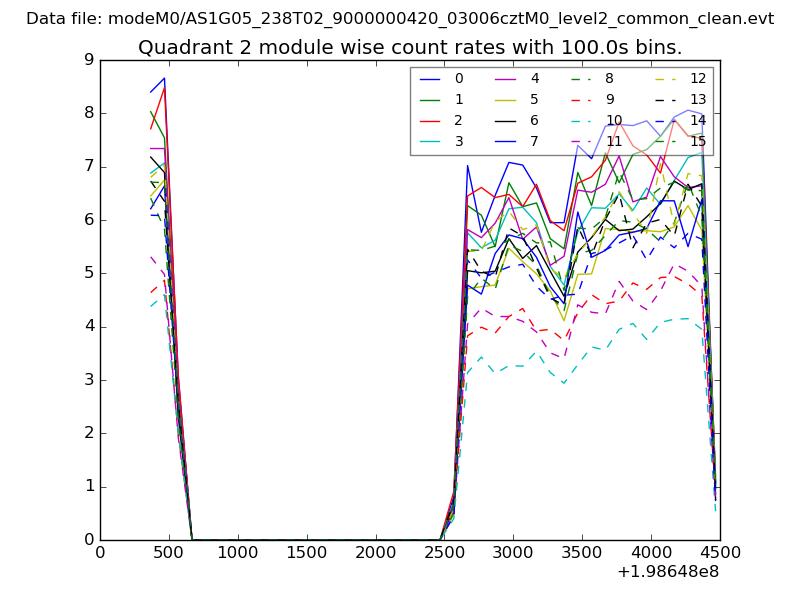
| Module-wise count rates for Quadrant C Data is divided into 100 sec bins |
 |
 |
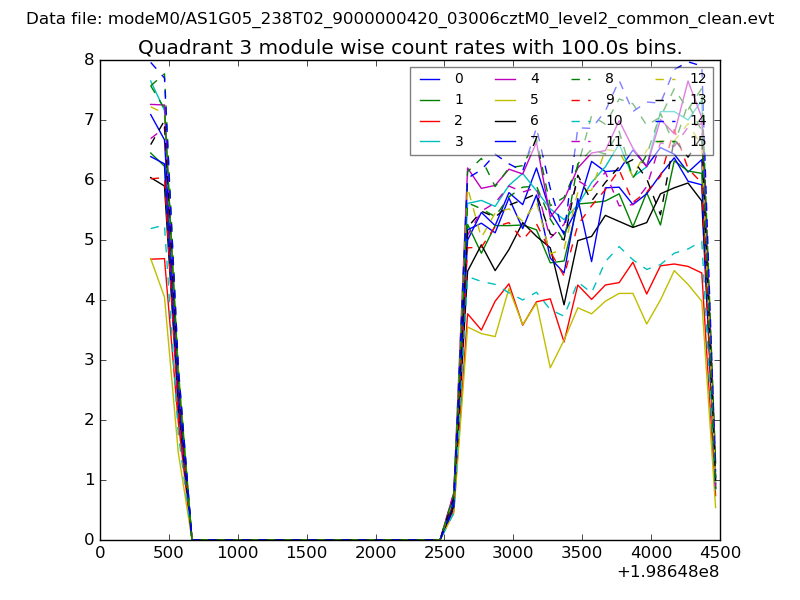
| Module-wise count rates for Quadrant D Data is divided into 100 sec bins |
 |
 |
| Parameter | Plot |
|---|---|
| CZT HV Monitor | 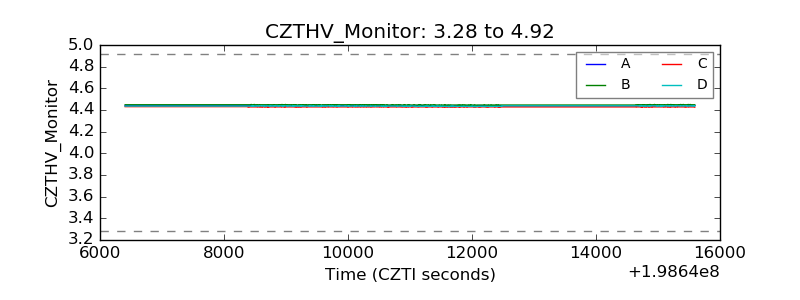 |
| D_VDD | 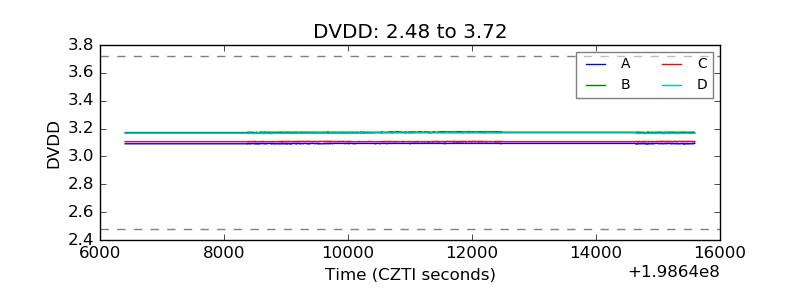 |
| Temperature 1 | 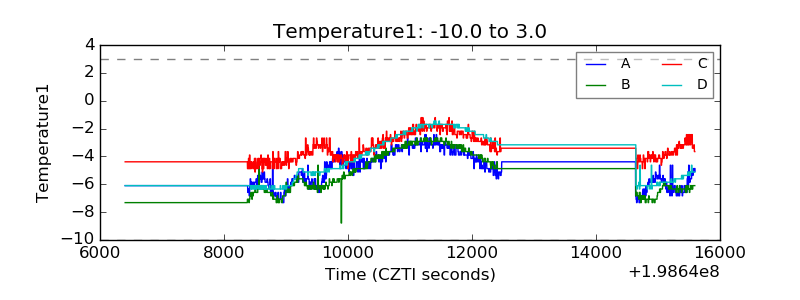 |
| Veto HV Monitor | 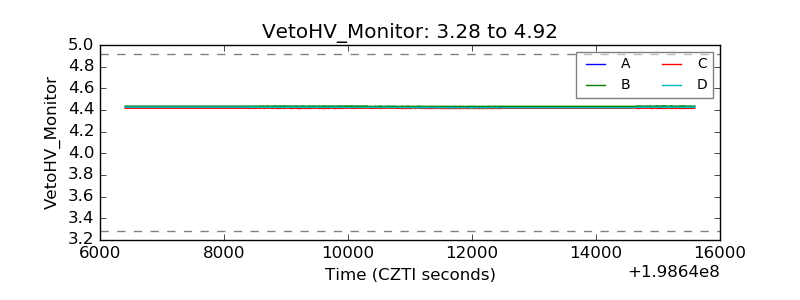 |
| Veto LLD | 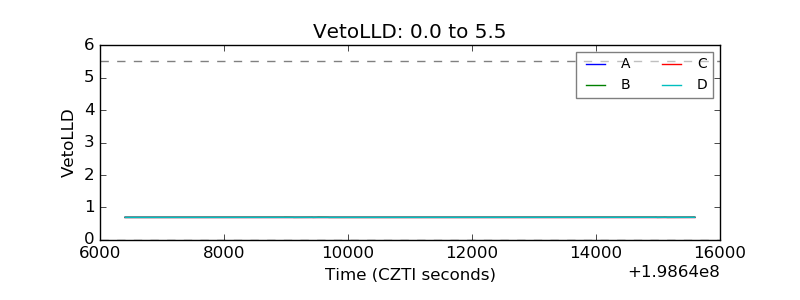 |
| Alpha Counter | 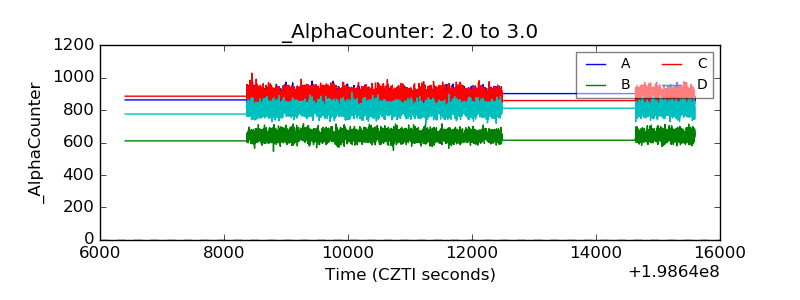 |
| _CPM_Rate | 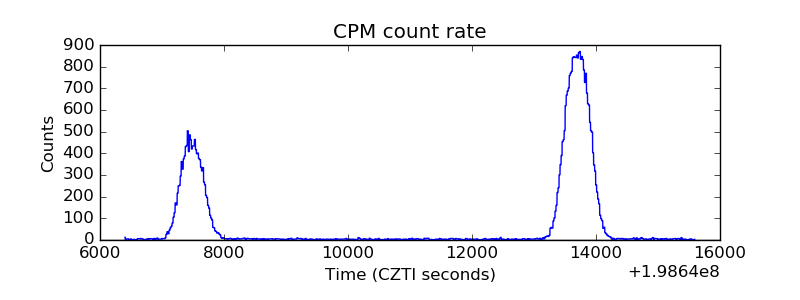 |
| CZT Counter | 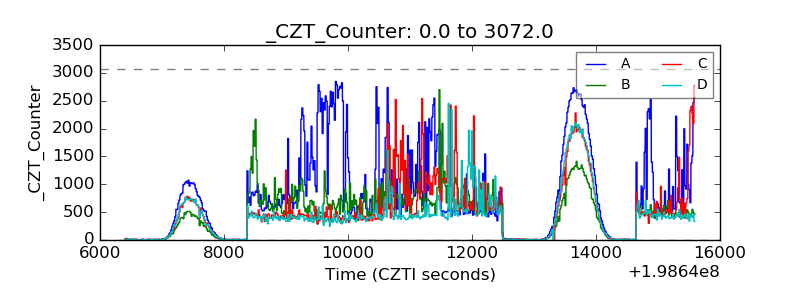 |
| +2.5 Volts monitor |  |
| +5 Volts monitor |  |
| Veto Counter | 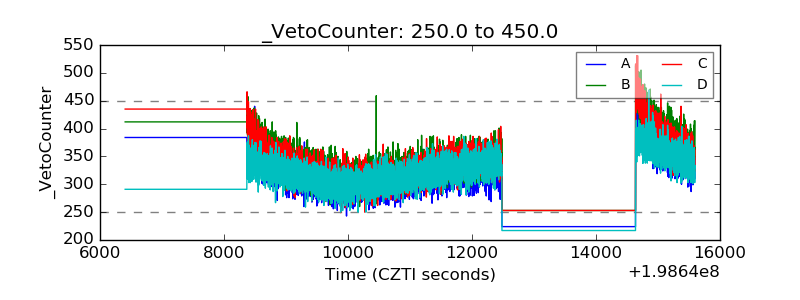 |