| Param | Original file | Final file |
|---|---|---|
| Filename | modeM0/AS1G05_238T02_9000000420_03008cztM0_level2.evt | modeM0/AS1G05_238T02_9000000420_03008cztM0_level2_quad_clean.evt |
| Size (bytes) | 471,219,840 | 46,212,480 |
| Size | 449.4 MB | 44.1 MB |
| Events in quadrant A | 5,050,546 | 252,953 |
| Events in quadrant B | 2,993,474 | 264,022 |
| Events in quadrant C | 3,038,035 | 258,856 |
| Events in quadrant D | 2,829,511 | 251,816 |
| Mode M0 | |||
|---|---|---|---|
| Quadrant | BADHDUFLAG | Total packets | Discarded packets |
| A | 0 | 18537 | 3 |
| B | 0 | 12174 | 2 |
| C | 0 | 12651 | 2 |
| D | 0 | 12107 | 2 |
| Mode SS | |||
|---|---|---|---|
| Quadrant | BADHDUFLAG | Total packets | Discarded packets |
| A | 0 | 108 | 0 |
| B | 0 | 108 | 0 |
| C | 0 | 108 | 0 |
| D | 0 | 108 | 0 |
| Mode M9 | |||
|---|---|---|---|
| Quadrant | BADHDUFLAG | Total packets | Discarded packets |
| A | 0 | 44 | 0 |
| B | 0 | 44 | 0 |
| C | 0 | 44 | 0 |
| D | 0 | 44 | 0 |
| Quadrant | Total seconds | Saturated seconds | Saturation percentage |
|---|---|---|---|
| A | 5304 | 591 | 11.142534% |
| B | 5304 | 20 | 0.377074% |
| C | 5304 | 188 | 3.544495% |
| D | 5304 | 77 | 1.451735% |
Noise dominated data is calculated using 1-second bins in cleaned event files. If a bin has >2000 counts, and if more than 50% of those come from <1% of pixels, then it is considered to be noise-dominated and hence unusable.
| Quadrant | # 1 sec bins | Bins with >0 counts | Bins with >2000 counts | High rate bins dominated by noise | Noise dominated (total time) | Noise dominated (detector-on time) | Marked lightcurve |
|---|---|---|---|---|---|---|---|
| A | 9615 | 5306 | 484 | 484 | 5.03% | 9.12% | 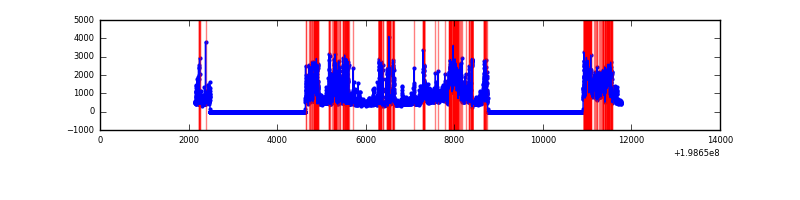 |
| B | 9615 | 5306 | 8 | 8 | 0.08% | 0.15% | 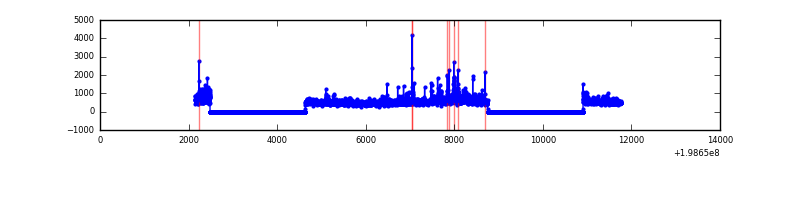 |
| C | 9615 | 5306 | 172 | 172 | 1.79% | 3.24% | 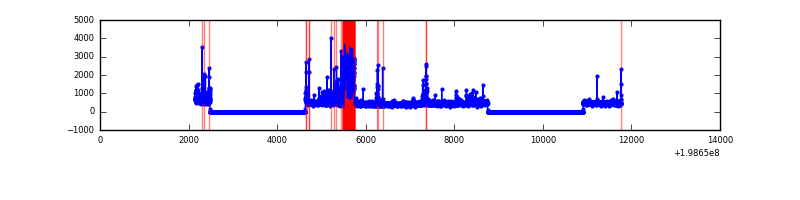 |
| D | 9615 | 5306 | 68 | 68 | 0.71% | 1.28% | 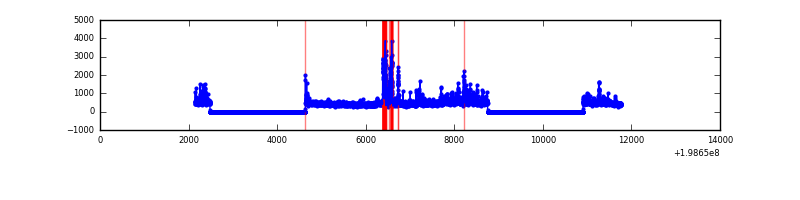 |
Top three noisy pixels from each quadrant. If the there are fewer than three noisy pixels in the level2.evt file, extra rows are filled as -1
| Pixel properties | Quadrant properties | ||||||
|---|---|---|---|---|---|---|---|
| Quadrant | DetID | PixID | Counts | Sigma | Mean | Median | Sigma |
| A | 13 | 9 | 2196920 | 18490.67 | 583 | 571 | 118.8 |
| A | 14 | 249 | 322293 | 2708.52 | 583 | 571 | 118.8 |
| A | 14 | 63 | 100423 | 840.64 | 583 | 571 | 118.8 |
| B | 8 | 3 | 466181 | 3949.43 | 614 | 600 | 117.9 |
| B | 0 | 219 | 51344 | 430.45 | 614 | 600 | 117.9 |
| B | 3 | 27 | 40613 | 339.42 | 614 | 600 | 117.9 |
| C | 0 | 219 | 520754 | 3864.9 | 576 | 579 | 134.6 |
| C | 1 | 192 | 173364 | 1283.79 | 576 | 579 | 134.6 |
| C | 6 | 80 | 55179 | 405.68 | 576 | 579 | 134.6 |
| D | 9 | 35 | 206558 | 1446.81 | 582 | 566 | 142.4 |
| D | 12 | 1 | 97521 | 680.98 | 582 | 566 | 142.4 |
| D | 13 | 114 | 96928 | 676.81 | 582 | 566 | 142.4 |
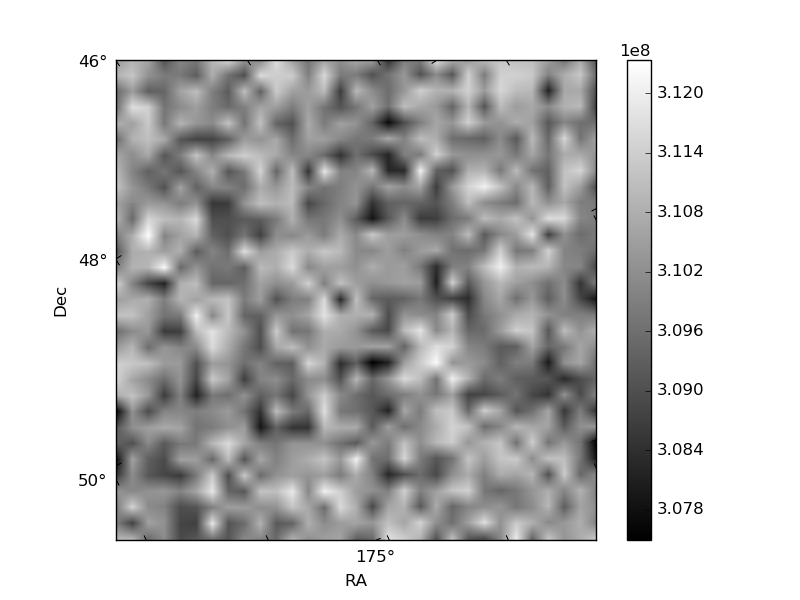
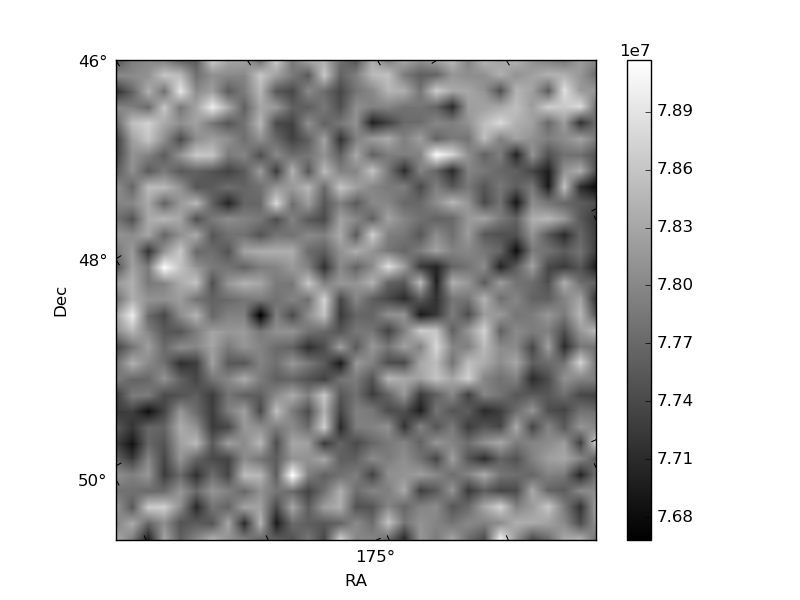
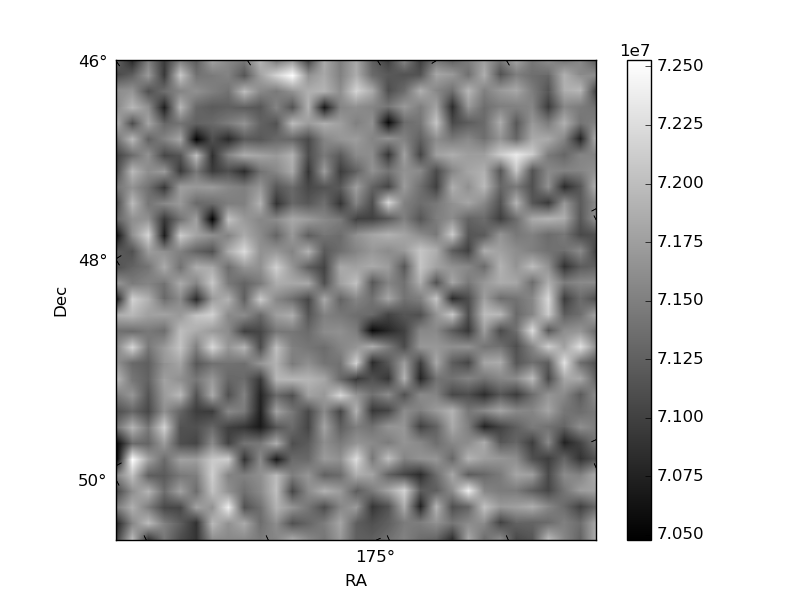
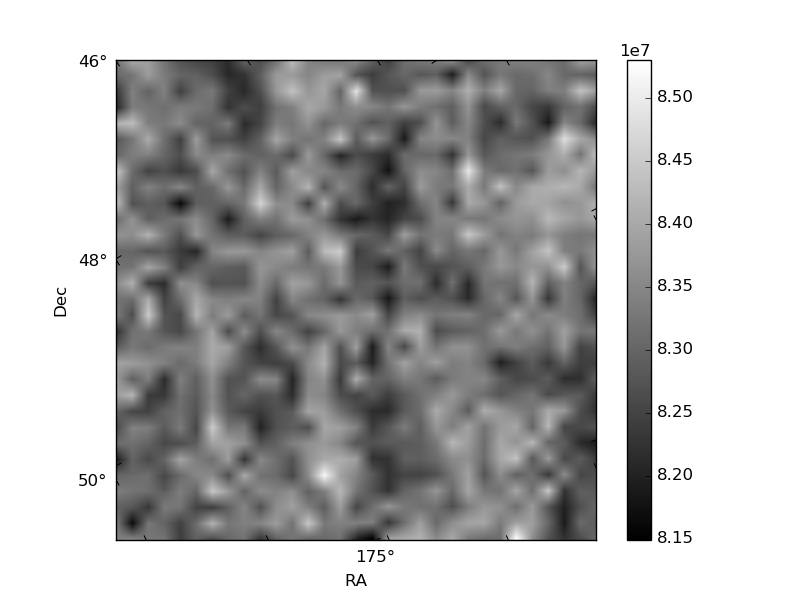
Histogram calculated using DETX and DETY for each event in the final _common_clean file
| Quadrant A | 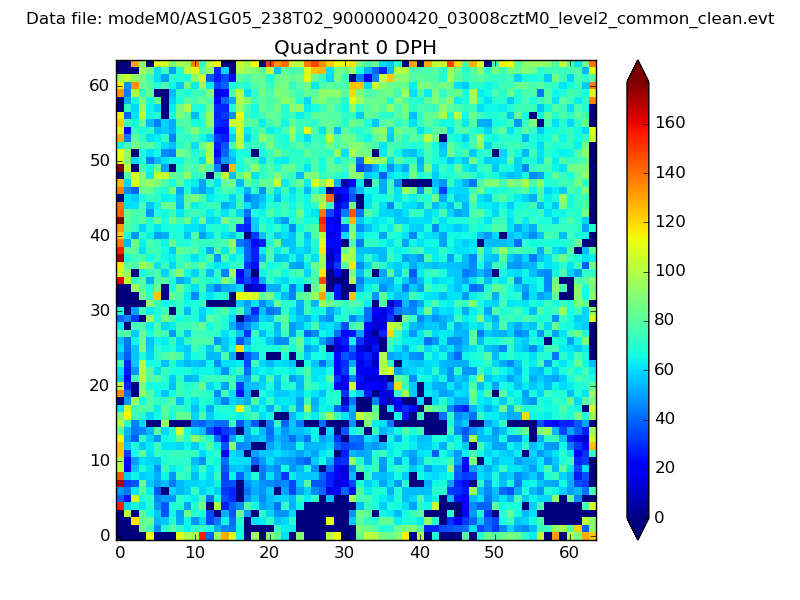 |
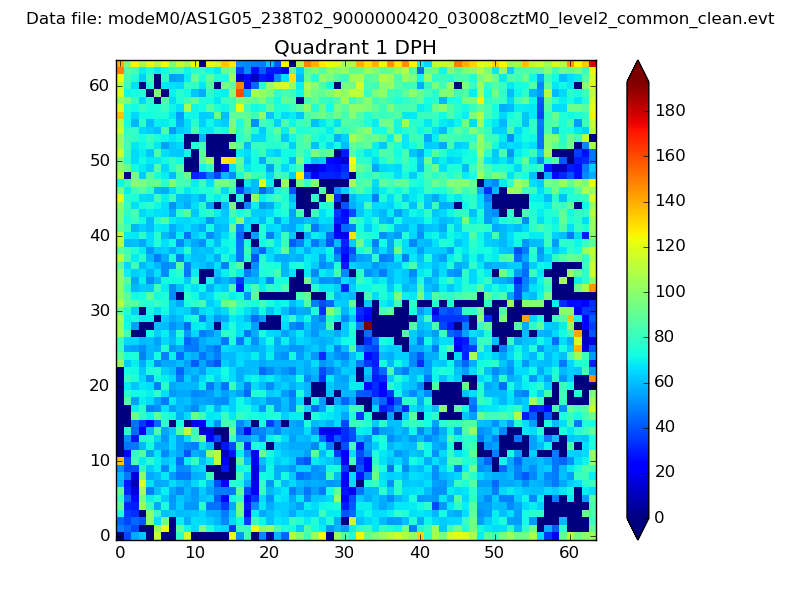 |
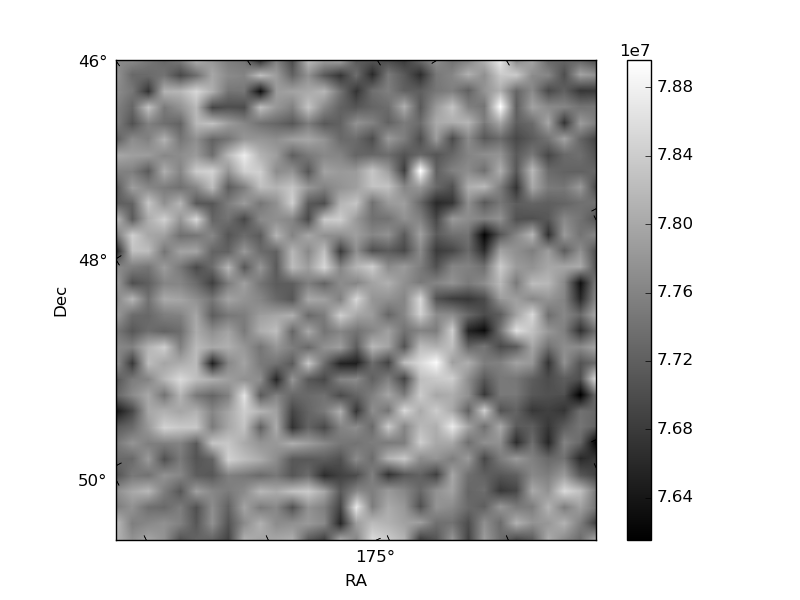
Quadrant B |
|---|---|---|---|
| Quadrant D | 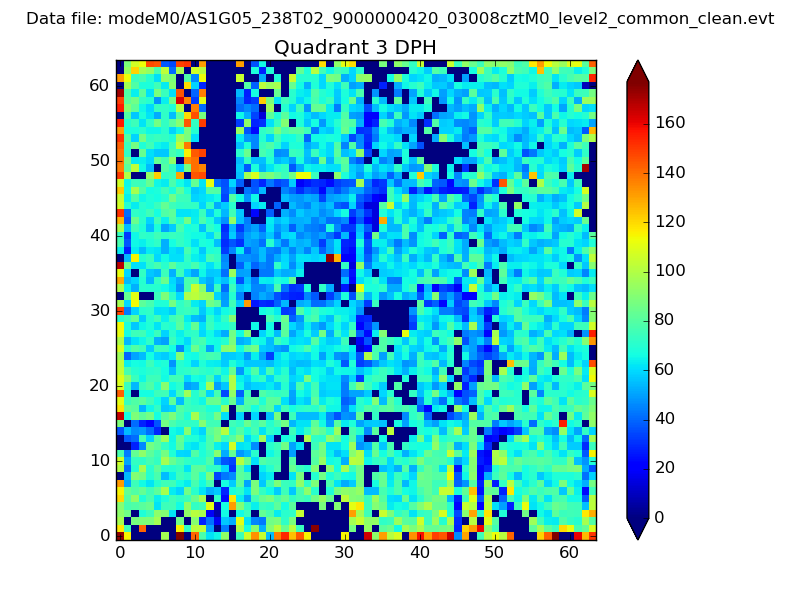 |
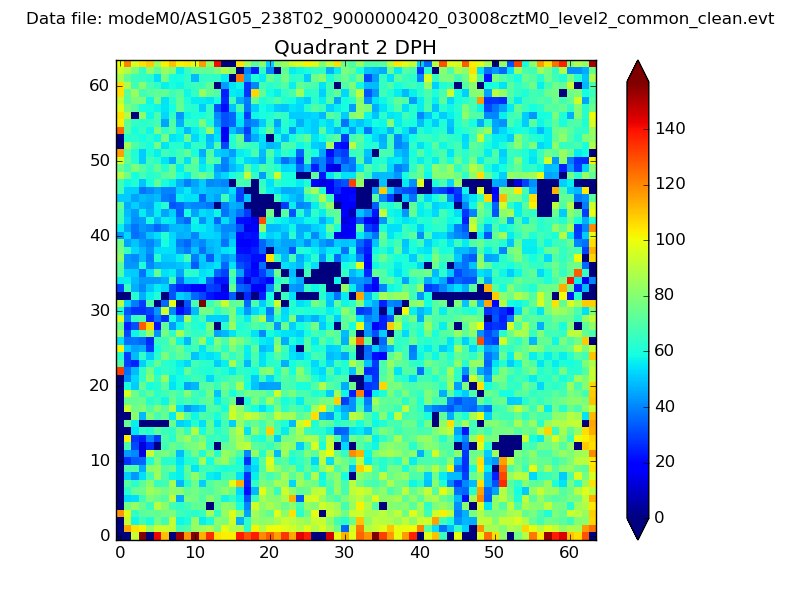 |
Quadrant C |
| Plot type | Count rate plots | Images |
|---|---|---|
| Comparison with Poisson distribution Blue bars denote a histogram of data divided into 1 sec bins. Red curve is a Poisson curve with rate = median count rate of data. |
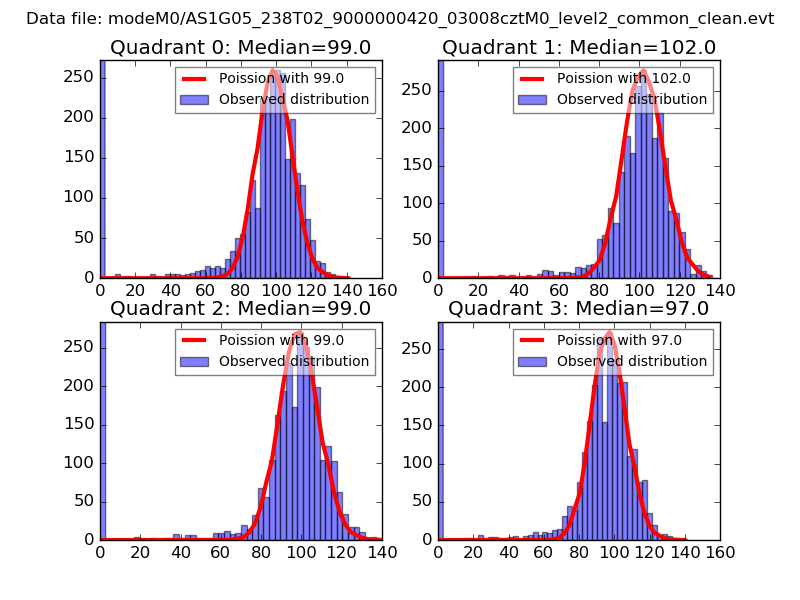 |
 |
| Quadrant-wise count rates Data is divided into 100 sec bins |
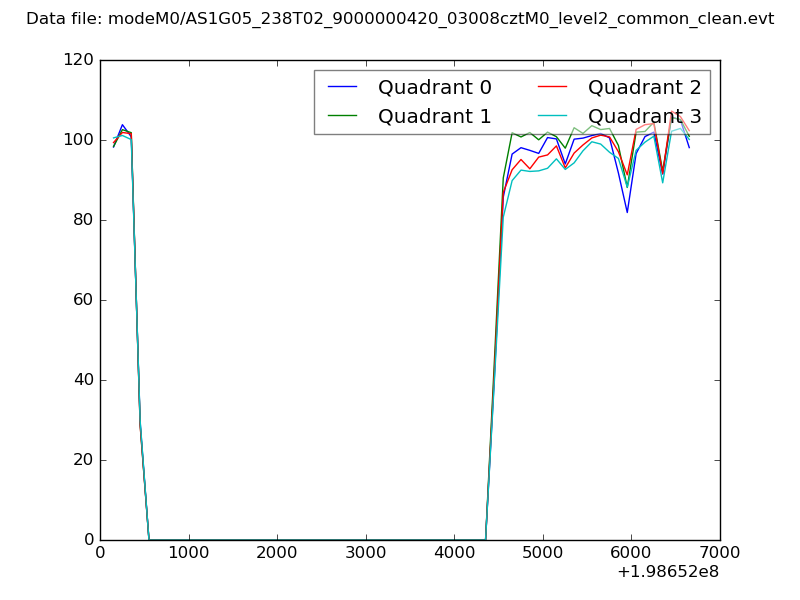 |
|
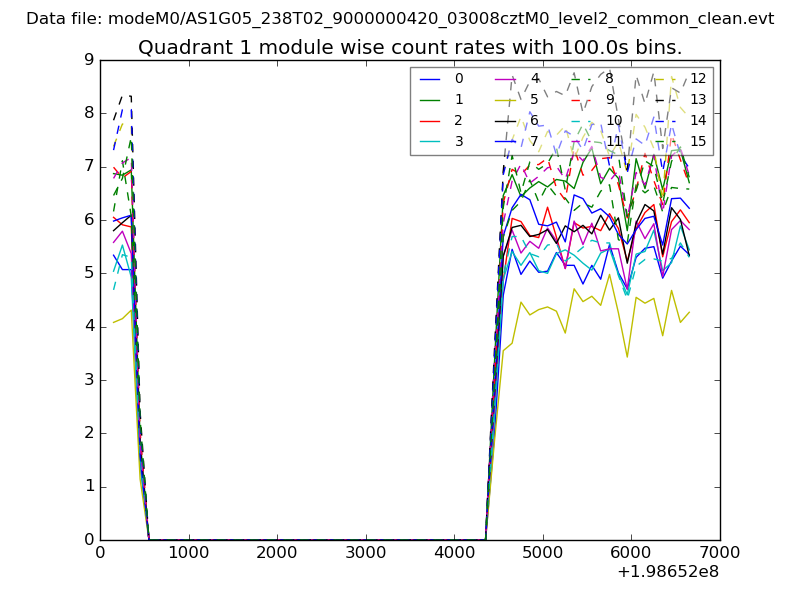
| Module-wise count rates for Quadrant A Data is divided into 100 sec bins |
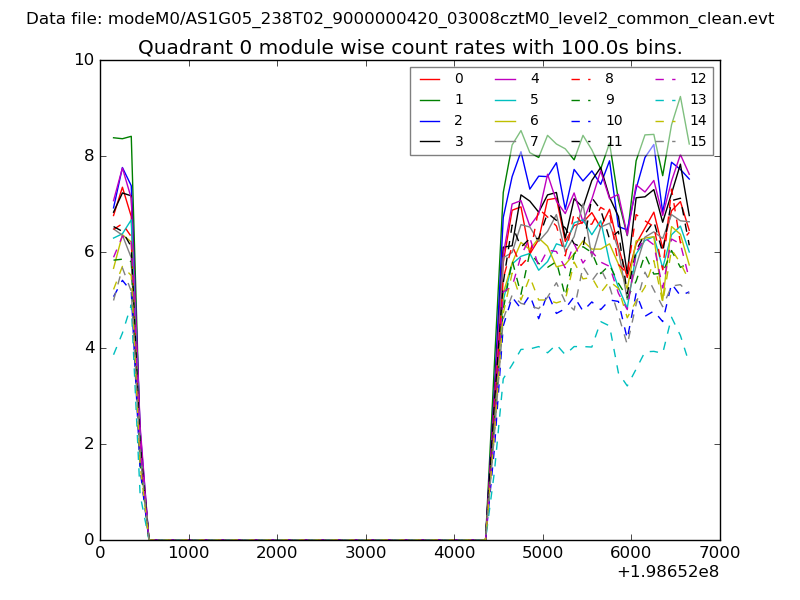 |
 |
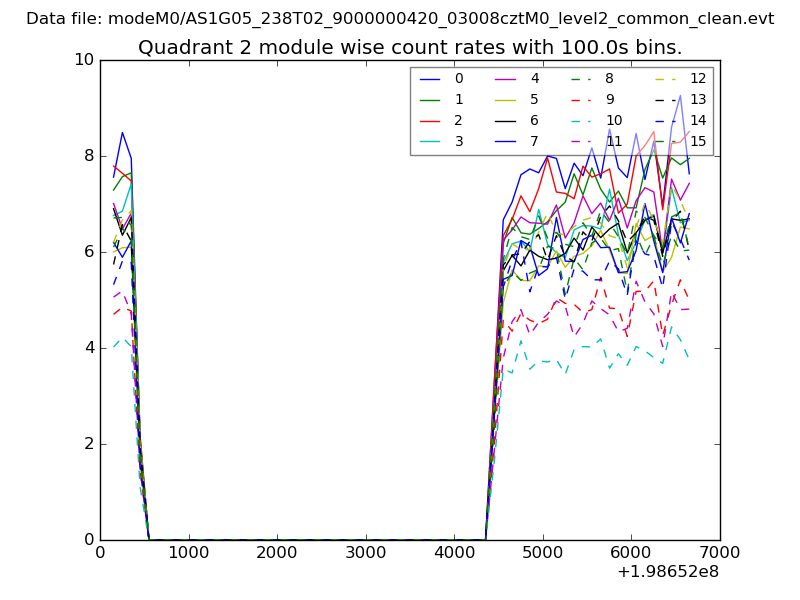
| Module-wise count rates for Quadrant B Data is divided into 100 sec bins |
 |
 |
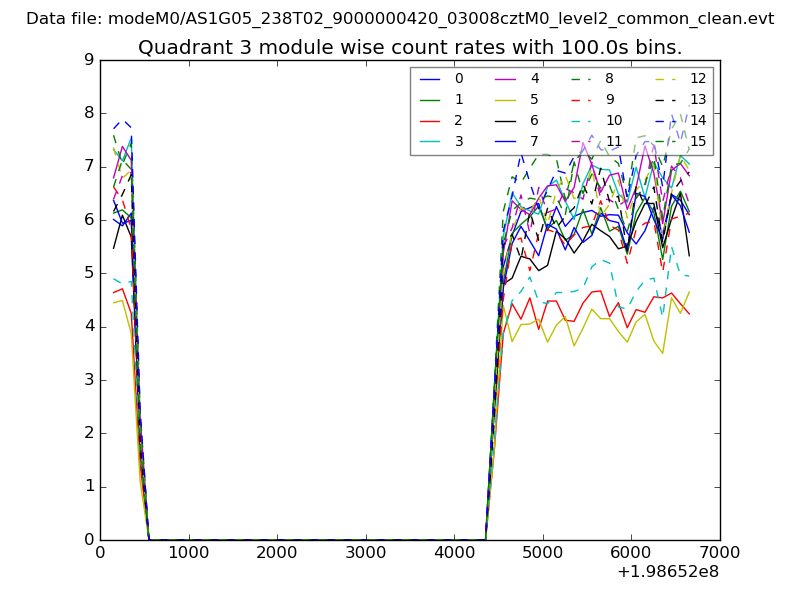
| Module-wise count rates for Quadrant C Data is divided into 100 sec bins |
 |
 |
| Module-wise count rates for Quadrant D Data is divided into 100 sec bins |
 |
 |
| Parameter | Plot |
|---|---|
| CZT HV Monitor | 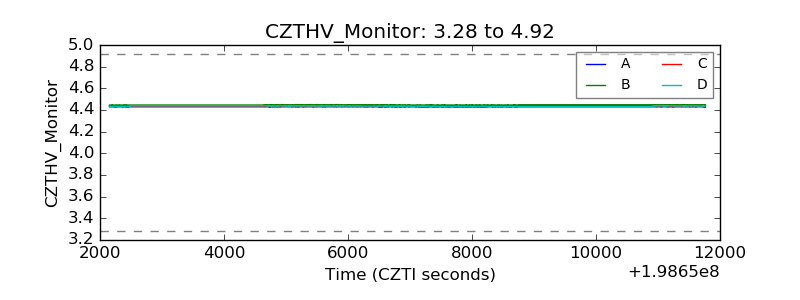 |
| D_VDD | 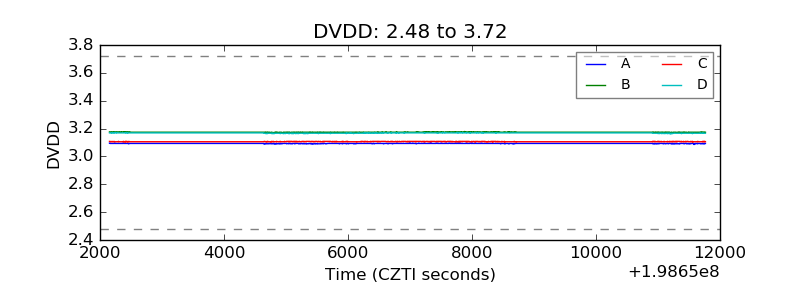 |
| Temperature 1 | 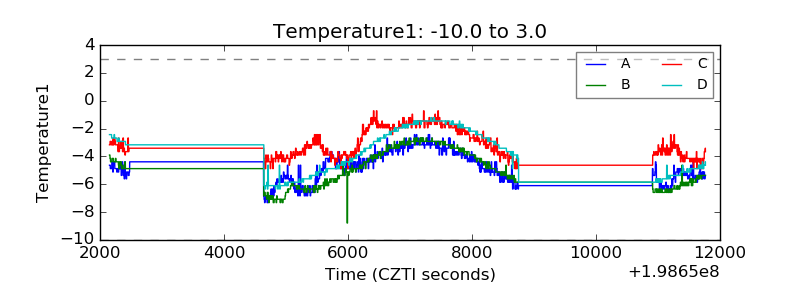 |
| Veto HV Monitor | 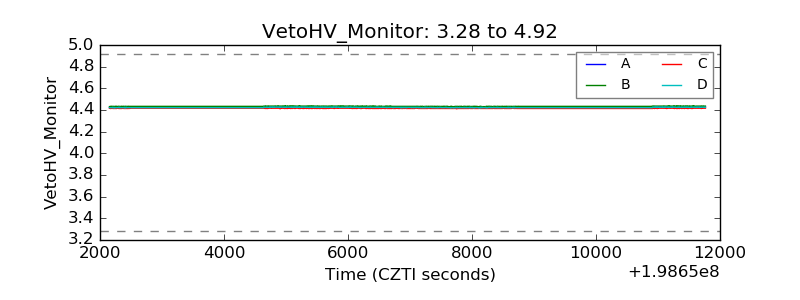 |
| Veto LLD | 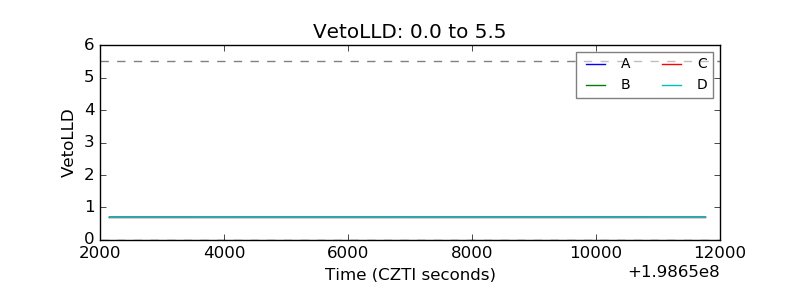 |
| Alpha Counter | 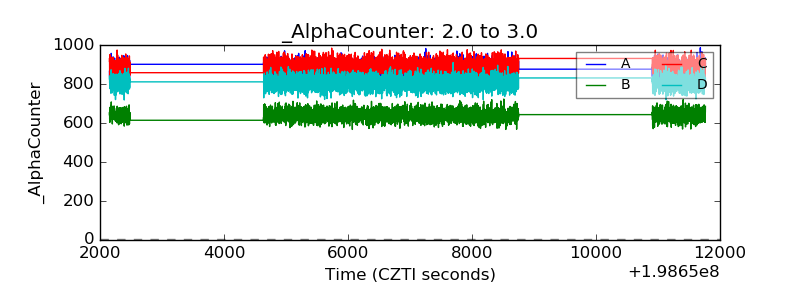 |
| _CPM_Rate | 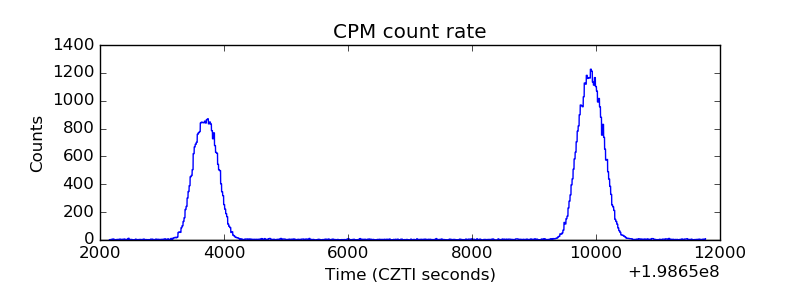 |
| CZT Counter | 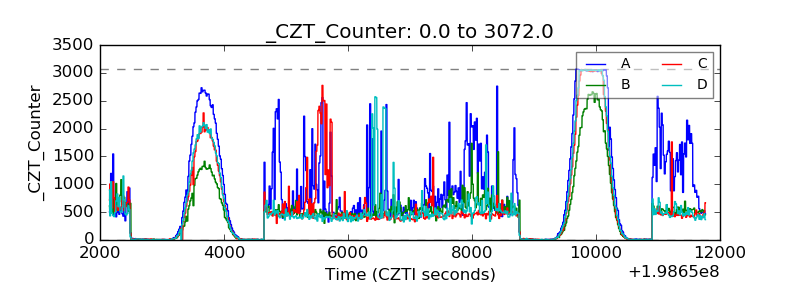 |
| +2.5 Volts monitor | 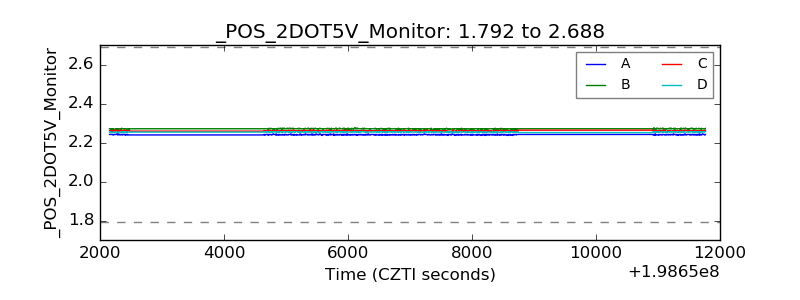 |
| +5 Volts monitor |  |
| Veto Counter | 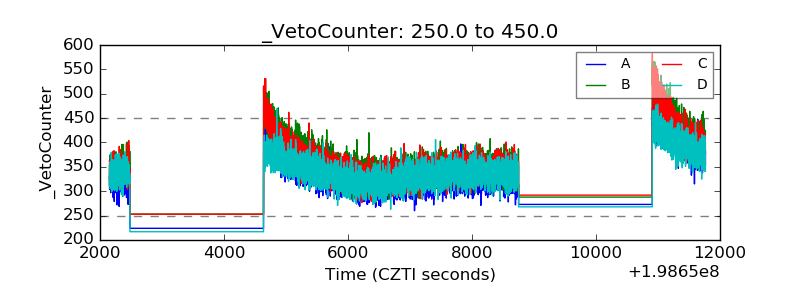 |