| Param | Original file | Final file |
|---|---|---|
| Filename | modeM0/AS1G05_238T02_9000000420_03010cztM0_level2.evt | modeM0/AS1G05_238T02_9000000420_03010cztM0_level2_quad_clean.evt |
| Size (bytes) | 637,741,440 | 62,210,880 |
| Size | 608.2 MB | 59.3 MB |
| Events in quadrant A | 2,935,116 | 404,489 |
| Events in quadrant B | 2,806,242 | 407,158 |
| Events in quadrant C | 10,344,592 | 316,785 |
| Events in quadrant D | 2,870,342 | 383,885 |
| Mode M0 | |||
|---|---|---|---|
| Quadrant | BADHDUFLAG | Total packets | Discarded packets |
| A | 0 | 11972 | 3 |
| B | 0 | 11514 | 2 |
| C | 0 | 34320 | 2 |
| D | 0 | 12091 | 2 |
| Mode SS | |||
|---|---|---|---|
| Quadrant | BADHDUFLAG | Total packets | Discarded packets |
| A | 0 | 108 | 0 |
| B | 0 | 108 | 0 |
| C | 0 | 108 | 0 |
| D | 0 | 108 | 0 |
| Mode M9 | |||
|---|---|---|---|
| Quadrant | BADHDUFLAG | Total packets | Discarded packets |
| A | 0 | 31 | 0 |
| B | 0 | 31 | 0 |
| C | 0 | 31 | 0 |
| D | 0 | 32 | 0 |
| Quadrant | Total seconds | Saturated seconds | Saturation percentage |
|---|---|---|---|
| A | 5287 | 70 | 1.324002% |
| B | 5287 | 28 | 0.529601% |
| C | 5287 | 2800 | 52.960091% |
| D | 5287 | 39 | 0.737658% |
Noise dominated data is calculated using 1-second bins in cleaned event files. If a bin has >2000 counts, and if more than 50% of those come from <1% of pixels, then it is considered to be noise-dominated and hence unusable.
| Quadrant | # 1 sec bins | Bins with >0 counts | Bins with >2000 counts | High rate bins dominated by noise | Noise dominated (total time) | Noise dominated (detector-on time) | Marked lightcurve |
|---|---|---|---|---|---|---|---|
| A | 7415 | 5288 | 58 | 58 | 0.78% | 1.10% | 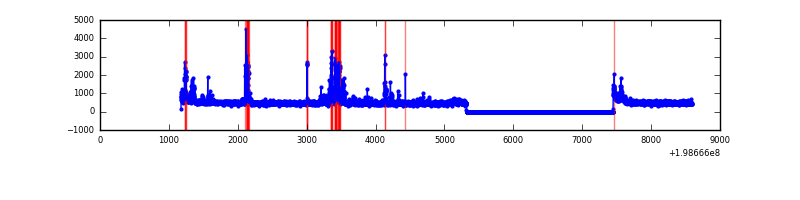 |
| B | 7415 | 5288 | 17 | 17 | 0.23% | 0.32% | 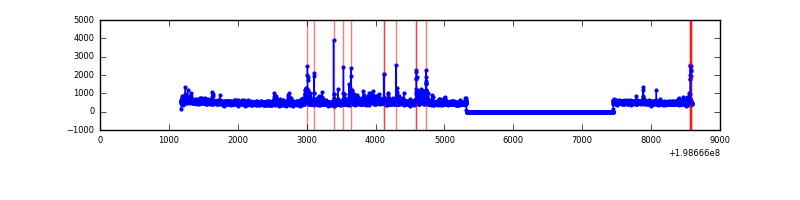 |
| C | 7415 | 5287 | 2963 | 2963 | 39.96% | 56.04% |  |
| D | 7415 | 5288 | 39 | 39 | 0.53% | 0.74% | 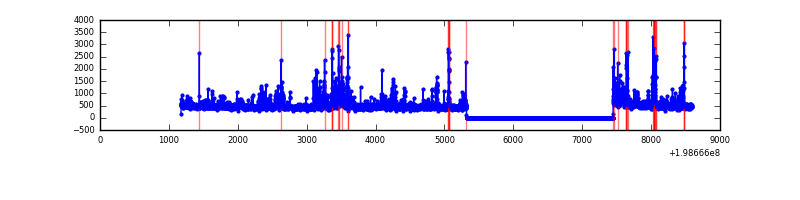 |
Top three noisy pixels from each quadrant. If the there are fewer than three noisy pixels in the level2.evt file, extra rows are filled as -1
| Pixel properties | Quadrant properties | ||||||
|---|---|---|---|---|---|---|---|
| Quadrant | DetID | PixID | Counts | Sigma | Mean | Median | Sigma |
| A | 14 | 249 | 319238 | 2539.94 | 627 | 614 | 125.4 |
| A | 0 | 50 | 127400 | 1010.69 | 627 | 614 | 125.4 |
| A | 13 | 228 | 17196 | 132.18 | 627 | 614 | 125.4 |
| B | 10 | 244 | 207158 | 1713.75 | 634 | 621 | 120.5 |
| B | 0 | 219 | 81008 | 667.01 | 634 | 621 | 120.5 |
| B | 3 | 27 | 25645 | 207.64 | 634 | 621 | 120.5 |
| C | 0 | 219 | 7953078 | 64495.42 | 534 | 536 | 123.3 |
| C | 1 | 192 | 250504 | 2027.25 | 534 | 536 | 123.3 |
| C | 6 | 80 | 28216 | 224.49 | 534 | 536 | 123.3 |
| D | 7 | 80 | 295491 | 1916.23 | 603 | 590 | 153.9 |
| D | 12 | 112 | 103222 | 666.89 | 603 | 590 | 153.9 |
| D | 2 | 209 | 91841 | 592.94 | 603 | 590 | 153.9 |
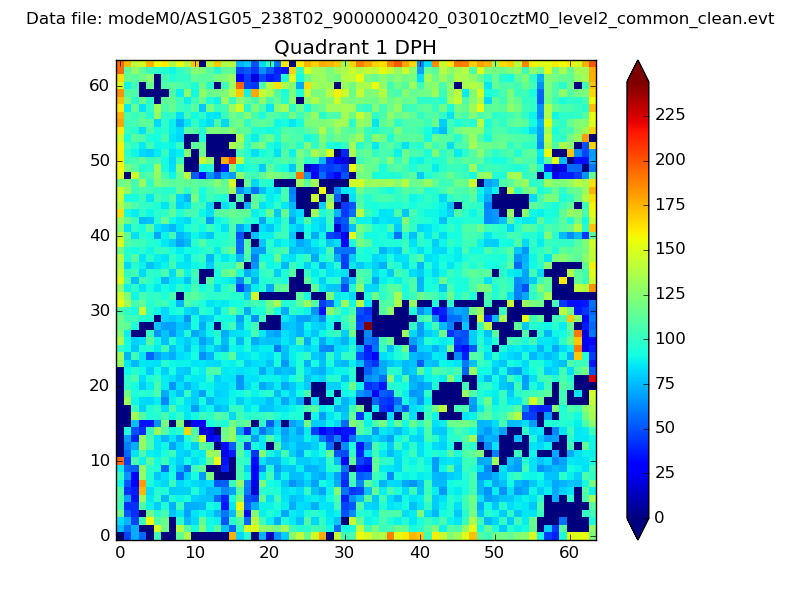
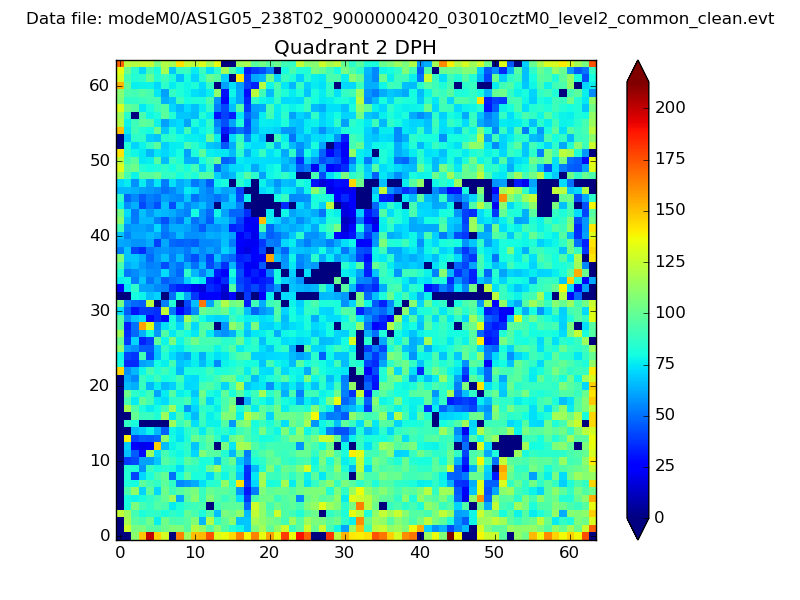
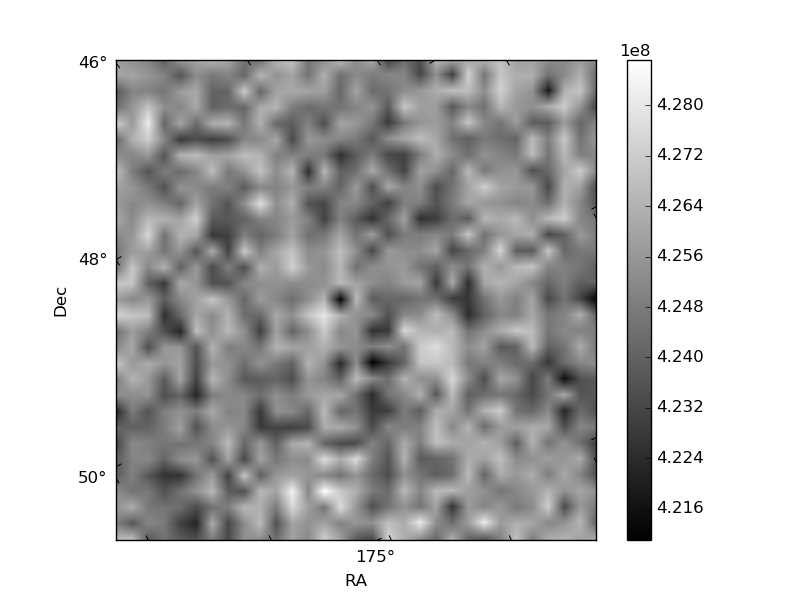
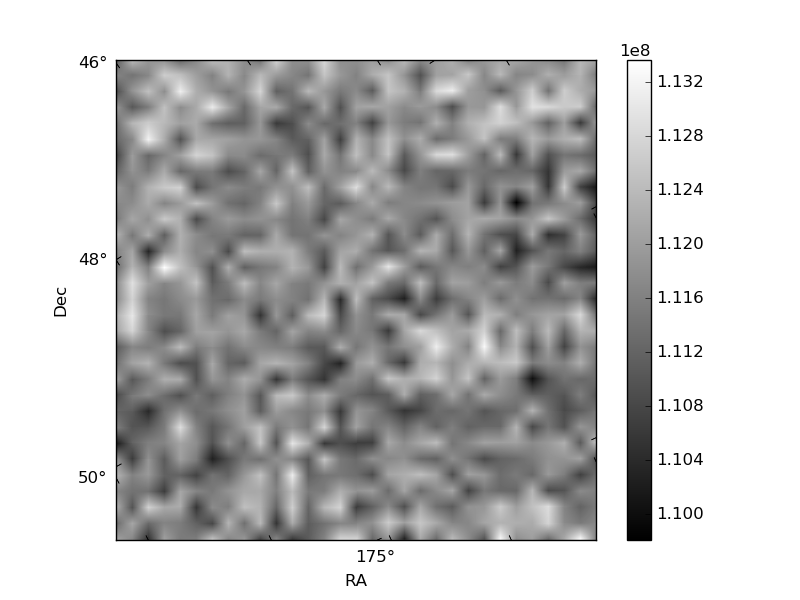
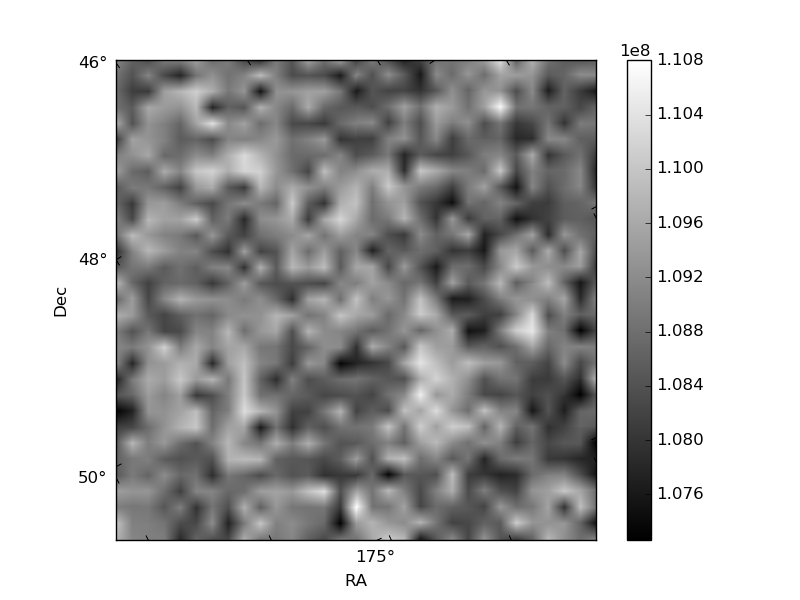
Histogram calculated using DETX and DETY for each event in the final _common_clean file
| Quadrant A | 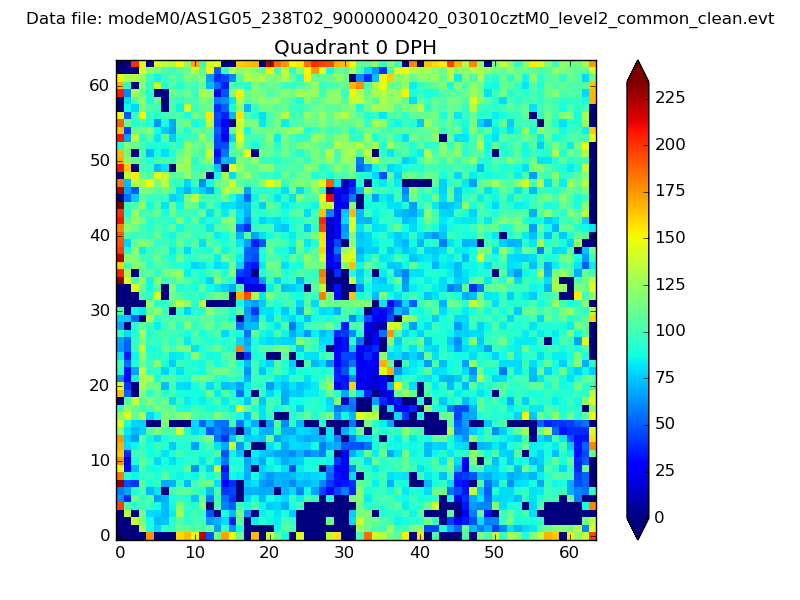 |
 |
Quadrant B |
|---|---|---|---|
| Quadrant D | 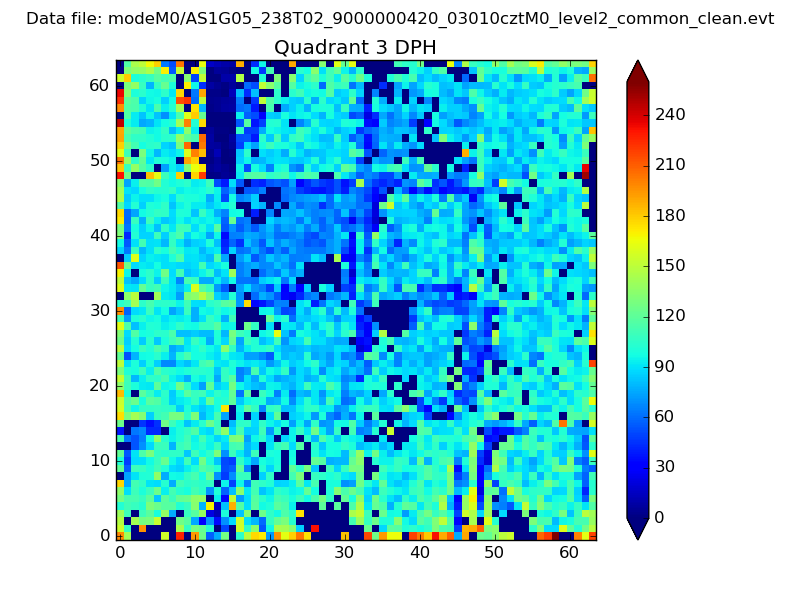 |
 |
Quadrant C |
| Plot type | Count rate plots | Images |
|---|---|---|
| Comparison with Poisson distribution Blue bars denote a histogram of data divided into 1 sec bins. Red curve is a Poisson curve with rate = median count rate of data. |
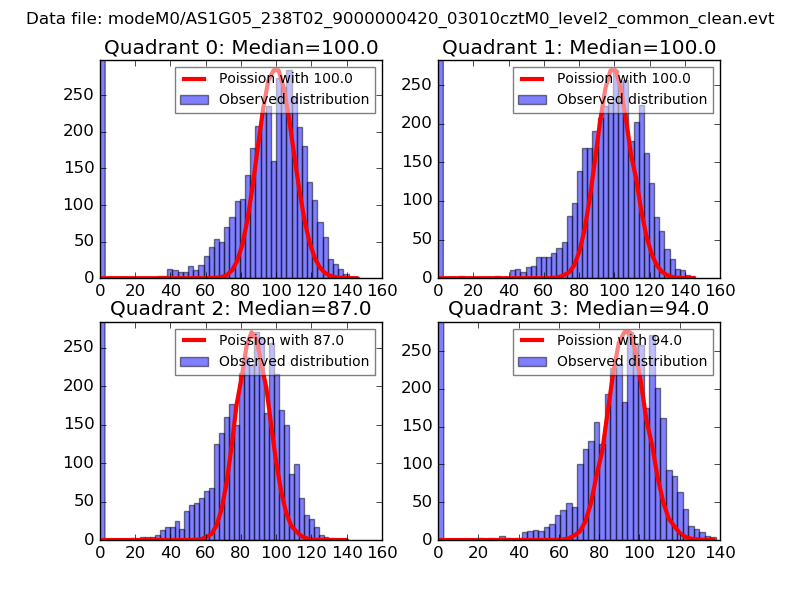 |
 |
| Quadrant-wise count rates Data is divided into 100 sec bins |
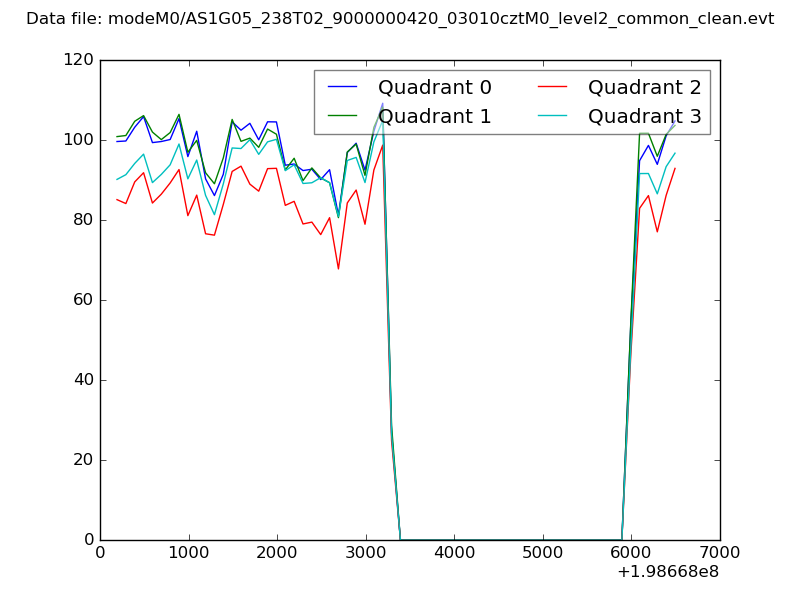 |
|
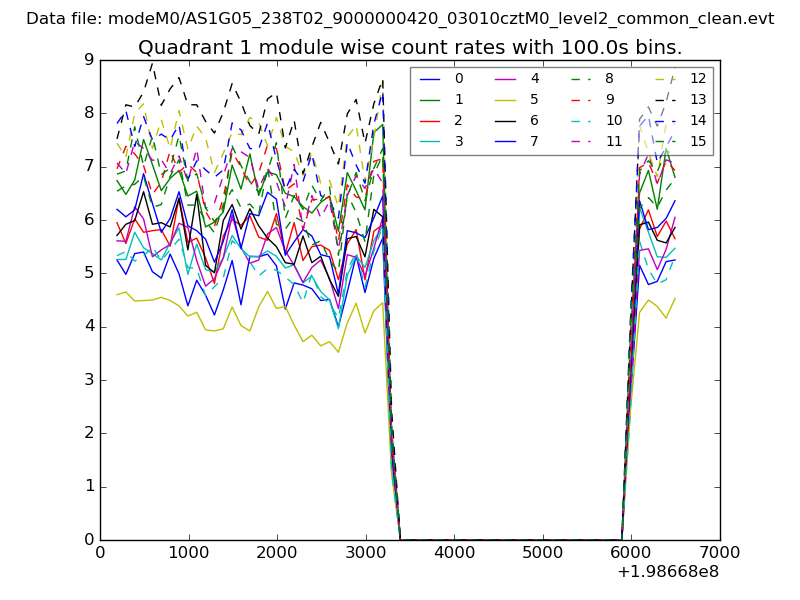
| Module-wise count rates for Quadrant A Data is divided into 100 sec bins |
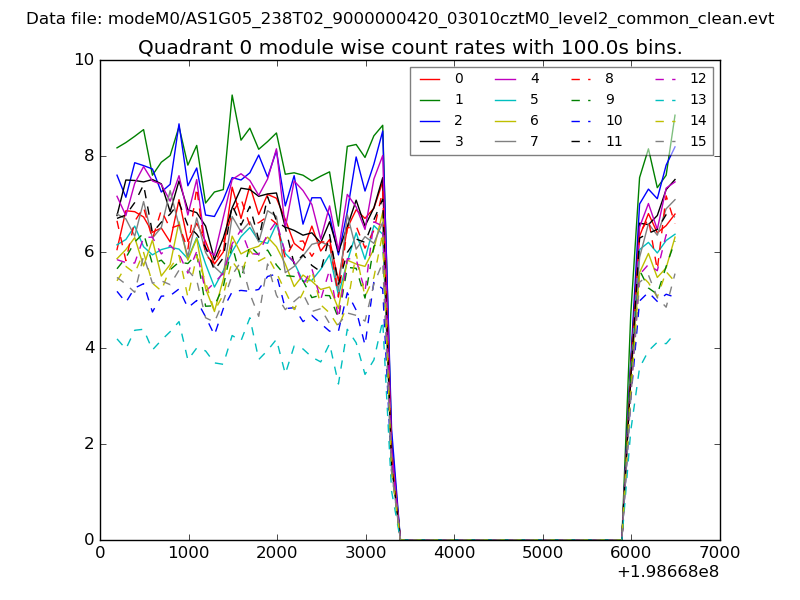 |
 |
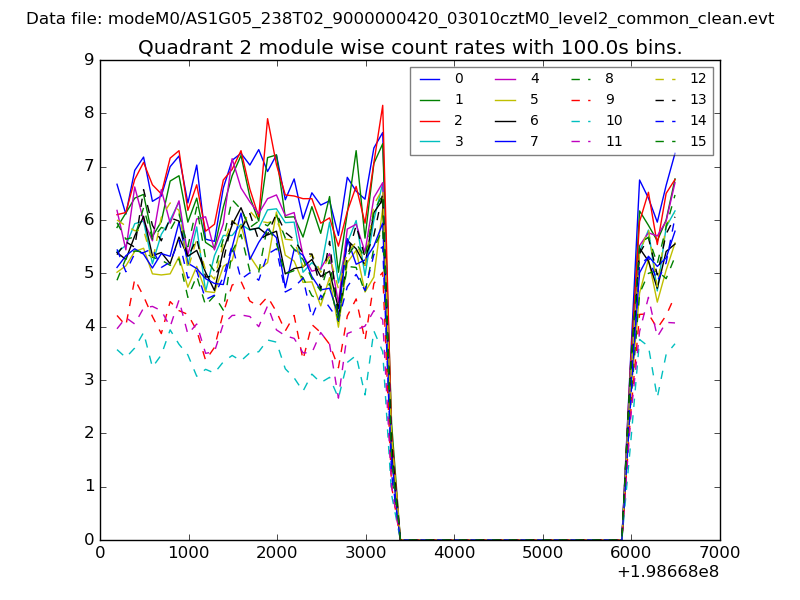
| Module-wise count rates for Quadrant B Data is divided into 100 sec bins |
 |
 |
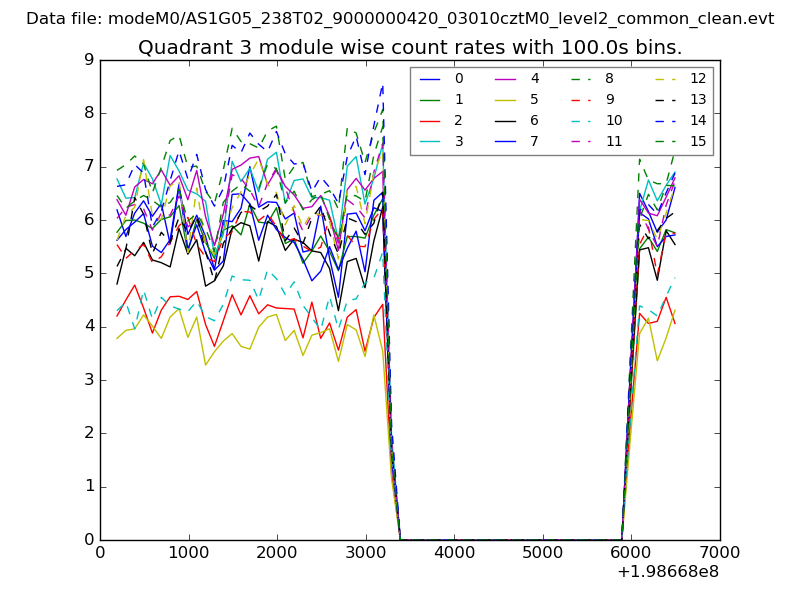
| Module-wise count rates for Quadrant C Data is divided into 100 sec bins |
 |
 |
| Module-wise count rates for Quadrant D Data is divided into 100 sec bins |
 |
 |
| Parameter | Plot |
|---|---|
| CZT HV Monitor | 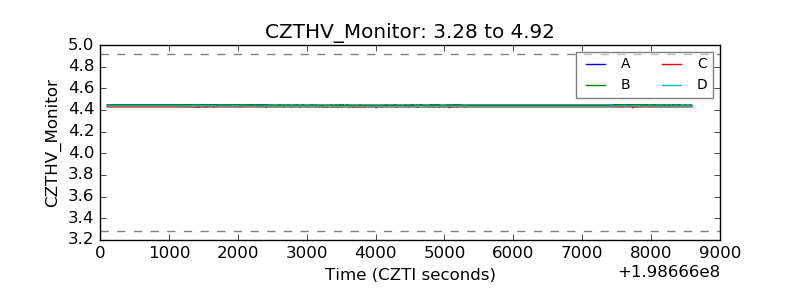 |
| D_VDD | 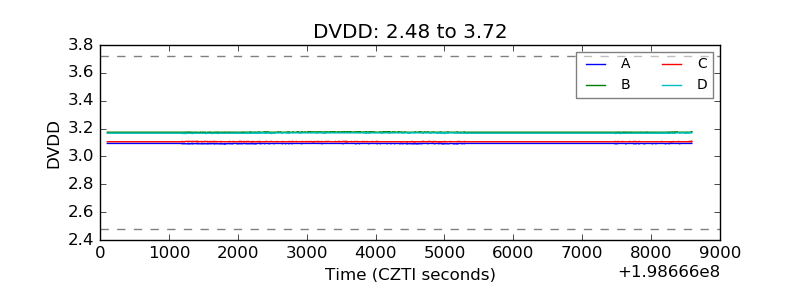 |
| Temperature 1 | 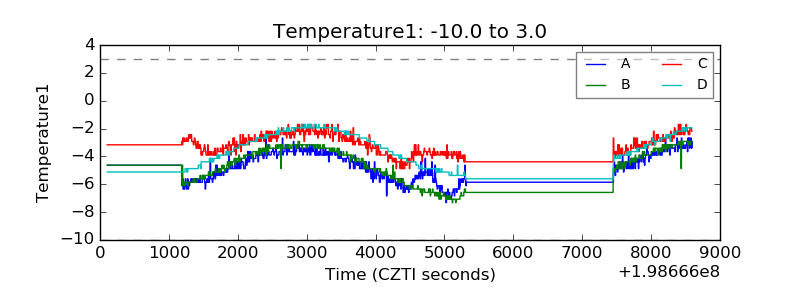 |
| Veto HV Monitor | 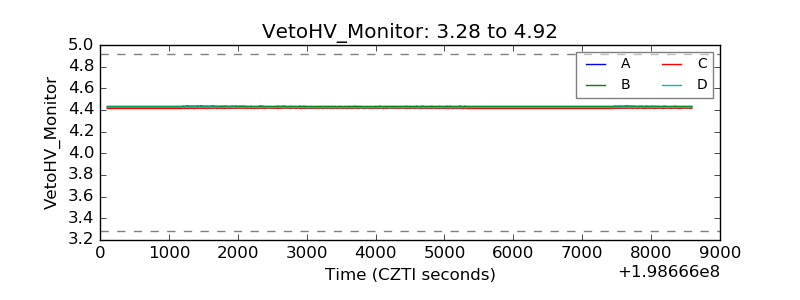 |
| Veto LLD | 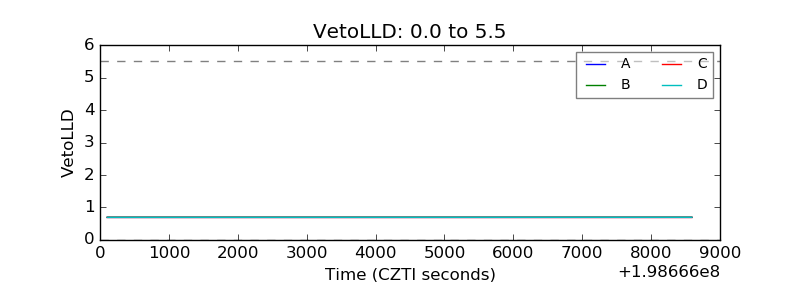 |
| Alpha Counter | 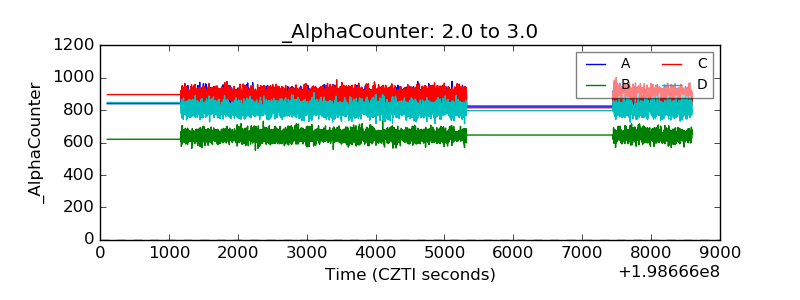 |
| _CPM_Rate | 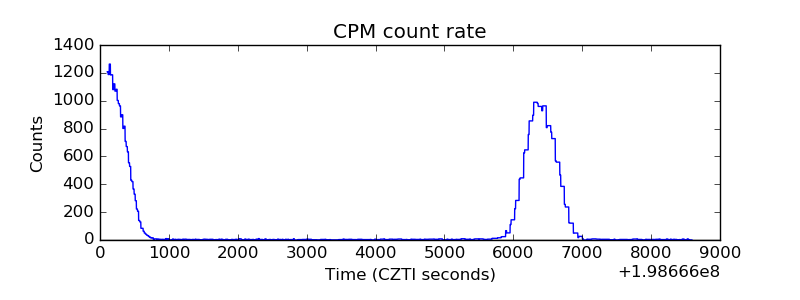 |
| CZT Counter | 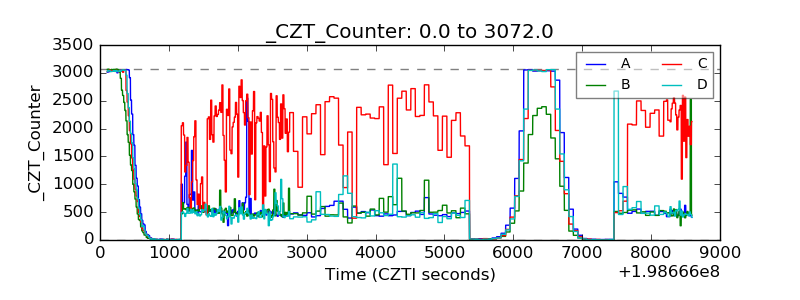 |
| +2.5 Volts monitor |  |
| +5 Volts monitor | 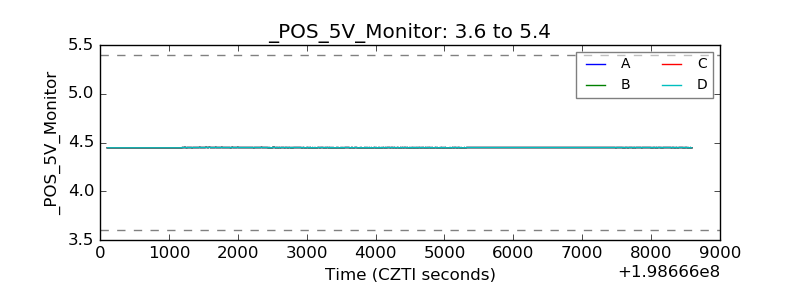 |
| Veto Counter | 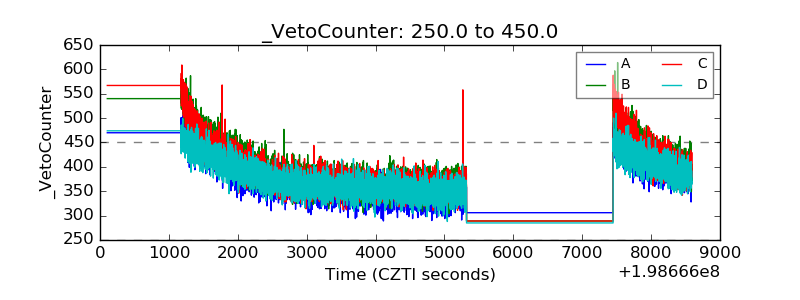 |