| Param | Original file | Final file |
|---|---|---|
| Filename | modeM0/AS1G05_238T02_9000000420_03011cztM0_level2.evt | modeM0/AS1G05_238T02_9000000420_03011cztM0_level2_quad_clean.evt |
| Size (bytes) | 567,564,480 | 72,679,680 |
| Size | 541.3 MB | 69.3 MB |
| Events in quadrant A | 3,563,286 | 483,977 |
| Events in quadrant B | 2,386,252 | 496,422 |
| Events in quadrant C | 8,249,267 | 402,925 |
| Events in quadrant D | 2,656,062 | 470,898 |
| Mode M0 | |||
|---|---|---|---|
| Quadrant | BADHDUFLAG | Total packets | Discarded packets |
| A | 0 | 13927 | 2 |
| B | 0 | 10257 | 1 |
| C | 0 | 27768 | 1 |
| D | 0 | 11207 | 1 |
| Mode SS | |||
|---|---|---|---|
| Quadrant | BADHDUFLAG | Total packets | Discarded packets |
| A | 0 | 100 | 0 |
| B | 0 | 100 | 0 |
| C | 0 | 100 | 0 |
| D | 0 | 100 | 0 |
| Mode M9 | |||
|---|---|---|---|
| Quadrant | BADHDUFLAG | Total packets | Discarded packets |
| A | 0 | 22 | 0 |
| B | 0 | 22 | 0 |
| C | 0 | 22 | 0 |
| D | 0 | 22 | 0 |
| Quadrant | Total seconds | Saturated seconds | Saturation percentage |
|---|---|---|---|
| A | 4929 | 287 | 5.822682% |
| B | 4929 | 25 | 0.507202% |
| C | 4929 | 2050 | 41.590586% |
| D | 4929 | 45 | 0.912964% |
Noise dominated data is calculated using 1-second bins in cleaned event files. If a bin has >2000 counts, and if more than 50% of those come from <1% of pixels, then it is considered to be noise-dominated and hence unusable.
| Quadrant | # 1 sec bins | Bins with >0 counts | Bins with >2000 counts | High rate bins dominated by noise | Noise dominated (total time) | Noise dominated (detector-on time) | Marked lightcurve |
|---|---|---|---|---|---|---|---|
| A | 7056 | 4930 | 203 | 203 | 2.88% | 4.12% | 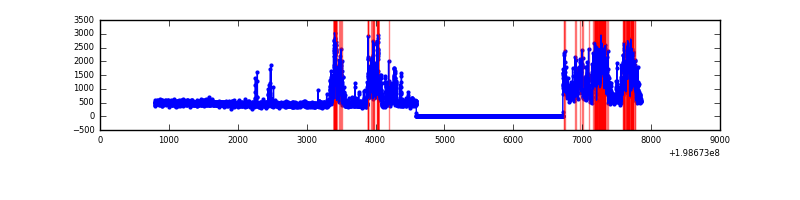 |
| B | 7056 | 4930 | 17 | 17 | 0.24% | 0.34% | 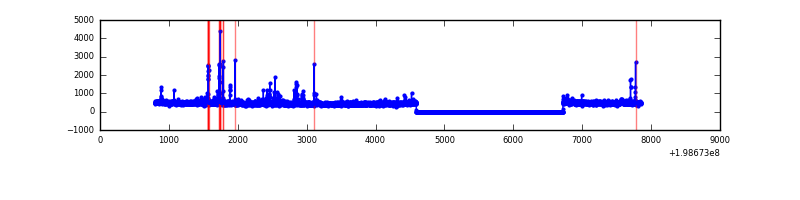 |
| C | 7056 | 4929 | 2133 | 2133 | 30.23% | 43.27% | 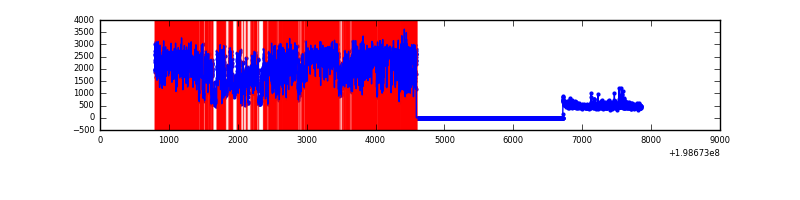 |
| D | 7056 | 4930 | 43 | 43 | 0.61% | 0.87% | 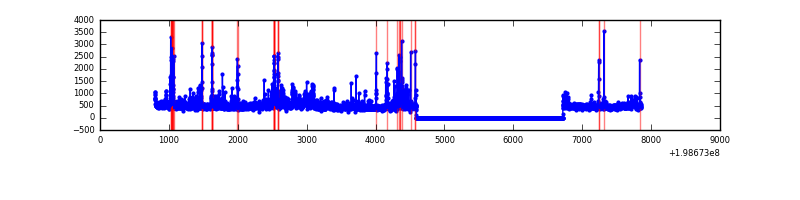 |
Top three noisy pixels from each quadrant. If the there are fewer than three noisy pixels in the level2.evt file, extra rows are filled as -1
| Pixel properties | Quadrant properties | ||||||
|---|---|---|---|---|---|---|---|
| Quadrant | DetID | PixID | Counts | Sigma | Mean | Median | Sigma |
| A | 0 | 50 | 1297763 | 11368.74 | 561 | 549 | 114.1 |
| A | 14 | 249 | 70538 | 613.38 | 561 | 549 | 114.1 |
| A | 13 | 14 | 14199 | 119.63 | 561 | 549 | 114.1 |
| B | 2 | 249 | 60076 | 538.4 | 573 | 559 | 110.5 |
| B | 0 | 219 | 54951 | 492.03 | 573 | 559 | 110.5 |
| B | 3 | 27 | 26882 | 238.12 | 573 | 559 | 110.5 |
| C | 0 | 219 | 5893962 | 51586.27 | 491 | 493 | 114.2 |
| C | 1 | 192 | 387481 | 3387.35 | 491 | 493 | 114.2 |
| C | 6 | 80 | 21070 | 180.11 | 491 | 493 | 114.2 |
| D | 7 | 80 | 186502 | 1387.22 | 552 | 536 | 134.1 |
| D | 13 | 114 | 175896 | 1308.1 | 552 | 536 | 134.1 |
| D | 13 | 239 | 34408 | 252.67 | 552 | 536 | 134.1 |
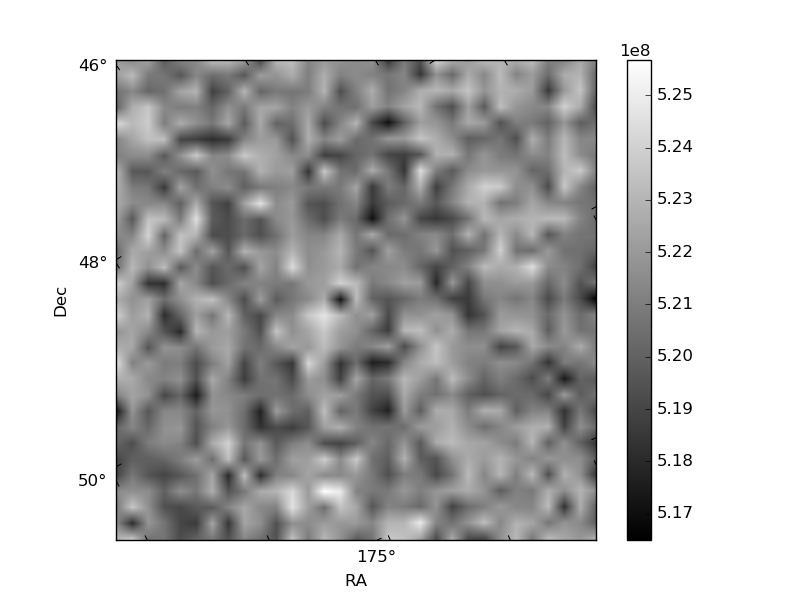
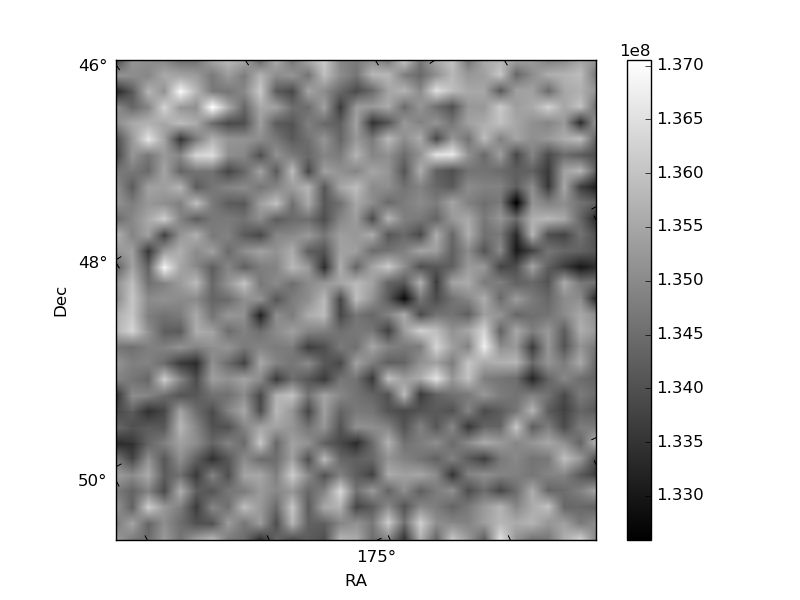
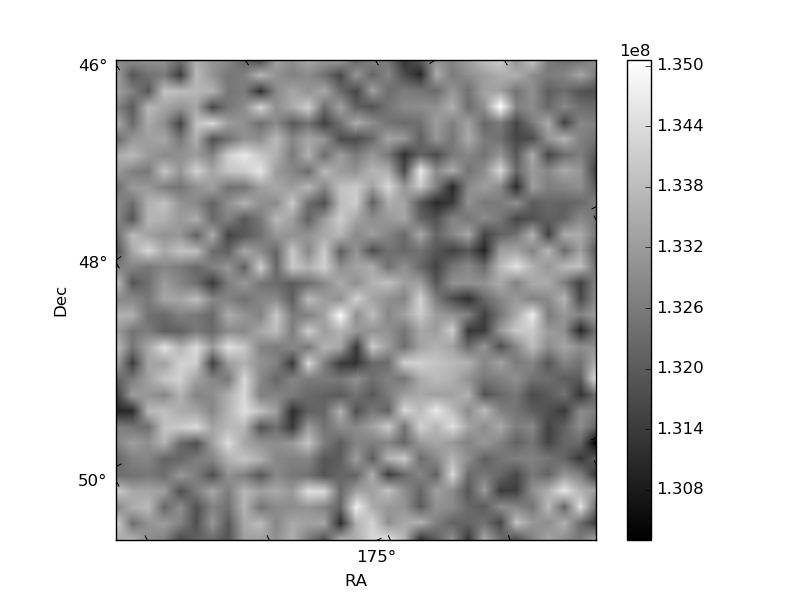
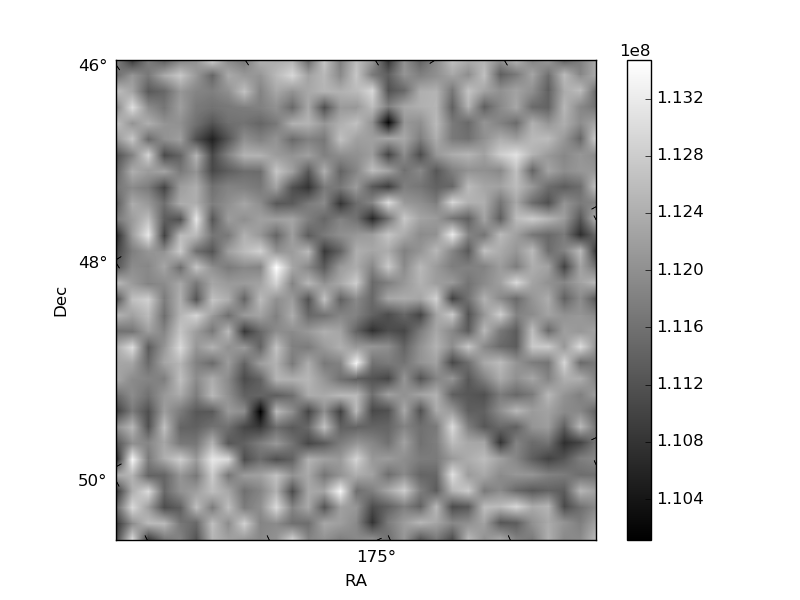
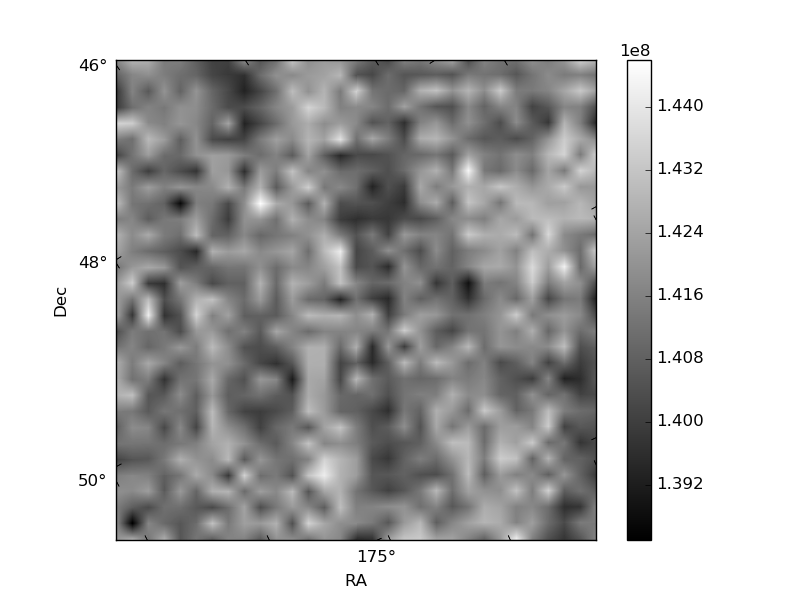
Histogram calculated using DETX and DETY for each event in the final _common_clean file
| Quadrant A | 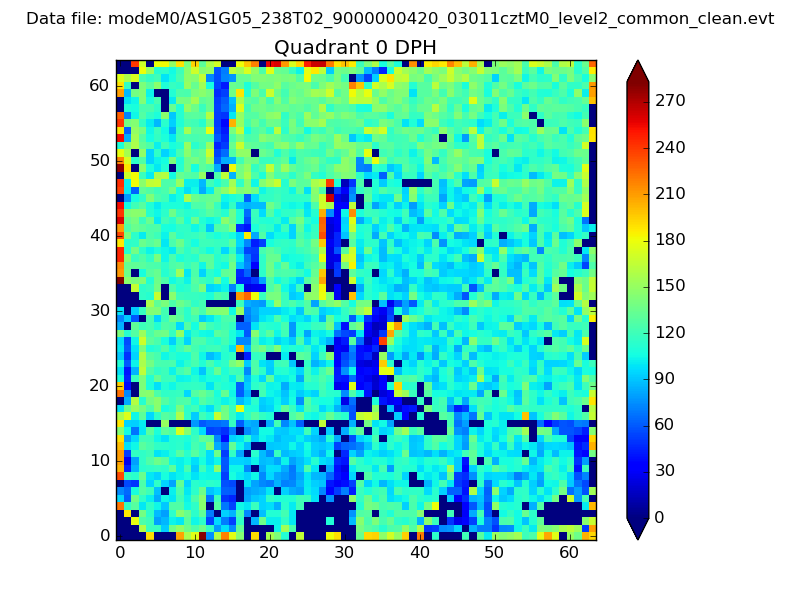 |
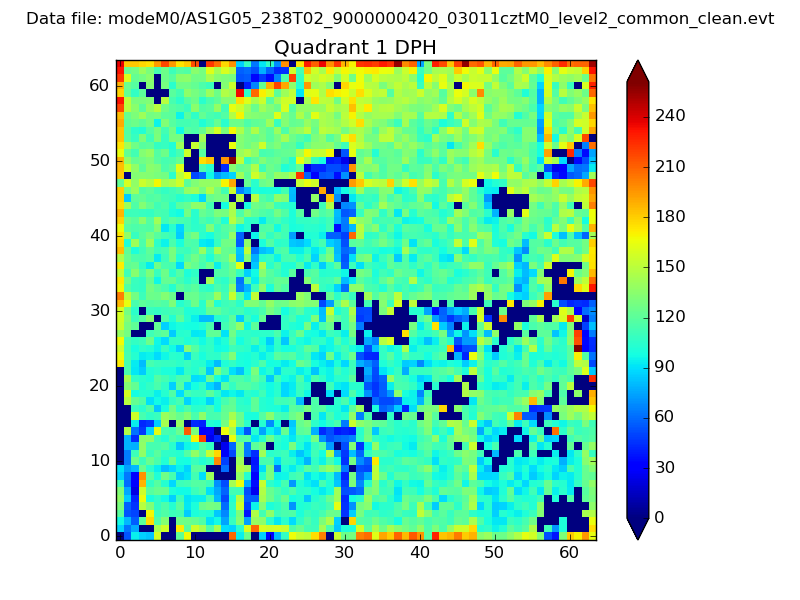 |
Quadrant B |
|---|---|---|---|
| Quadrant D | 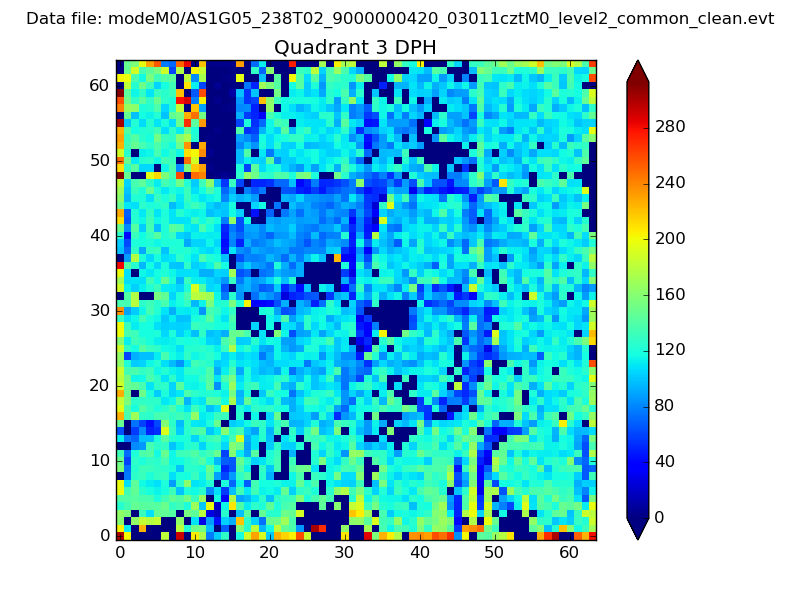 |
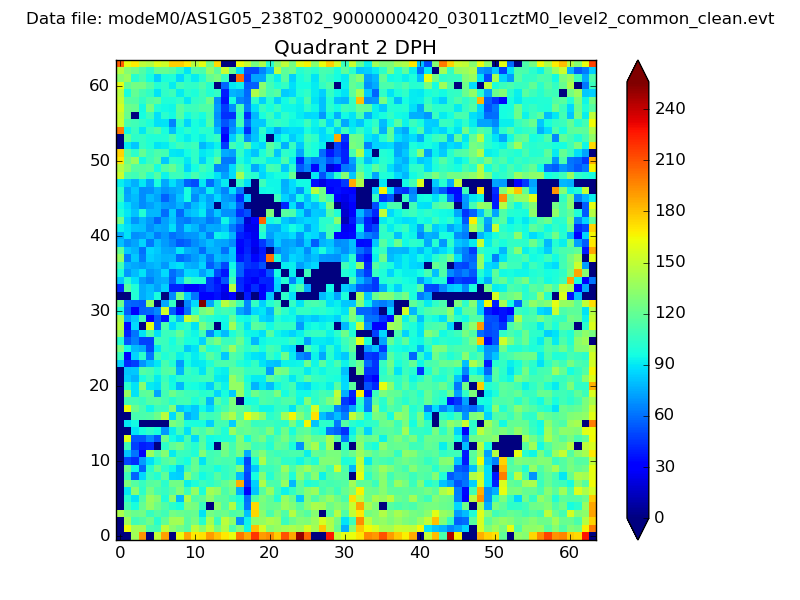 |
Quadrant C |
| Plot type | Count rate plots | Images |
|---|---|---|
| Comparison with Poisson distribution Blue bars denote a histogram of data divided into 1 sec bins. Red curve is a Poisson curve with rate = median count rate of data. |
 |
 |
| Quadrant-wise count rates Data is divided into 100 sec bins |
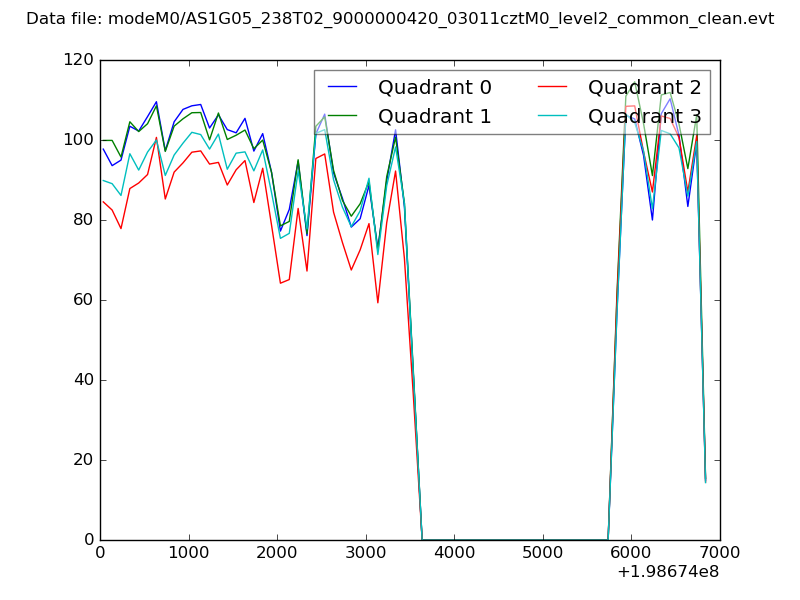 |
|
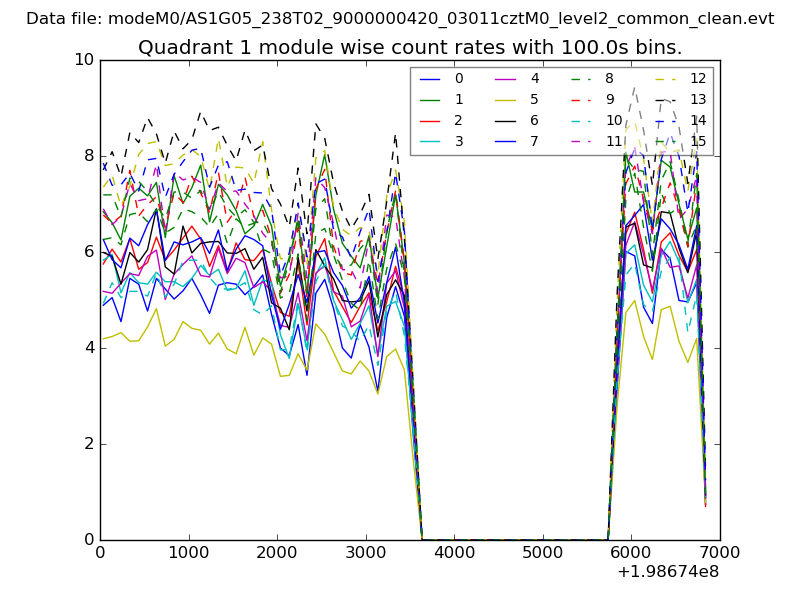
| Module-wise count rates for Quadrant A Data is divided into 100 sec bins |
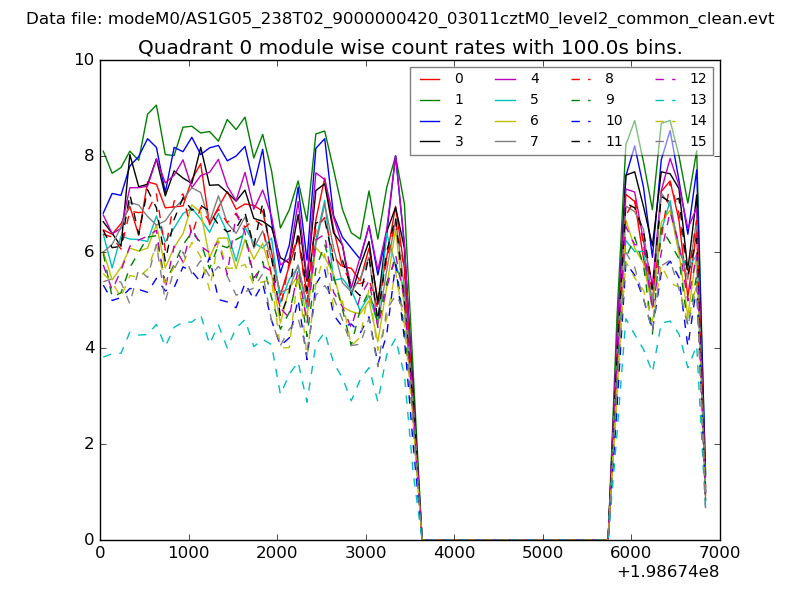 |
 |
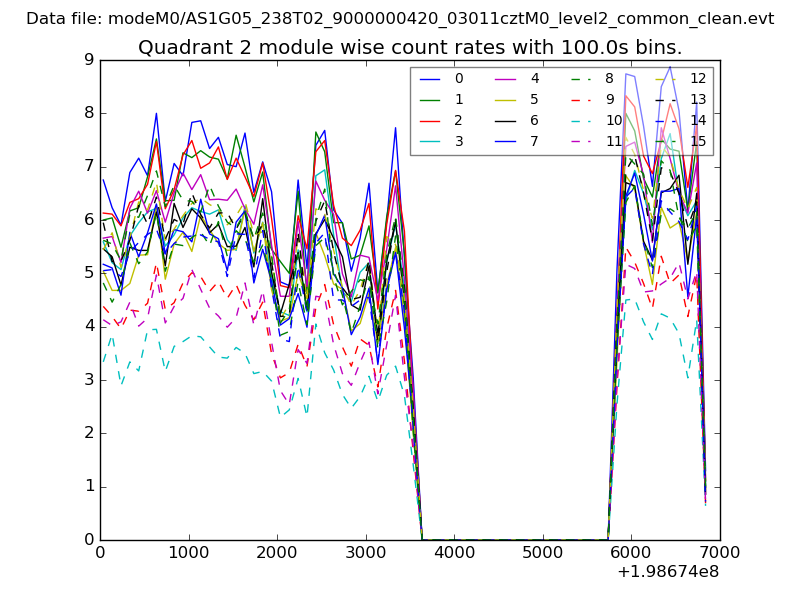
| Module-wise count rates for Quadrant B Data is divided into 100 sec bins |
 |
 |
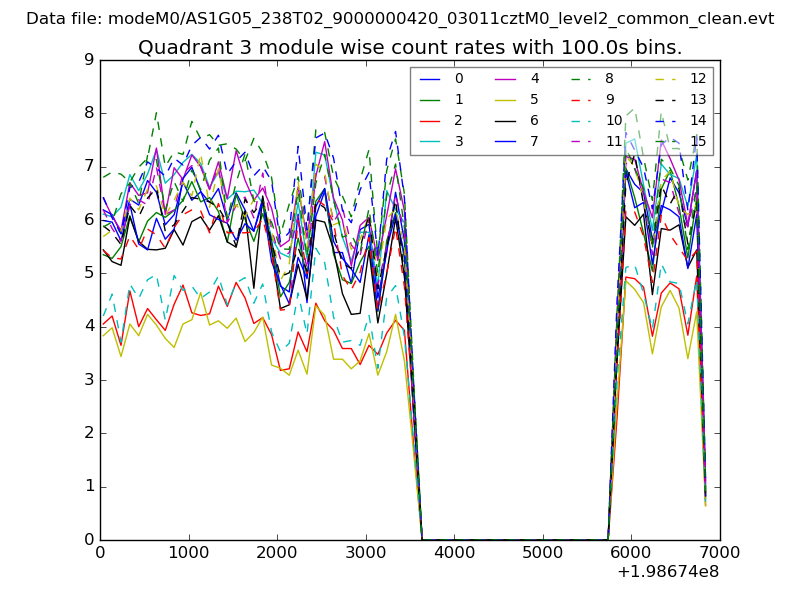
| Module-wise count rates for Quadrant C Data is divided into 100 sec bins |
 |
 |
| Module-wise count rates for Quadrant D Data is divided into 100 sec bins |
 |
 |
| Parameter | Plot |
|---|---|
| CZT HV Monitor | 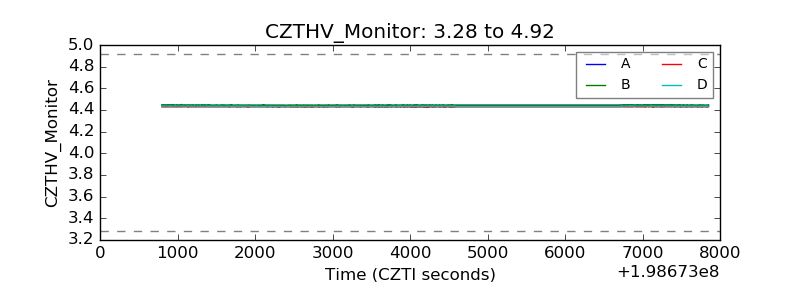 |
| D_VDD | 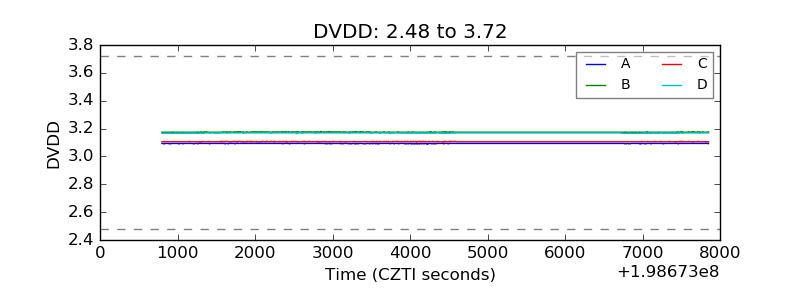 |
| Temperature 1 | 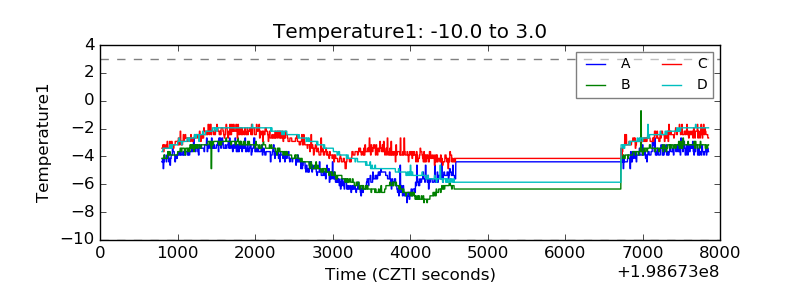 |
| Veto HV Monitor | 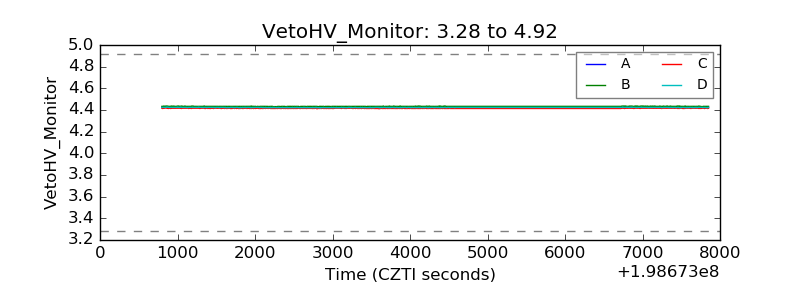 |
| Veto LLD | 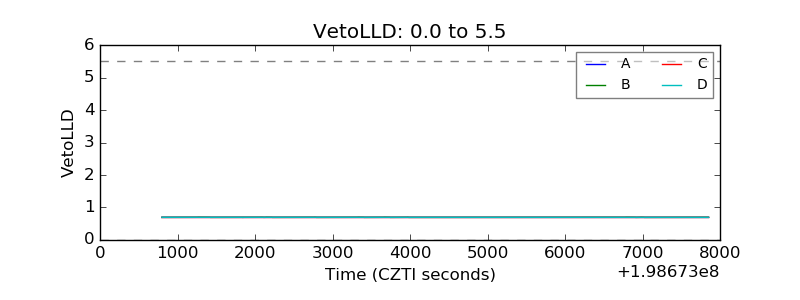 |
| Alpha Counter | 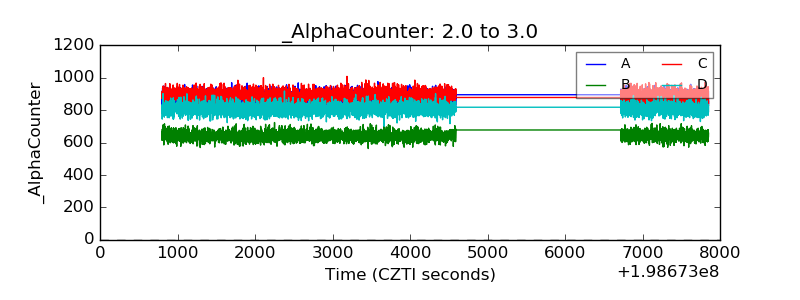 |
| _CPM_Rate | 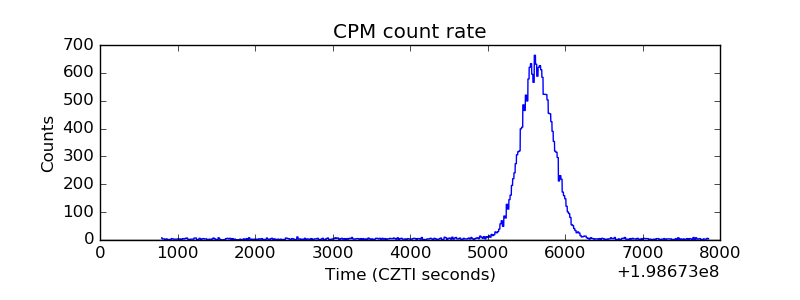 |
| CZT Counter | 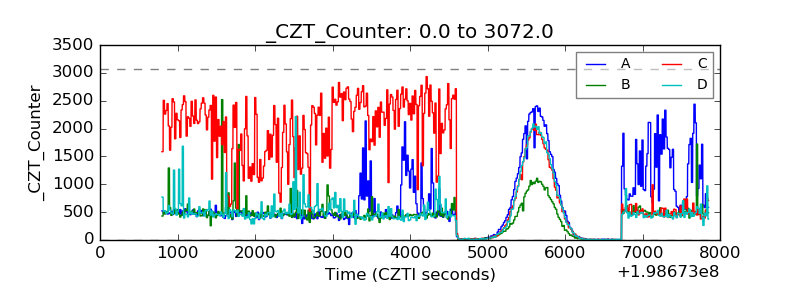 |
| +2.5 Volts monitor | 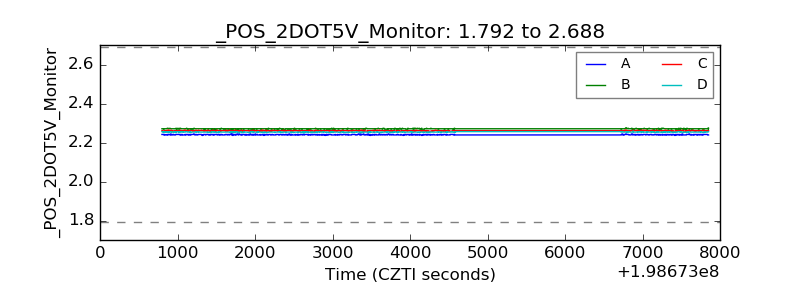 |
| +5 Volts monitor | 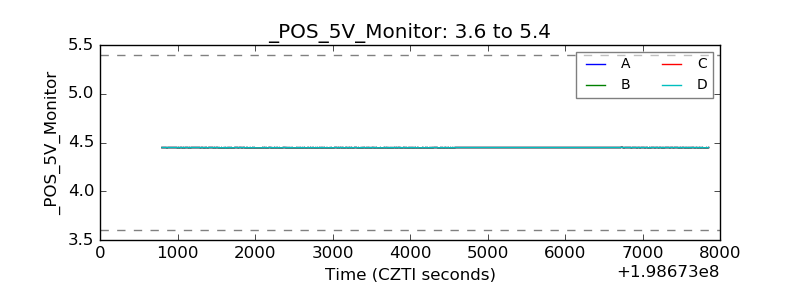 |
| Veto Counter | 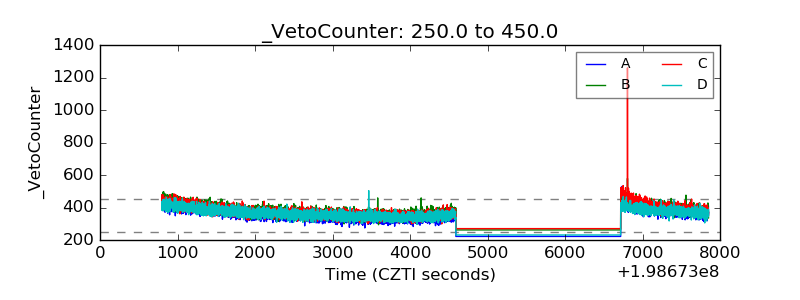 |