| Param | Original file | Final file |
|---|---|---|
| Filename | modeM0/AS1G05_238T02_9000000420_03012cztM0_level2.evt | modeM0/AS1G05_238T02_9000000420_03012cztM0_level2_quad_clean.evt |
| Size (bytes) | 444,683,520 | 77,938,560 |
| Size | 424.1 MB | 74.3 MB |
| Events in quadrant A | 4,871,090 | 492,849 |
| Events in quadrant B | 2,551,127 | 510,785 |
| Events in quadrant C | 2,670,747 | 504,789 |
| Events in quadrant D | 3,021,389 | 487,251 |
| Mode M0 | |||
|---|---|---|---|
| Quadrant | BADHDUFLAG | Total packets | Discarded packets |
| A | 0 | 18081 | 3 |
| B | 0 | 11110 | 2 |
| C | 0 | 11458 | 2 |
| D | 0 | 12557 | 2 |
| Mode SS | |||
|---|---|---|---|
| Quadrant | BADHDUFLAG | Total packets | Discarded packets |
| A | 0 | 106 | 0 |
| B | 0 | 106 | 0 |
| C | 0 | 106 | 0 |
| D | 0 | 106 | 0 |
| Mode M9 | |||
|---|---|---|---|
| Quadrant | BADHDUFLAG | Total packets | Discarded packets |
| A | 0 | 24 | 0 |
| B | 0 | 24 | 0 |
| C | 0 | 24 | 0 |
| D | 0 | 25 | 0 |
| Quadrant | Total seconds | Saturated seconds | Saturation percentage |
|---|---|---|---|
| A | 5198 | 480 | 9.234321% |
| B | 5198 | 58 | 1.115814% |
| C | 5198 | 29 | 0.557907% |
| D | 5198 | 89 | 1.712197% |
Noise dominated data is calculated using 1-second bins in cleaned event files. If a bin has >2000 counts, and if more than 50% of those come from <1% of pixels, then it is considered to be noise-dominated and hence unusable.
| Quadrant | # 1 sec bins | Bins with >0 counts | Bins with >2000 counts | High rate bins dominated by noise | Noise dominated (total time) | Noise dominated (detector-on time) | Marked lightcurve |
|---|---|---|---|---|---|---|---|
| A | 7324 | 5199 | 380 | 380 | 5.19% | 7.31% | 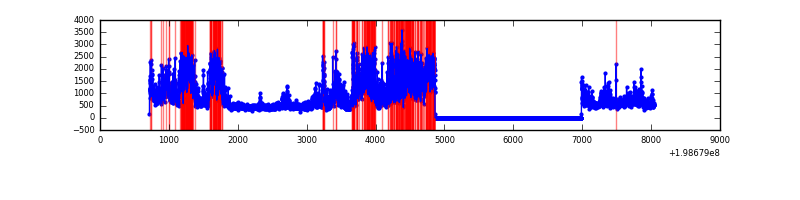 |
| B | 7324 | 5199 | 45 | 45 | 0.61% | 0.87% | 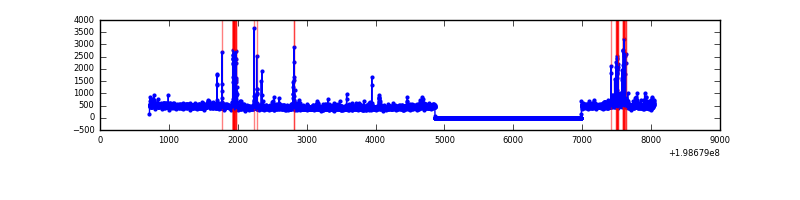 |
| C | 7324 | 5199 | 34 | 34 | 0.46% | 0.65% | 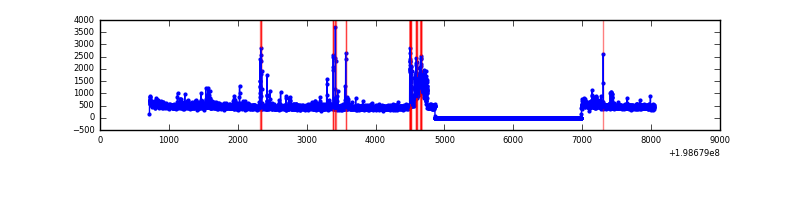 |
| D | 7324 | 5199 | 91 | 91 | 1.24% | 1.75% | 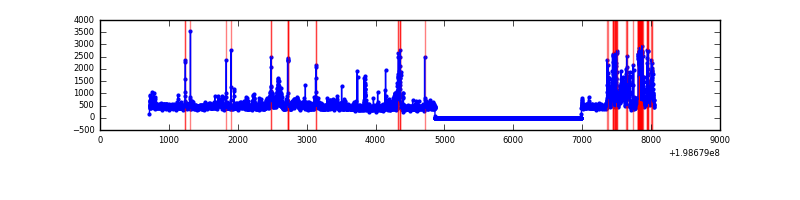 |
Top three noisy pixels from each quadrant. If the there are fewer than three noisy pixels in the level2.evt file, extra rows are filled as -1
| Pixel properties | Quadrant properties | ||||||
|---|---|---|---|---|---|---|---|
| Quadrant | DetID | PixID | Counts | Sigma | Mean | Median | Sigma |
| A | 0 | 50 | 2439261 | 21128.93 | 568 | 557 | 115.4 |
| A | 14 | 249 | 146828 | 1267.29 | 568 | 557 | 115.4 |
| A | 0 | 230 | 35754 | 304.95 | 568 | 557 | 115.4 |
| B | 2 | 249 | 163414 | 1447.33 | 586 | 573 | 112.5 |
| B | 10 | 244 | 37432 | 327.6 | 586 | 573 | 112.5 |
| B | 15 | 204 | 25864 | 224.79 | 586 | 573 | 112.5 |
| C | 0 | 219 | 269042 | 2007.62 | 570 | 574 | 133.7 |
| C | 1 | 192 | 102613 | 763.05 | 570 | 574 | 133.7 |
| C | 6 | 80 | 35991 | 264.85 | 570 | 574 | 133.7 |
| D | 7 | 80 | 458905 | 3159.2 | 561 | 548 | 145.1 |
| D | 13 | 114 | 255056 | 1754.18 | 561 | 548 | 145.1 |
| D | 10 | 237 | 64640 | 441.75 | 561 | 548 | 145.1 |
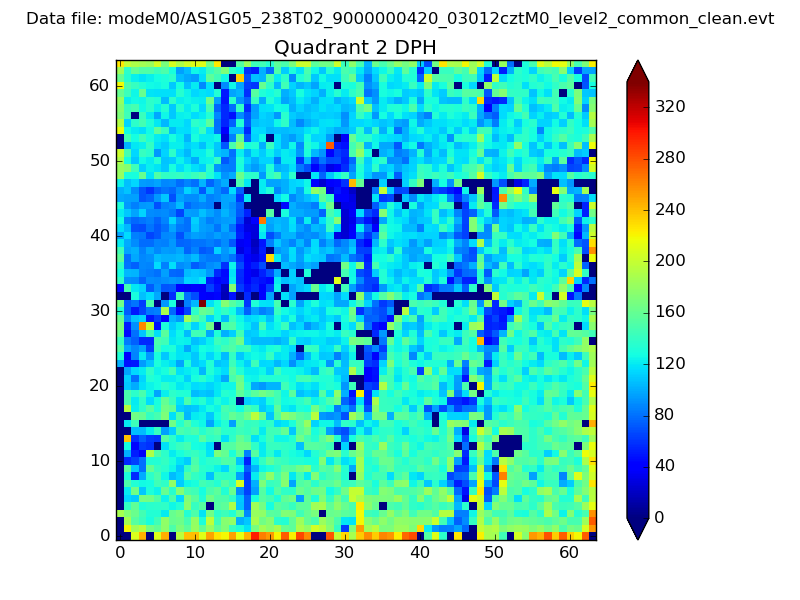
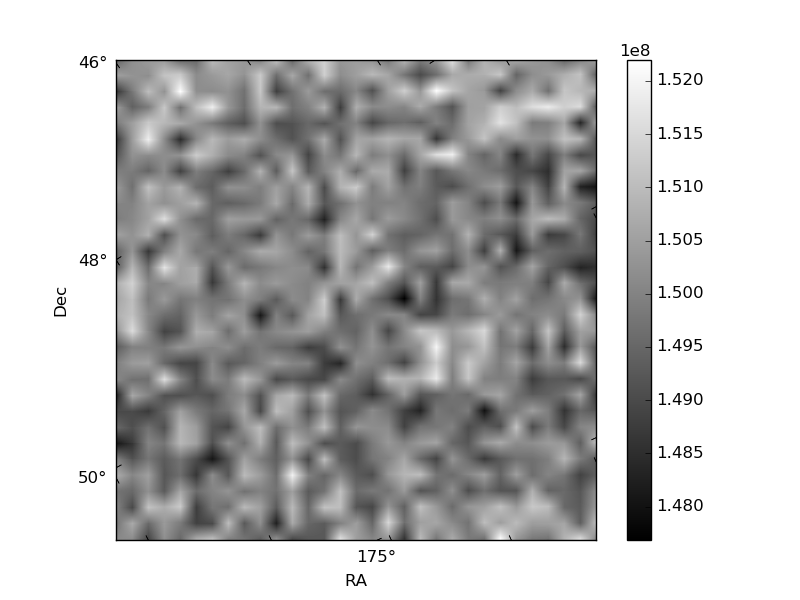
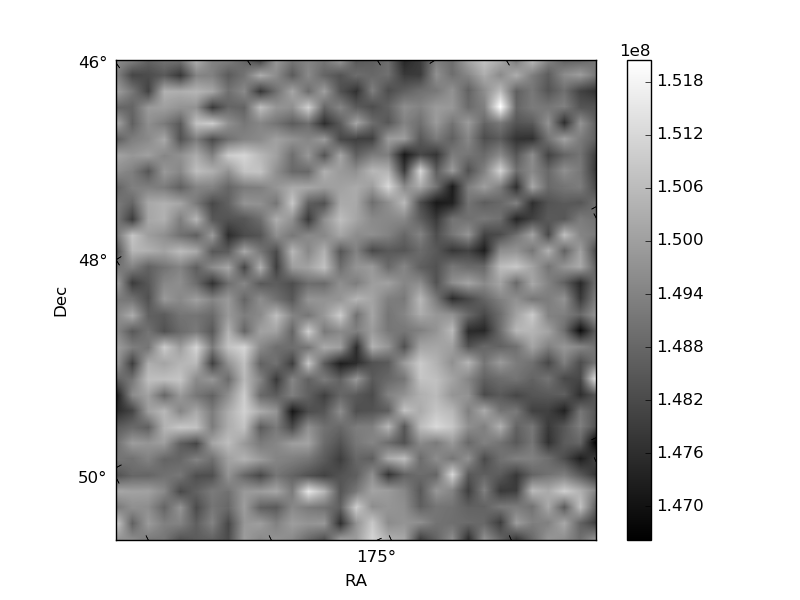
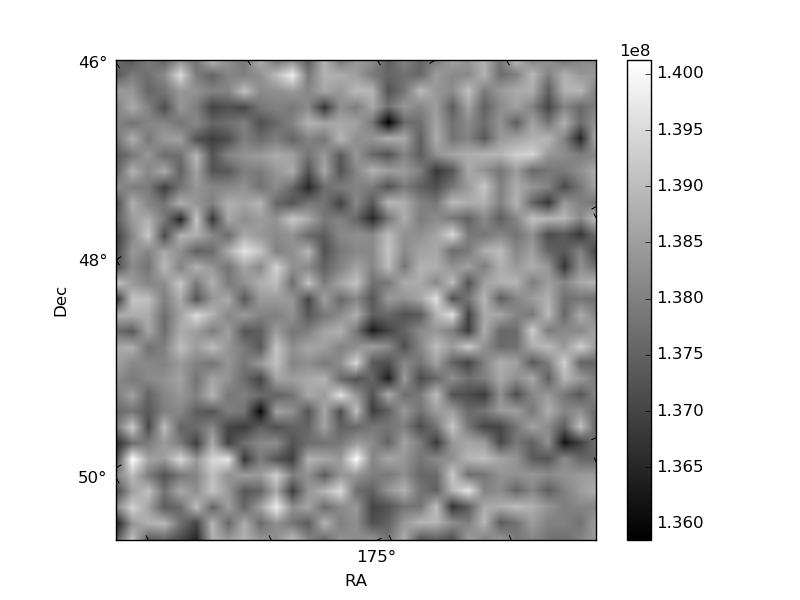
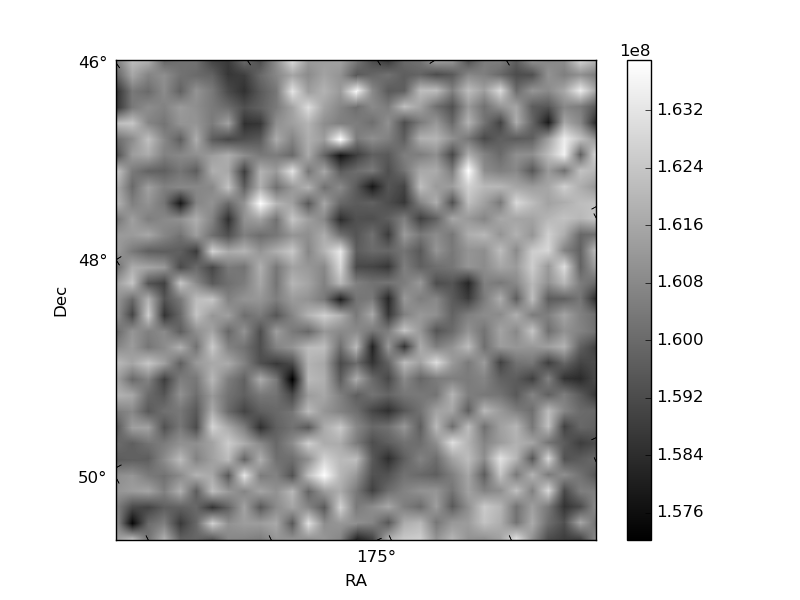
Histogram calculated using DETX and DETY for each event in the final _common_clean file
| Quadrant A | 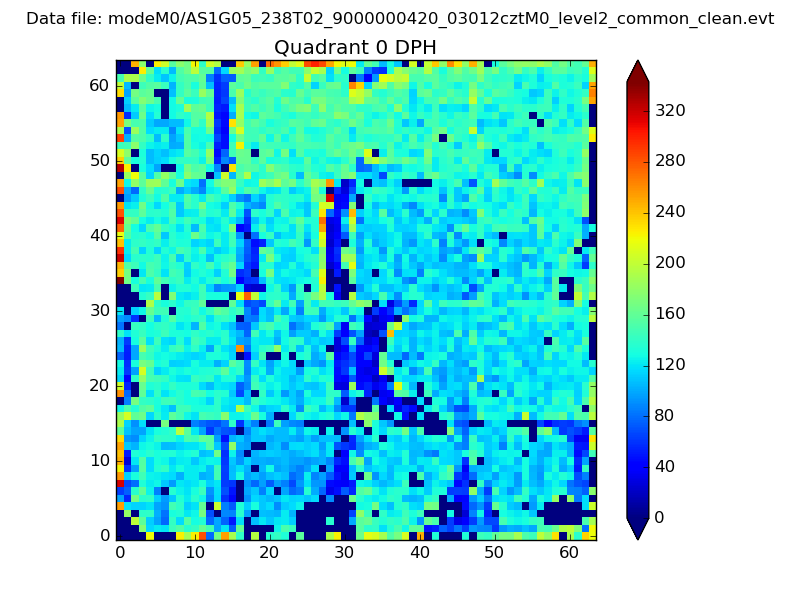 |
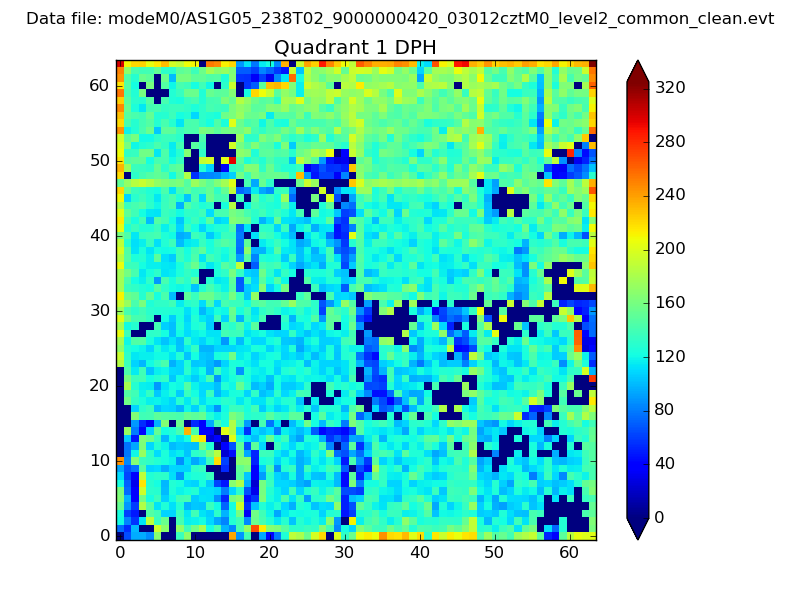 |
Quadrant B |
|---|---|---|---|
| Quadrant D | 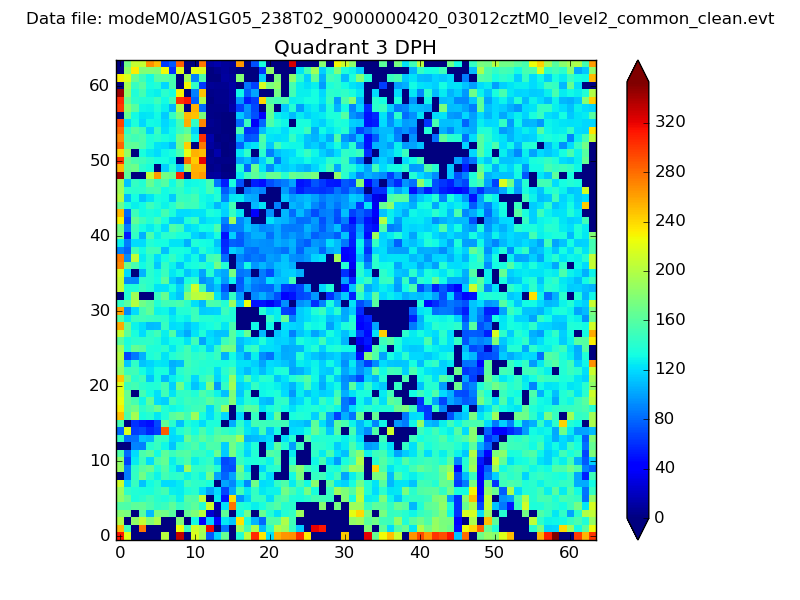 |
 |
Quadrant C |
| Plot type | Count rate plots | Images |
|---|---|---|
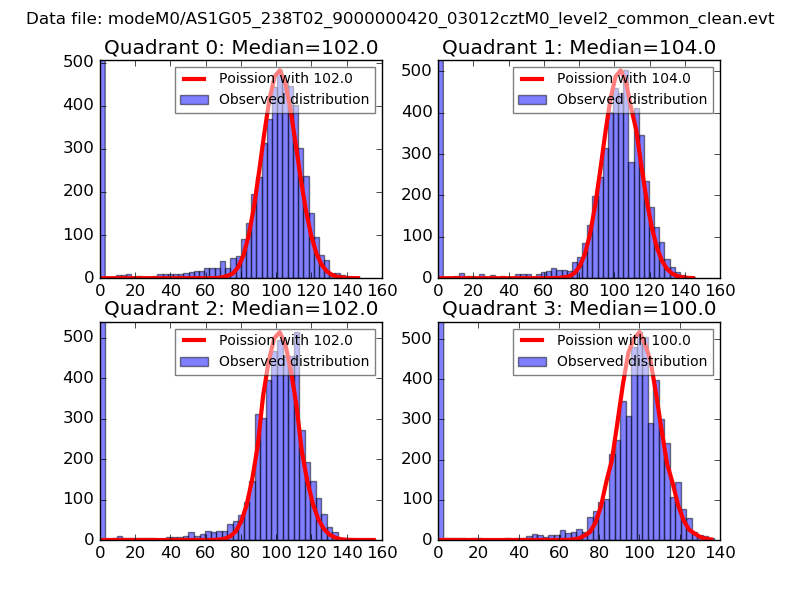
| Comparison with Poisson distribution Blue bars denote a histogram of data divided into 1 sec bins. Red curve is a Poisson curve with rate = median count rate of data. |
 |
 |
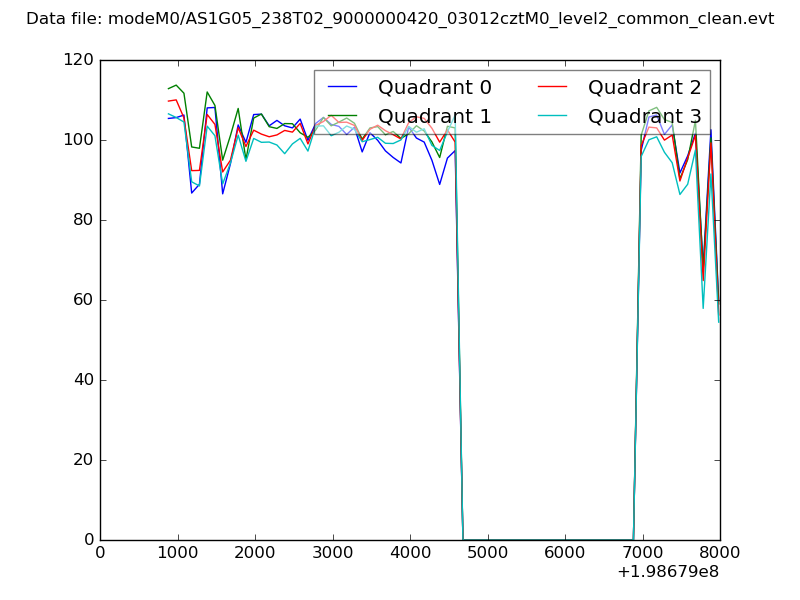
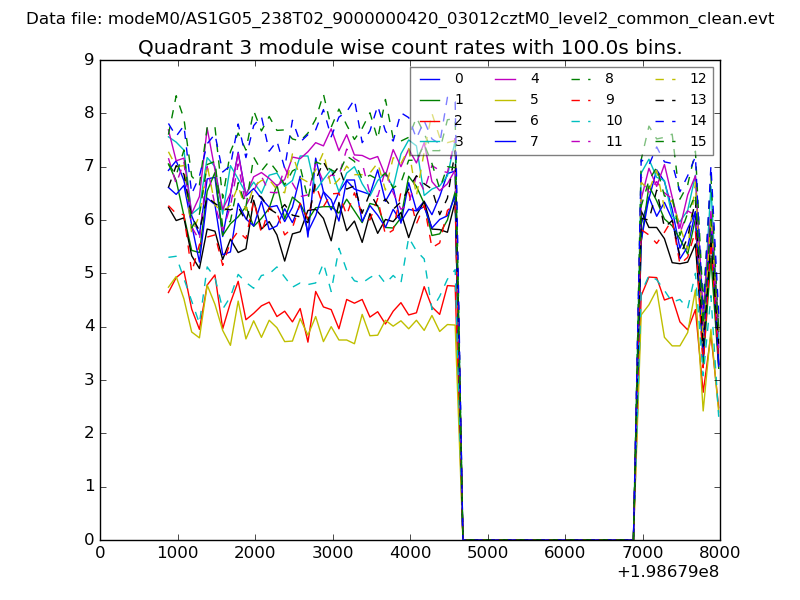
| Quadrant-wise count rates Data is divided into 100 sec bins |
 |
|
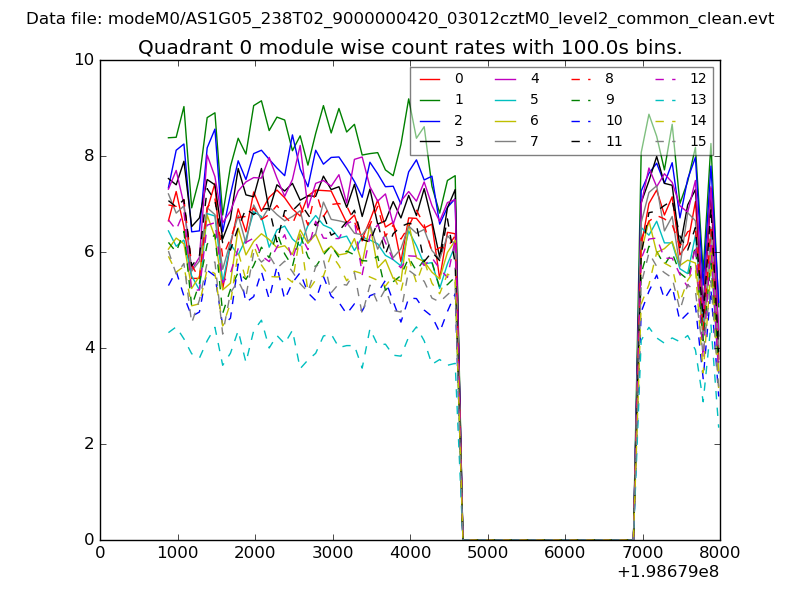
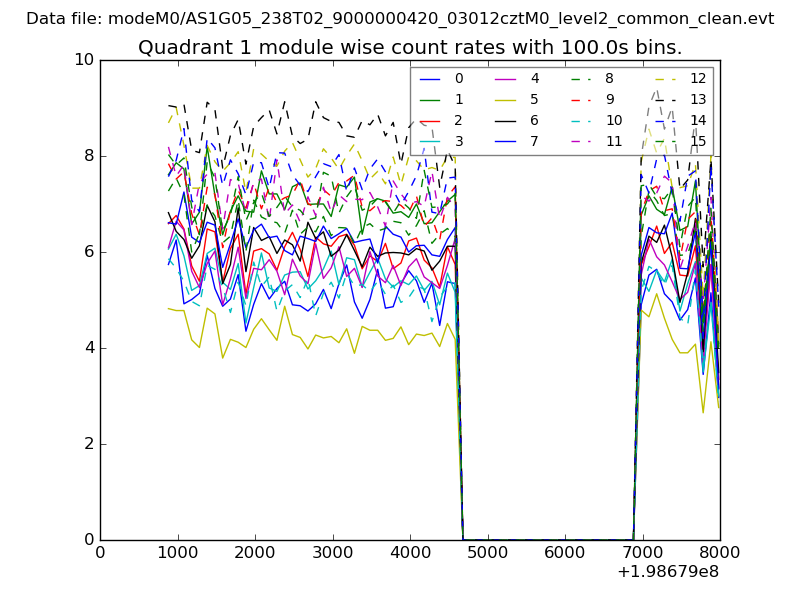
| Module-wise count rates for Quadrant A Data is divided into 100 sec bins |
 |
 |
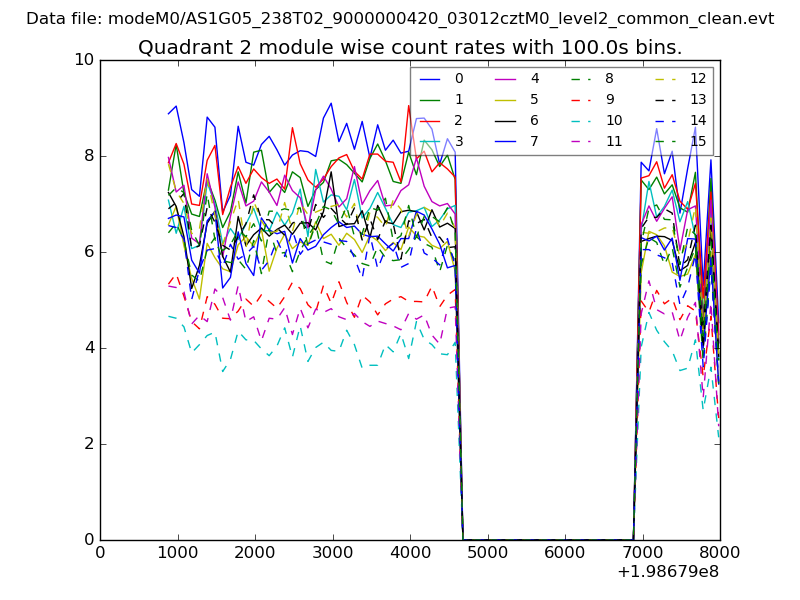
| Module-wise count rates for Quadrant B Data is divided into 100 sec bins |
 |
 |
| Module-wise count rates for Quadrant C Data is divided into 100 sec bins |
 |
 |
| Module-wise count rates for Quadrant D Data is divided into 100 sec bins |
 |
 |
| Parameter | Plot |
|---|---|
| CZT HV Monitor | 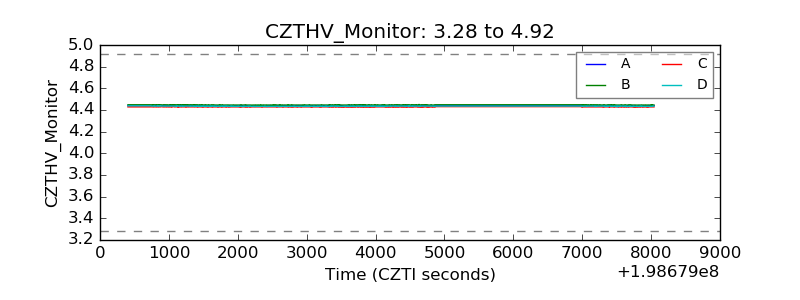 |
| D_VDD | 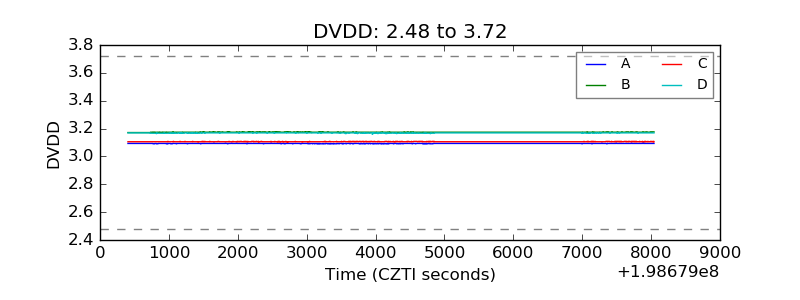 |
| Temperature 1 | 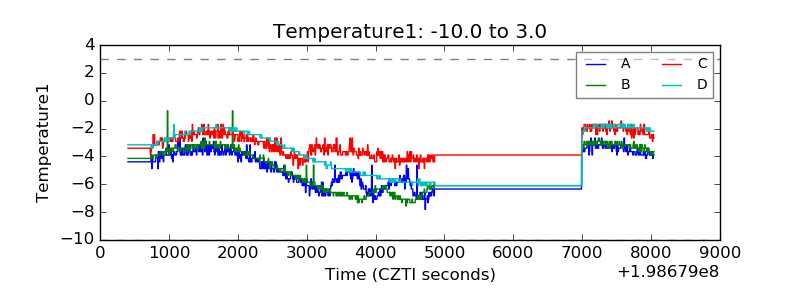 |
| Veto HV Monitor | 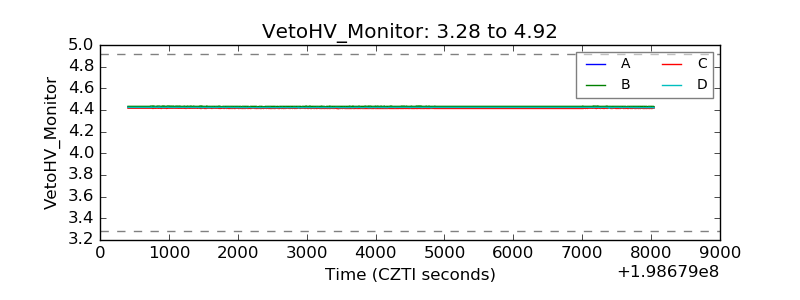 |
| Veto LLD | 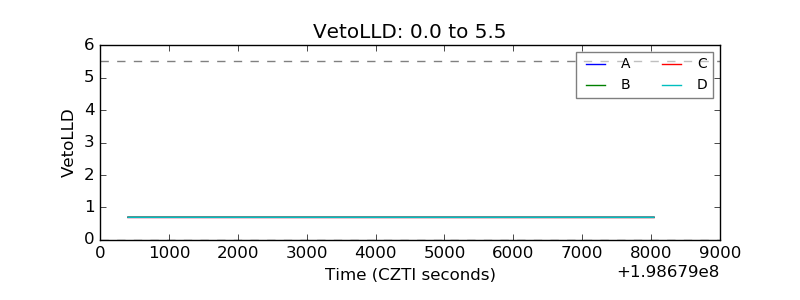 |
| Alpha Counter | 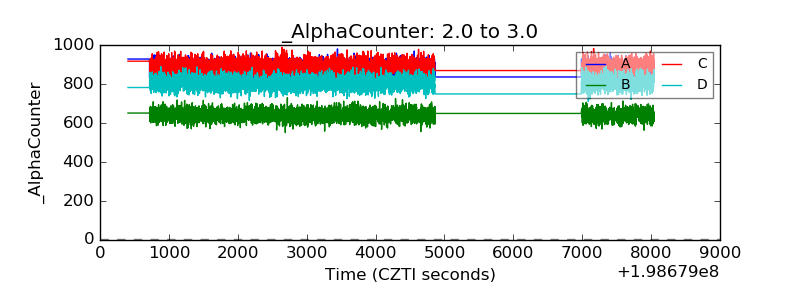 |
| _CPM_Rate | 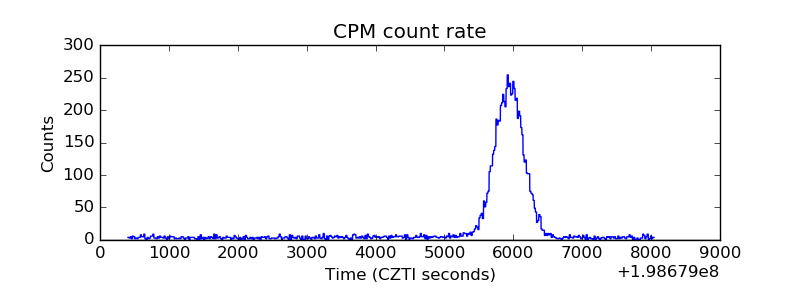 |
| CZT Counter | 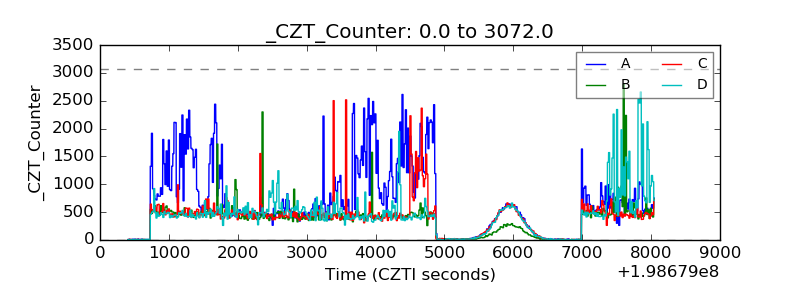 |
| +2.5 Volts monitor |  |
| +5 Volts monitor |  |
| Veto Counter | 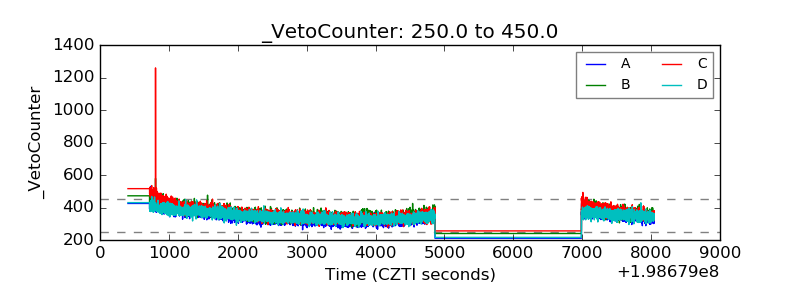 |