| Param | Original file | Final file |
|---|---|---|
| Filename | modeM0/AS1G05_238T02_9000000420_03014cztM0_level2.evt | modeM0/AS1G05_238T02_9000000420_03014cztM0_level2_quad_clean.evt |
| Size (bytes) | 477,270,720 | 67,723,200 |
| Size | 455.2 MB | 64.6 MB |
| Events in quadrant A | 2,813,407 | 440,027 |
| Events in quadrant B | 2,314,914 | 445,077 |
| Events in quadrant C | 5,161,259 | 400,383 |
| Events in quadrant D | 3,828,427 | 417,088 |
| Mode M0 | |||
|---|---|---|---|
| Quadrant | BADHDUFLAG | Total packets | Discarded packets |
| A | 0 | 11816 | 3 |
| B | 0 | 10458 | 2 |
| C | 0 | 18791 | 2 |
| D | 0 | 15088 | 2 |
| Mode SS | |||
|---|---|---|---|
| Quadrant | BADHDUFLAG | Total packets | Discarded packets |
| A | 0 | 100 | 0 |
| B | 0 | 100 | 0 |
| C | 0 | 100 | 0 |
| D | 0 | 100 | 0 |
| Mode M9 | |||
|---|---|---|---|
| Quadrant | BADHDUFLAG | Total packets | Discarded packets |
| A | 0 | 24 | 0 |
| B | 0 | 24 | 0 |
| C | 0 | 24 | 0 |
| D | 0 | 25 | 0 |
| Quadrant | Total seconds | Saturated seconds | Saturation percentage |
|---|---|---|---|
| A | 4962 | 64 | 1.289802% |
| B | 4962 | 14 | 0.282144% |
| C | 4962 | 701 | 14.127368% |
| D | 4962 | 210 | 4.232164% |
Noise dominated data is calculated using 1-second bins in cleaned event files. If a bin has >2000 counts, and if more than 50% of those come from <1% of pixels, then it is considered to be noise-dominated and hence unusable.
| Quadrant | # 1 sec bins | Bins with >0 counts | Bins with >2000 counts | High rate bins dominated by noise | Noise dominated (total time) | Noise dominated (detector-on time) | Marked lightcurve |
|---|---|---|---|---|---|---|---|
| A | 7089 | 4964 | 73 | 73 | 1.03% | 1.47% |  |
| B | 7089 | 4964 | 14 | 14 | 0.20% | 0.28% |  |
| C | 7089 | 4964 | 677 | 677 | 9.55% | 13.64% | 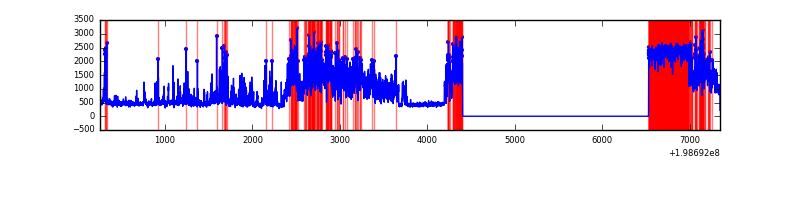 |
| D | 7089 | 4964 | 237 | 237 | 3.34% | 4.77% |  |
Top three noisy pixels from each quadrant. If the there are fewer than three noisy pixels in the level2.evt file, extra rows are filled as -1
| Pixel properties | Quadrant properties | ||||||
|---|---|---|---|---|---|---|---|
| Quadrant | DetID | PixID | Counts | Sigma | Mean | Median | Sigma |
| A | 0 | 50 | 490485 | 4604.68 | 520 | 509 | 106.4 |
| A | 14 | 249 | 224835 | 2108.16 | 520 | 509 | 106.4 |
| A | 0 | 31 | 30084 | 277.94 | 520 | 509 | 106.4 |
| B | 14 | 167 | 79063 | 764.89 | 533 | 519 | 102.7 |
| B | 2 | 249 | 46740 | 450.12 | 533 | 519 | 102.7 |
| B | 0 | 219 | 37531 | 360.44 | 533 | 519 | 102.7 |
| C | 0 | 219 | 3058103 | 26769.9 | 484 | 485 | 114.2 |
| C | 1 | 192 | 129671 | 1131.04 | 484 | 485 | 114.2 |
| C | 6 | 80 | 51552 | 447.1 | 484 | 485 | 114.2 |
| D | 13 | 114 | 1603665 | 12715.21 | 508 | 491 | 126.1 |
| D | 2 | 136 | 128567 | 1015.8 | 508 | 491 | 126.1 |
| D | 7 | 80 | 38451 | 301.07 | 508 | 491 | 126.1 |
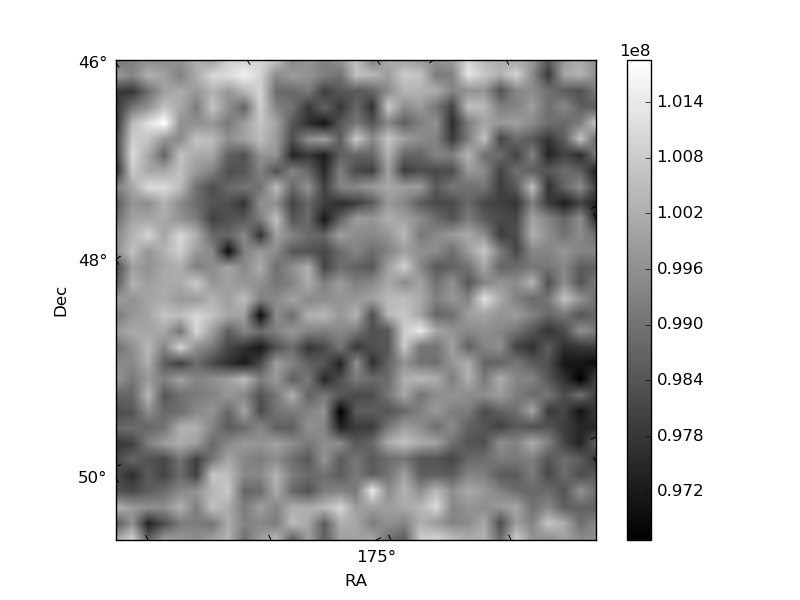
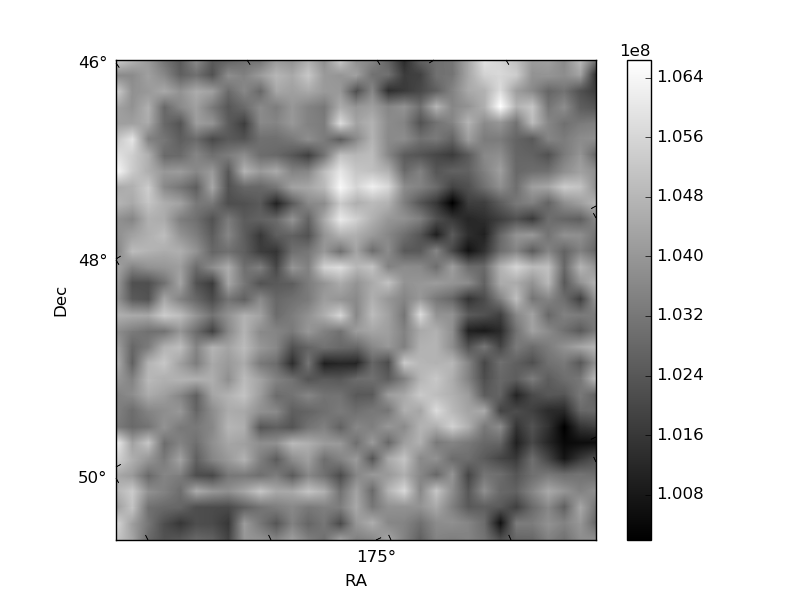
Histogram calculated using DETX and DETY for each event in the final _common_clean file
| Quadrant A | 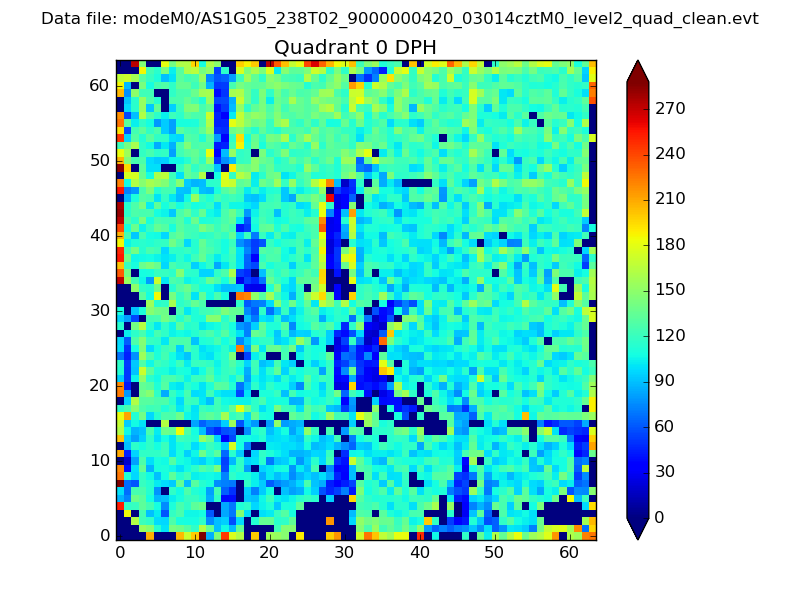 |
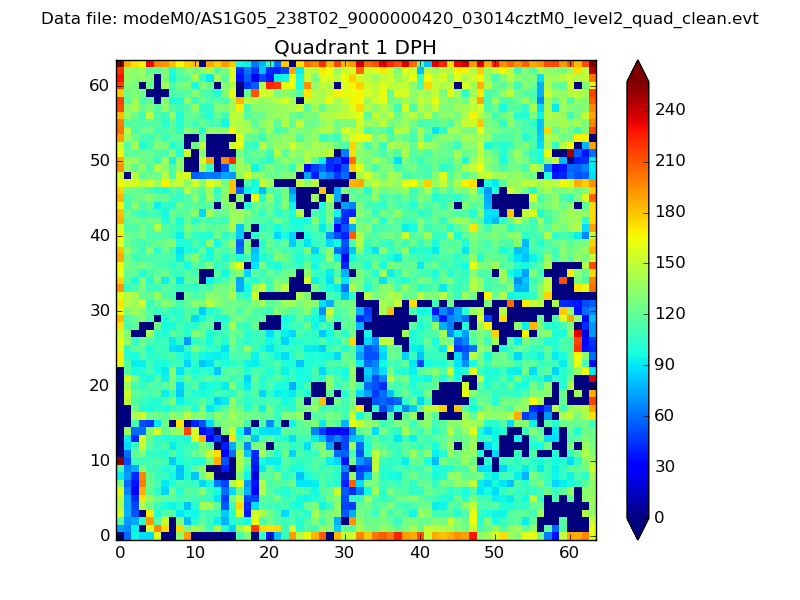 |
Quadrant B |
|---|---|---|---|
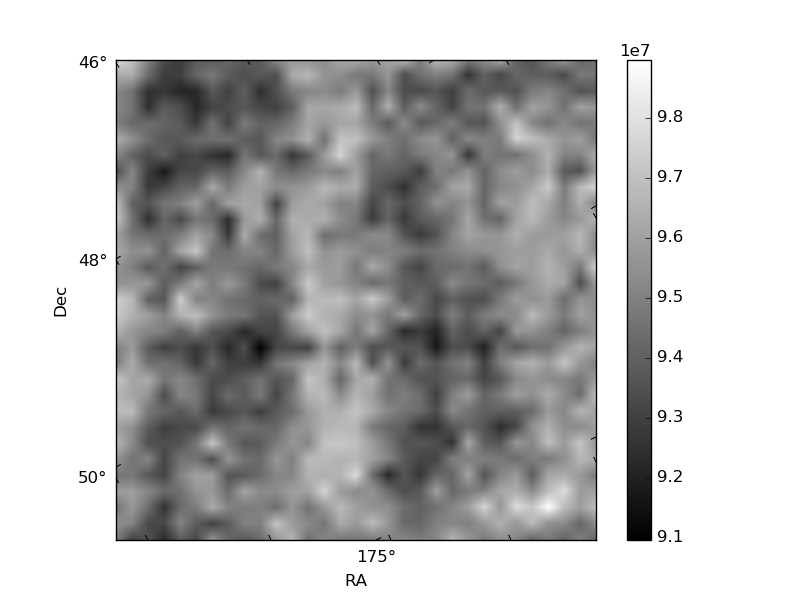
| Quadrant D | 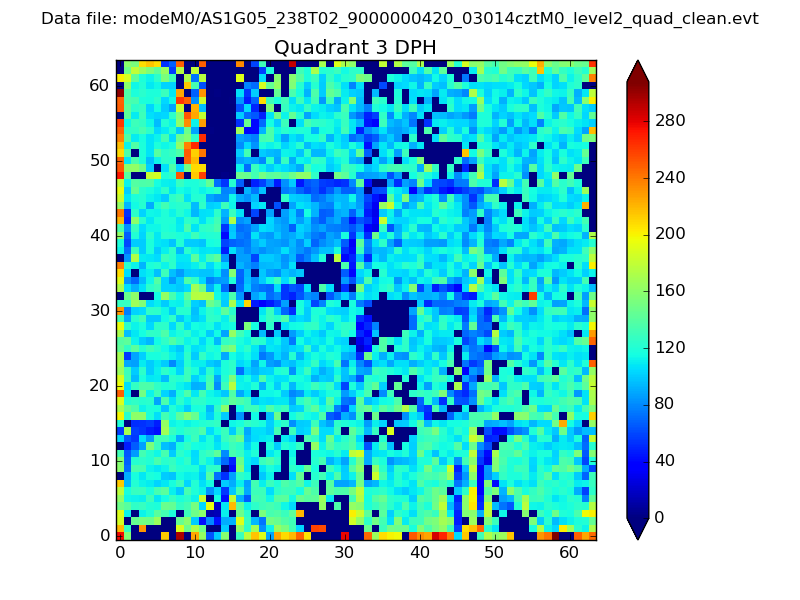 |
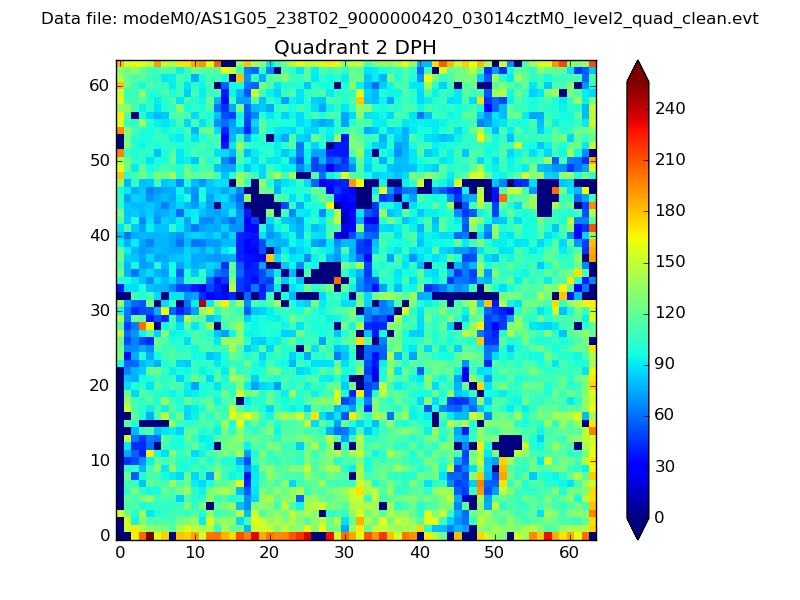 |
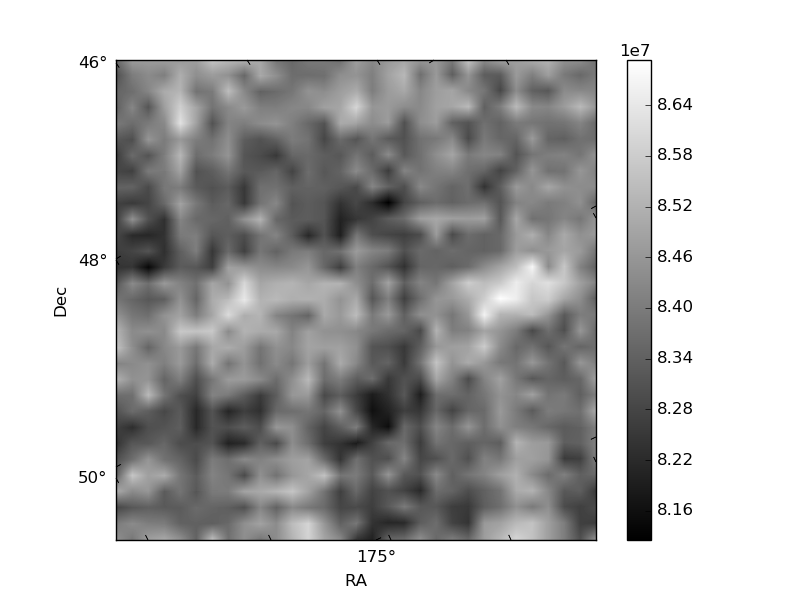
Quadrant C |
| Plot type | Count rate plots | Images |
|---|---|---|
| Comparison with Poisson distribution Blue bars denote a histogram of data divided into 1 sec bins. Red curve is a Poisson curve with rate = median count rate of data. |
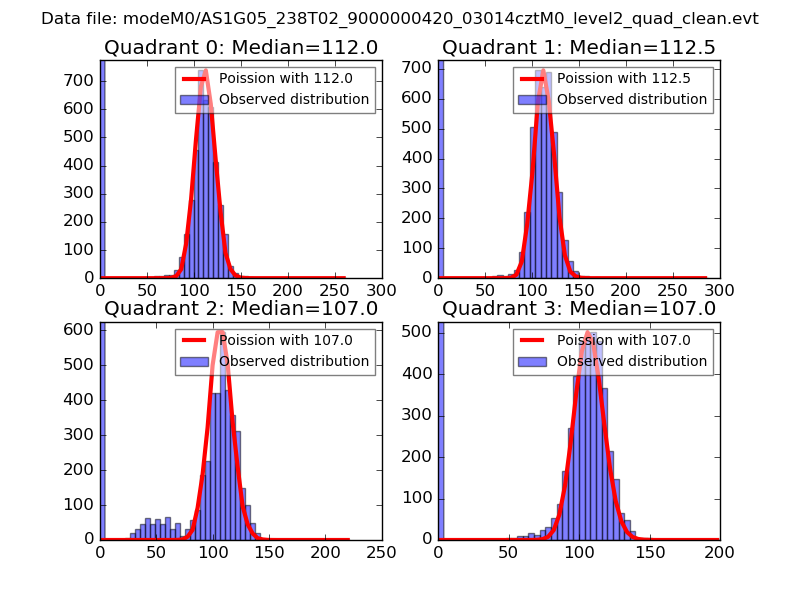 |
 |
| Quadrant-wise count rates Data is divided into 100 sec bins |
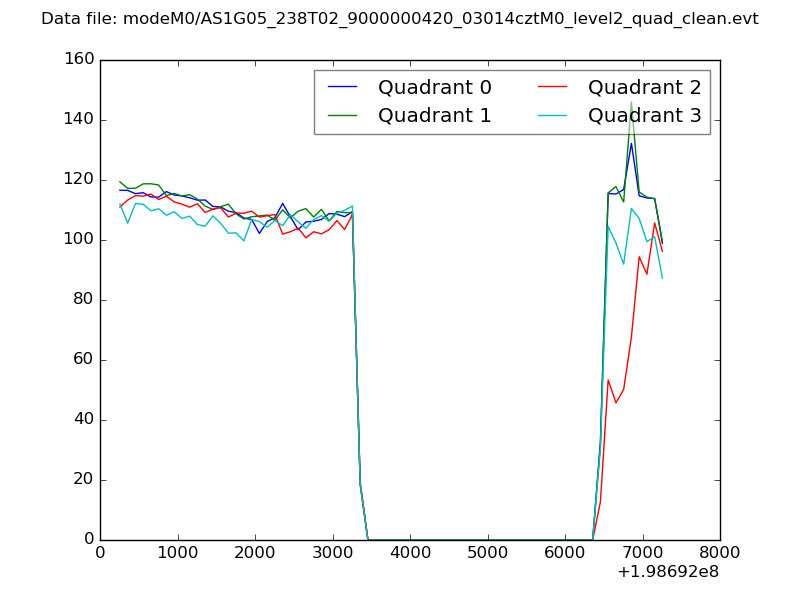 |
|
| Module-wise count rates for Quadrant A Data is divided into 100 sec bins |
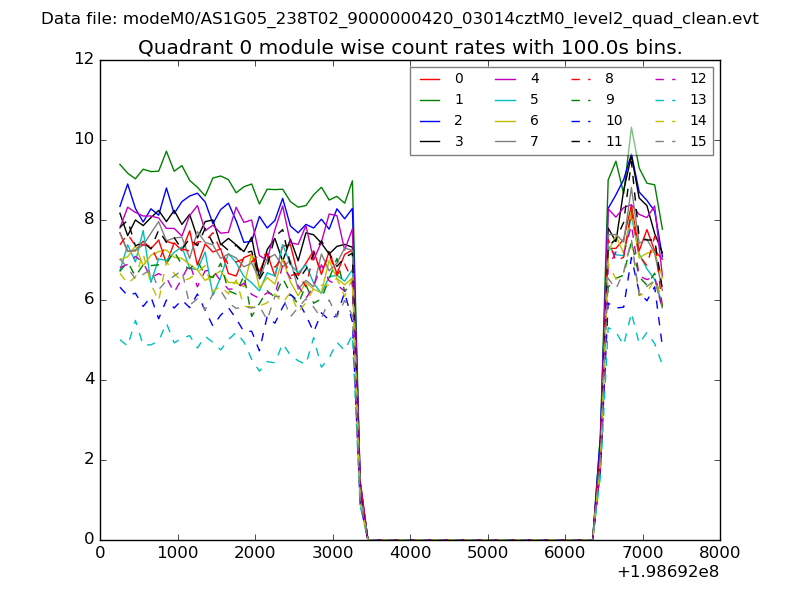 |
 |
| Module-wise count rates for Quadrant B Data is divided into 100 sec bins |
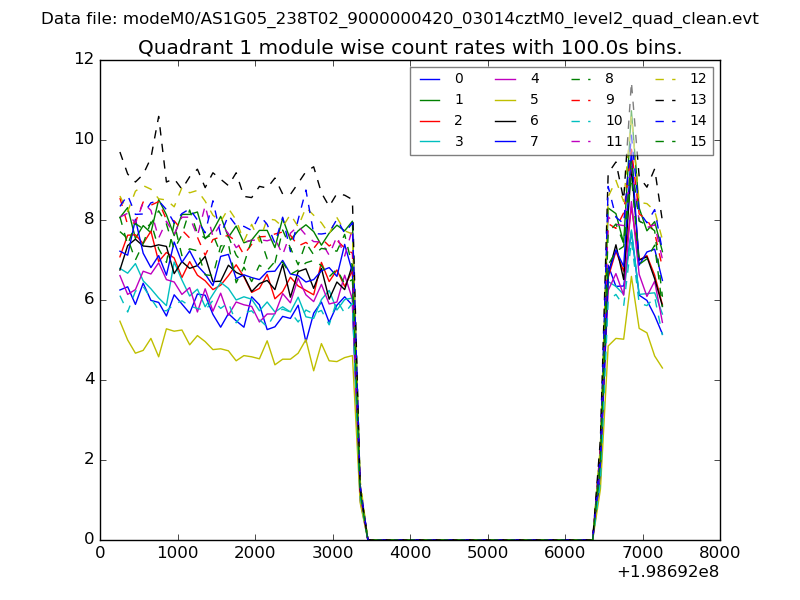 |
 |
| Module-wise count rates for Quadrant C Data is divided into 100 sec bins |
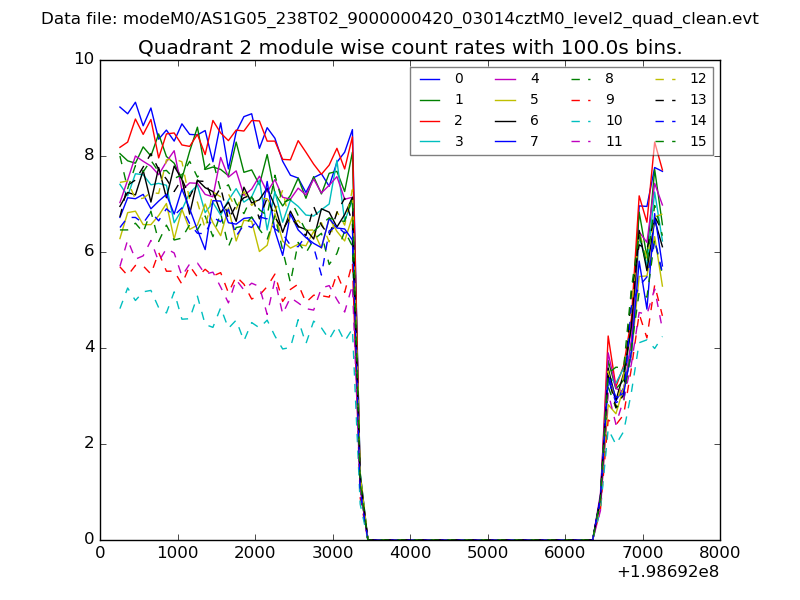 |
 |
| Module-wise count rates for Quadrant D Data is divided into 100 sec bins |
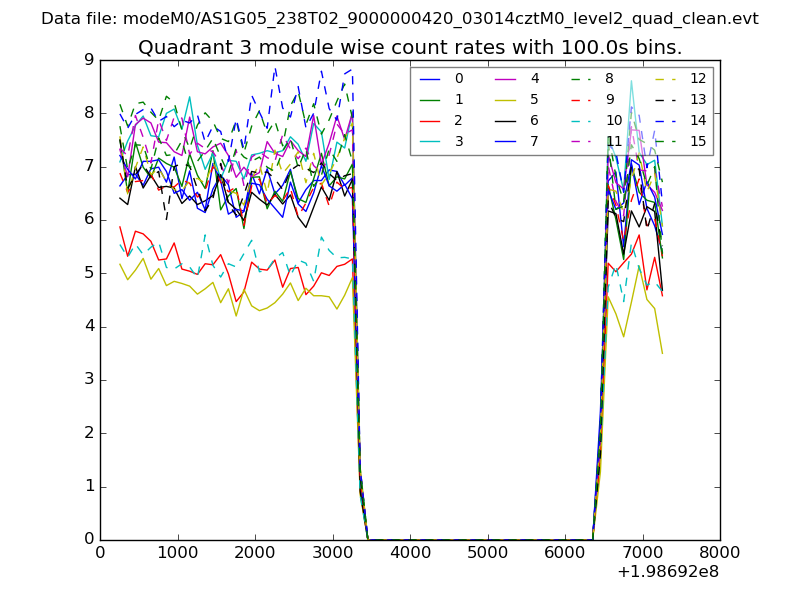 |
 |
| Parameter | Plot |
|---|---|
| CZT HV Monitor | 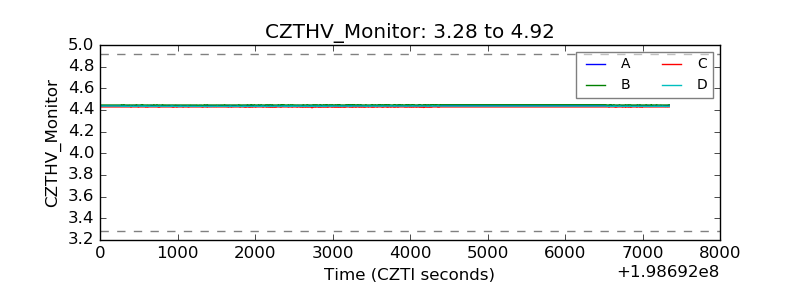 |
| D_VDD | 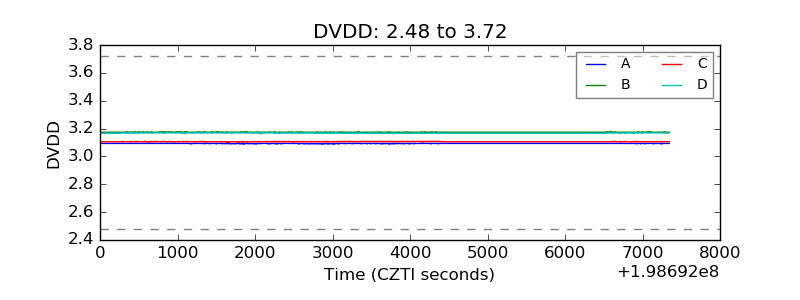 |
| Temperature 1 | 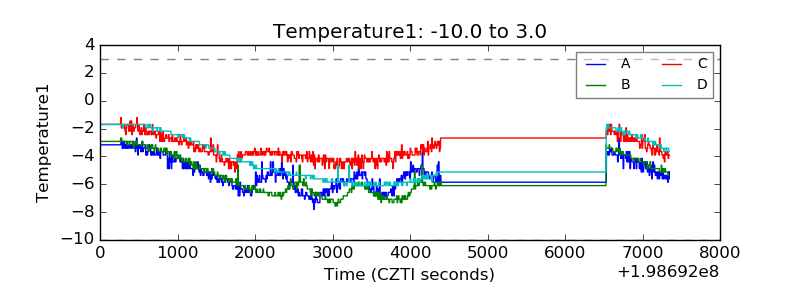 |
| Veto HV Monitor | 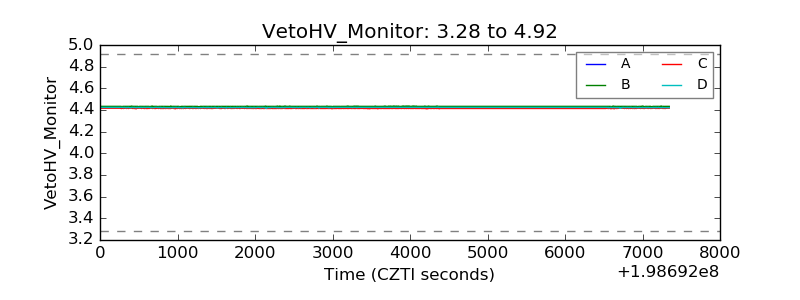 |
| Veto LLD | 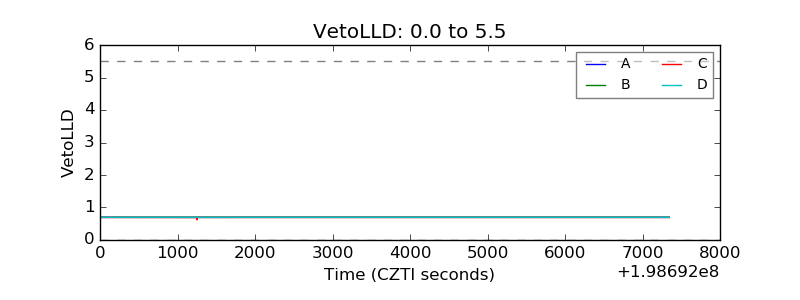 |
| Alpha Counter | 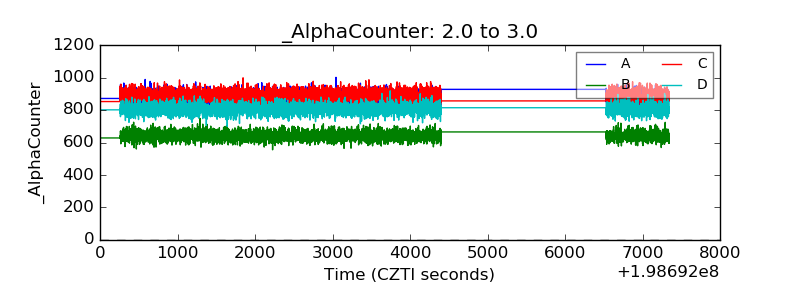 |
| _CPM_Rate | 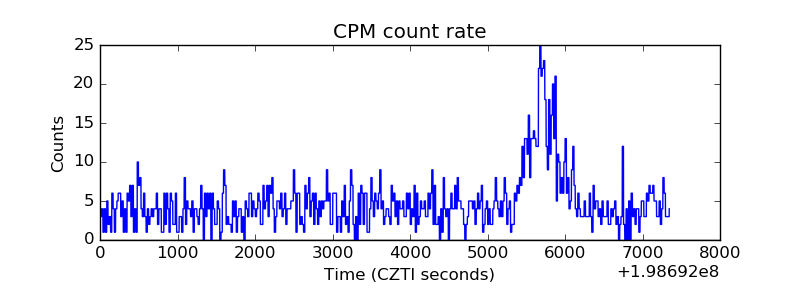 |
| CZT Counter | 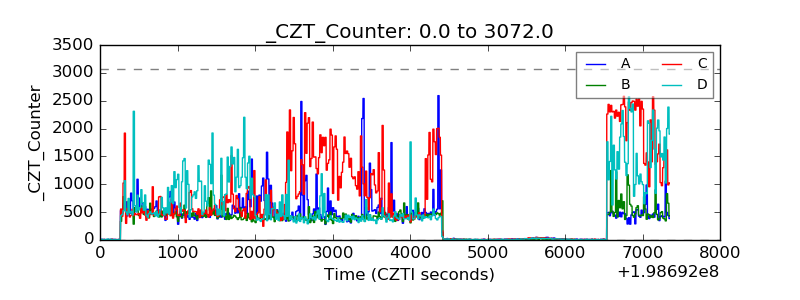 |
| +2.5 Volts monitor | 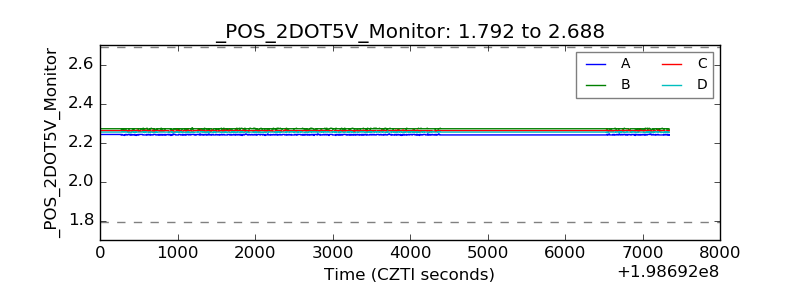 |
| +5 Volts monitor |  |
| _ROLL_ROT | 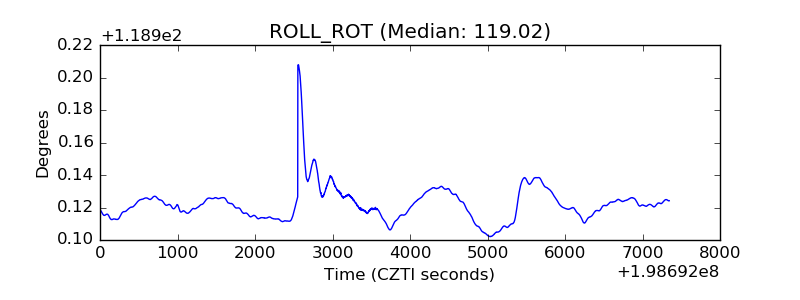 |
| _Roll_DEC | 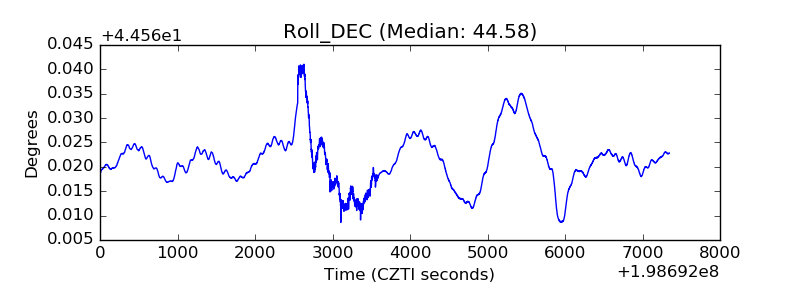 |
| _Roll_RA | 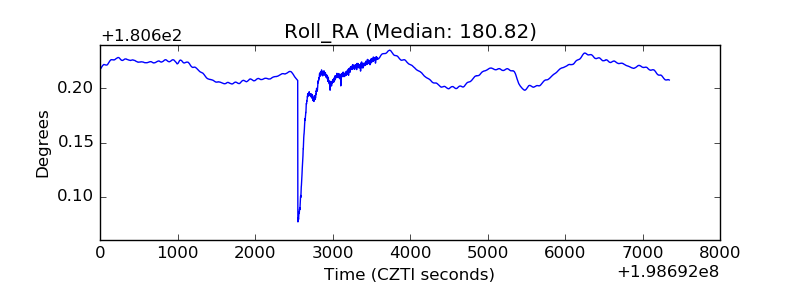 |
| Veto Counter | 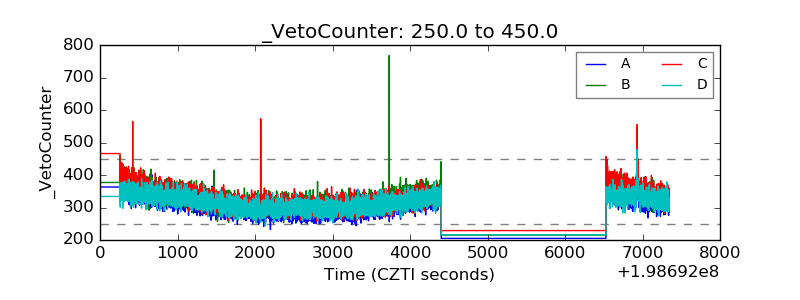 |