| Param | Original file | Final file |
|---|---|---|
| Filename | modeM0/AS1G05_238T02_9000000420_03015cztM0_level2.evt | modeM0/AS1G05_238T02_9000000420_03015cztM0_level2_quad_clean.evt |
| Size (bytes) | 62,902,080 | 13,170,240 |
| Size | 60.0 MB | 12.6 MB |
| Events in quadrant A | 383,228 | 84,125 |
| Events in quadrant B | 543,156 | 82,187 |
| Events in quadrant C | 424,164 | 84,092 |
| Events in quadrant D | 493,596 | 81,414 |
| Mode M0 | |||
|---|---|---|---|
| Quadrant | BADHDUFLAG | Total packets | Discarded packets |
| A | 0 | 1845 | 92 |
| B | 0 | 2286 | 92 |
| C | 0 | 1906 | 50 |
| D | 0 | 2099 | 91 |
| Mode SS | |||
|---|---|---|---|
| Quadrant | BADHDUFLAG | Total packets | Discarded packets |
| A | 0 | 18 | 0 |
| B | 0 | 18 | 0 |
| C | 0 | 18 | 2 |
| D | 0 | 18 | 2 |
| Mode M9 | |||
|---|---|---|---|
| Quadrant | BADHDUFLAG | Total packets | Discarded packets |
| A | 0 | 5 | 0 |
| B | 0 | 5 | 0 |
| C | 0 | 6 | 1 |
| D | 0 | 6 | 1 |
| Quadrant | Total seconds | Saturated seconds | Saturation percentage |
|---|---|---|---|
| A | 847 | 3 | 0.354191% |
| B | 846 | 30 | 3.546099% |
| C | 851 | 5 | 0.587544% |
| D | 846 | 3 | 0.354610% |
Noise dominated data is calculated using 1-second bins in cleaned event files. If a bin has >2000 counts, and if more than 50% of those come from <1% of pixels, then it is considered to be noise-dominated and hence unusable.
| Quadrant | # 1 sec bins | Bins with >0 counts | Bins with >2000 counts | High rate bins dominated by noise | Noise dominated (total time) | Noise dominated (detector-on time) | Marked lightcurve |
|---|---|---|---|---|---|---|---|
| A | 873 | 869 | 3 | 3 | 0.34% | 0.35% | 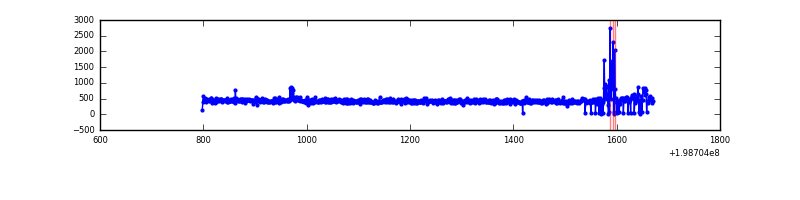 |
| B | 873 | 866 | 28 | 28 | 3.21% | 3.23% | 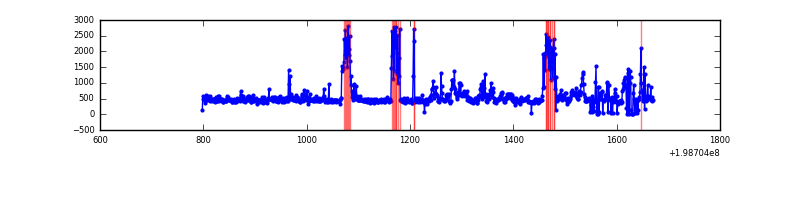 |
| C | 873 | 866 | 4 | 4 | 0.46% | 0.46% | 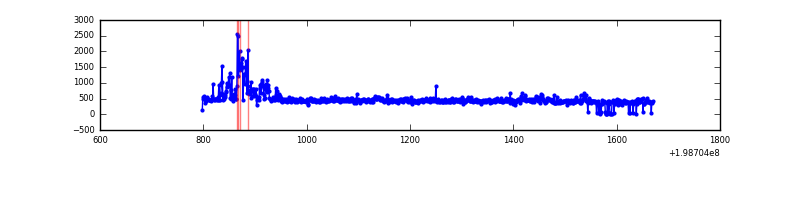 |
| D | 873 | 867 | 1 | 1 | 0.11% | 0.12% | 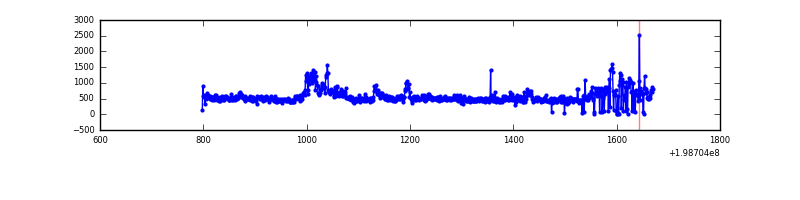 |
Top three noisy pixels from each quadrant. If the there are fewer than three noisy pixels in the level2.evt file, extra rows are filled as -1
| Pixel properties | Quadrant properties | ||||||
|---|---|---|---|---|---|---|---|
| Quadrant | DetID | PixID | Counts | Sigma | Mean | Median | Sigma |
| A | 14 | 249 | 18592 | 898.38 | 89 | 87 | 20.6 |
| A | 0 | 50 | 10182 | 490.09 | 89 | 87 | 20.6 |
| A | 13 | 14 | 3647 | 172.83 | 89 | 87 | 20.6 |
| B | 6 | 203 | 83774 | 4293.39 | 91 | 88 | 19.5 |
| B | 14 | 167 | 72834 | 3732.13 | 91 | 88 | 19.5 |
| B | 2 | 249 | 16467 | 840.3 | 91 | 88 | 19.5 |
| C | 1 | 192 | 44926 | 1930.58 | 91 | 91 | 23.2 |
| C | 6 | 80 | 14533 | 621.87 | 91 | 91 | 23.2 |
| C | 14 | 67 | 2334 | 96.58 | 91 | 91 | 23.2 |
| D | 13 | 114 | 132007 | 5392.38 | 90 | 87 | 24.5 |
| D | 2 | 209 | 8613 | 348.51 | 90 | 87 | 24.5 |
| D | 7 | 80 | 4656 | 186.76 | 90 | 87 | 24.5 |
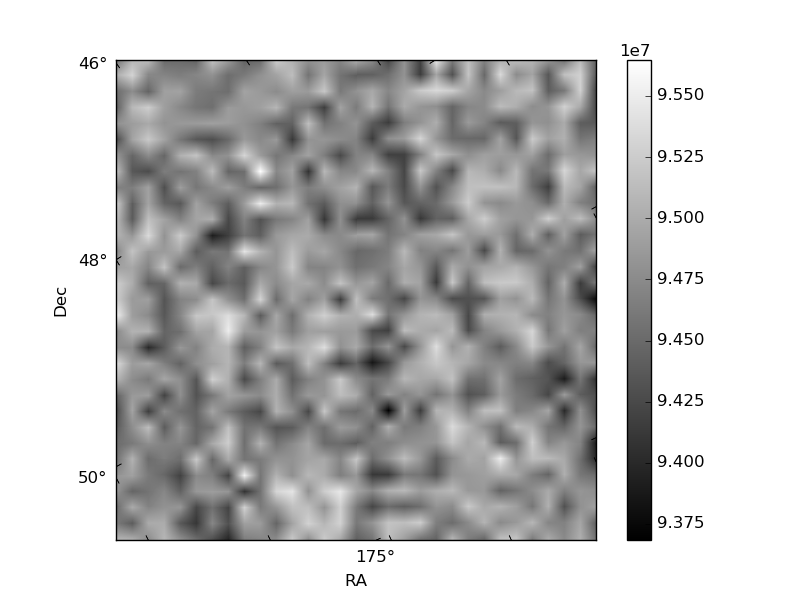
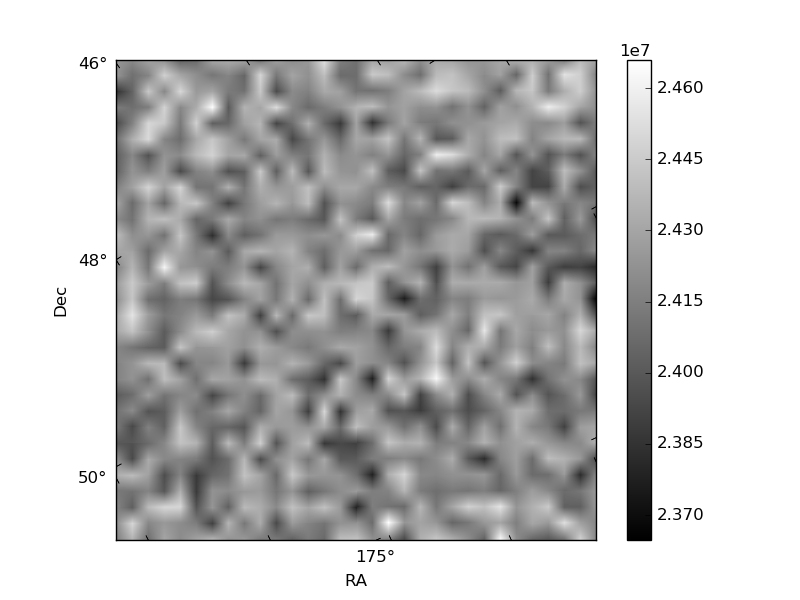
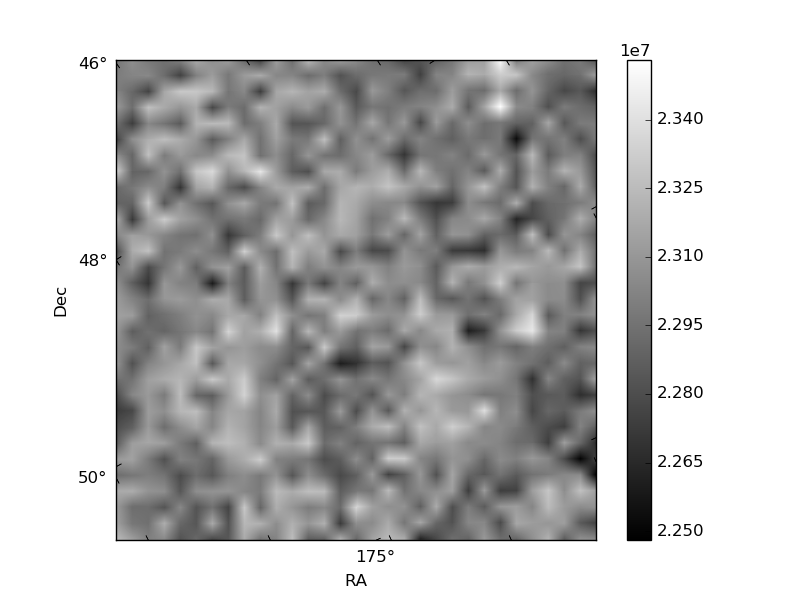
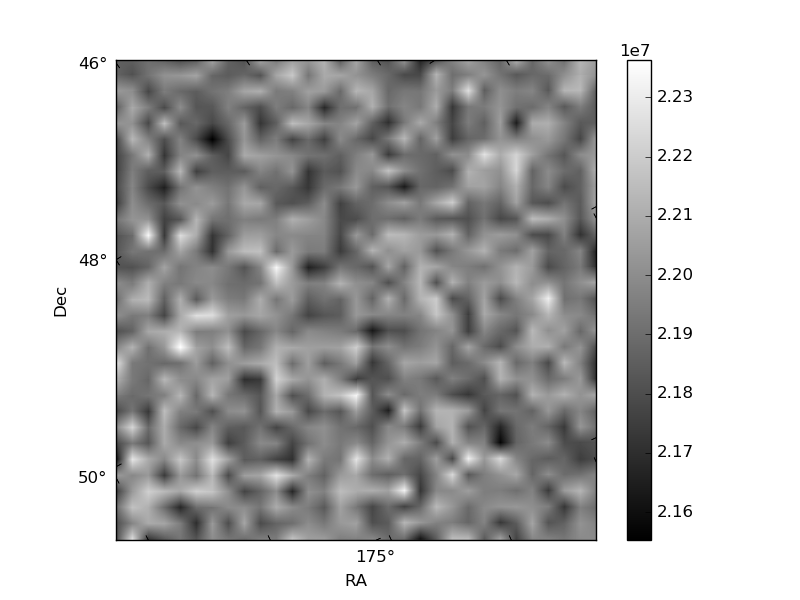
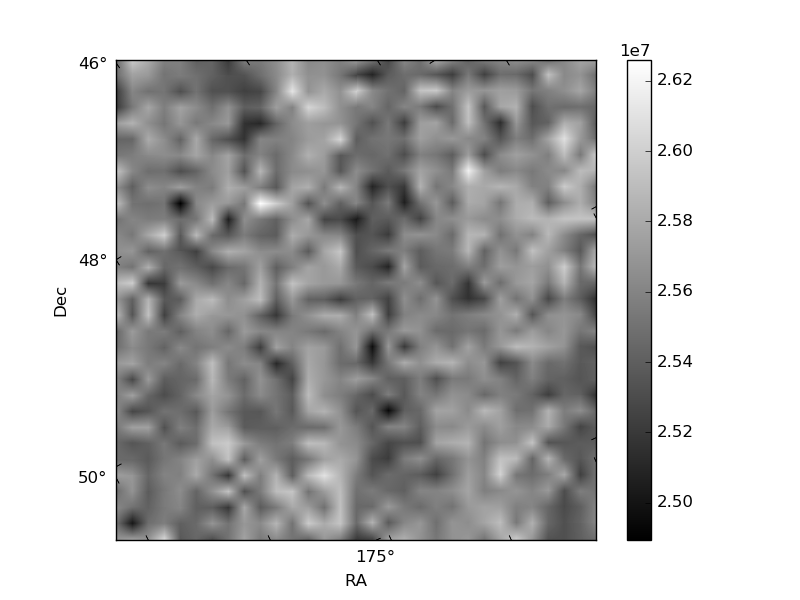
Histogram calculated using DETX and DETY for each event in the final _common_clean file
| Quadrant A | 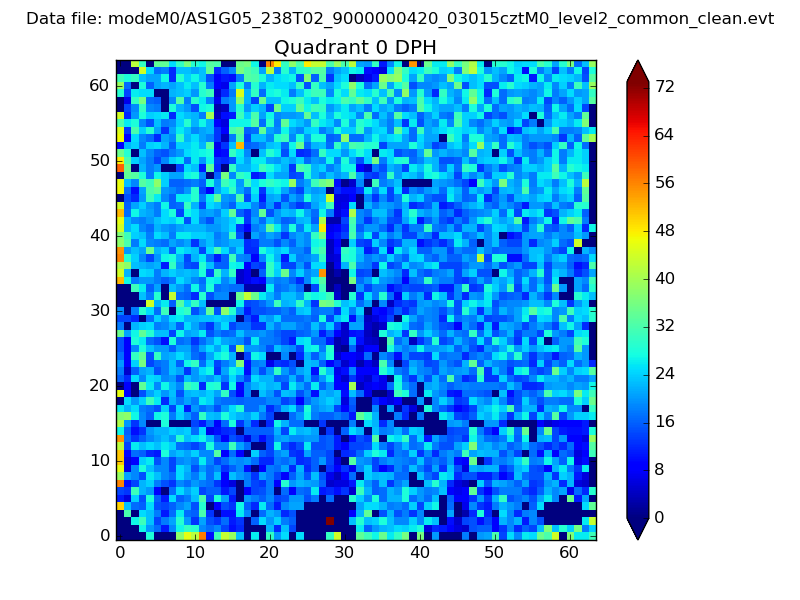 |
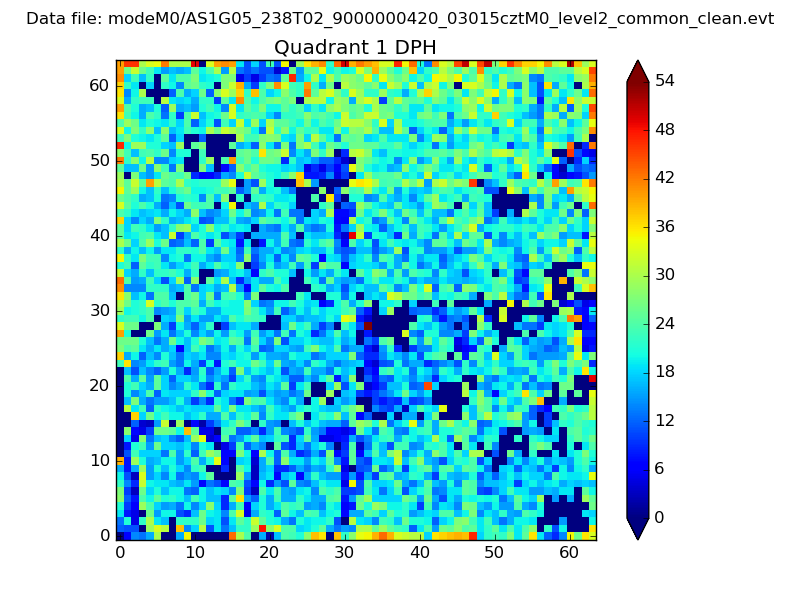 |
Quadrant B |
|---|---|---|---|
| Quadrant D | 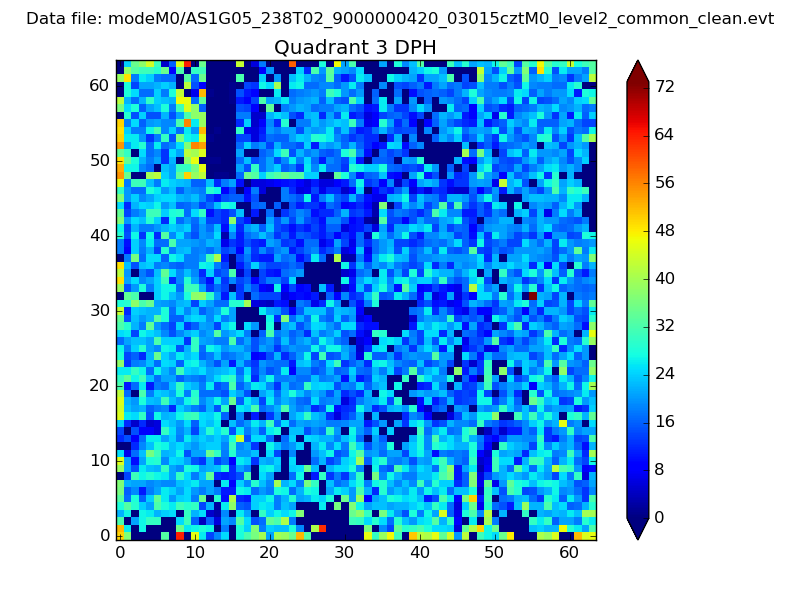 |
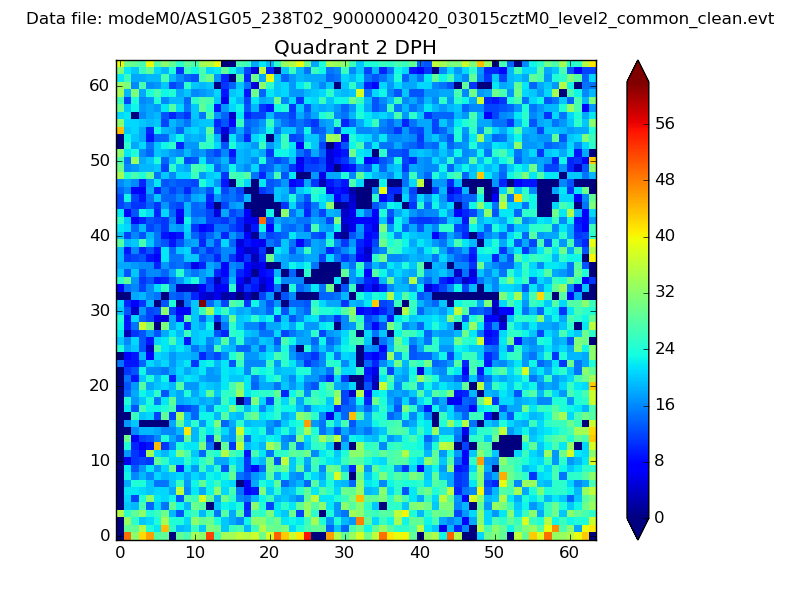 |
Quadrant C |
| Plot type | Count rate plots | Images |
|---|---|---|
| Comparison with Poisson distribution Blue bars denote a histogram of data divided into 1 sec bins. Red curve is a Poisson curve with rate = median count rate of data. |
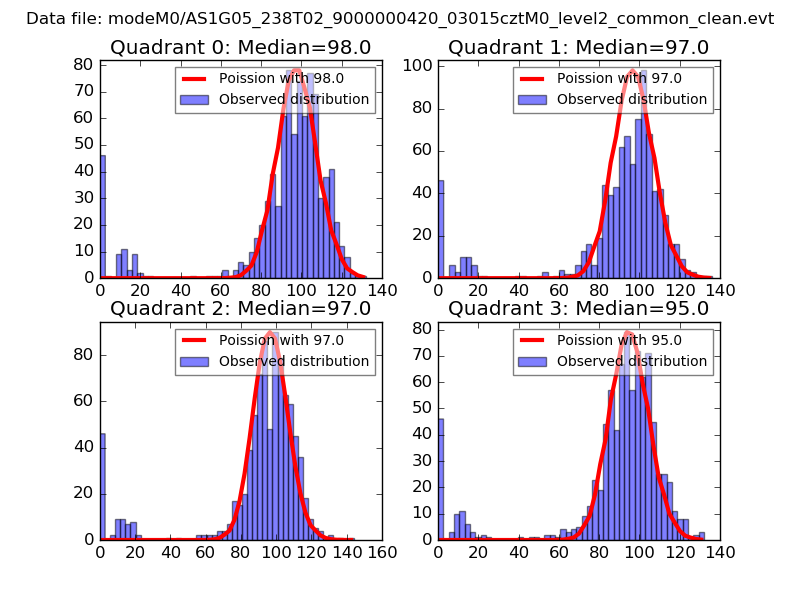 |
 |
| Quadrant-wise count rates Data is divided into 100 sec bins |
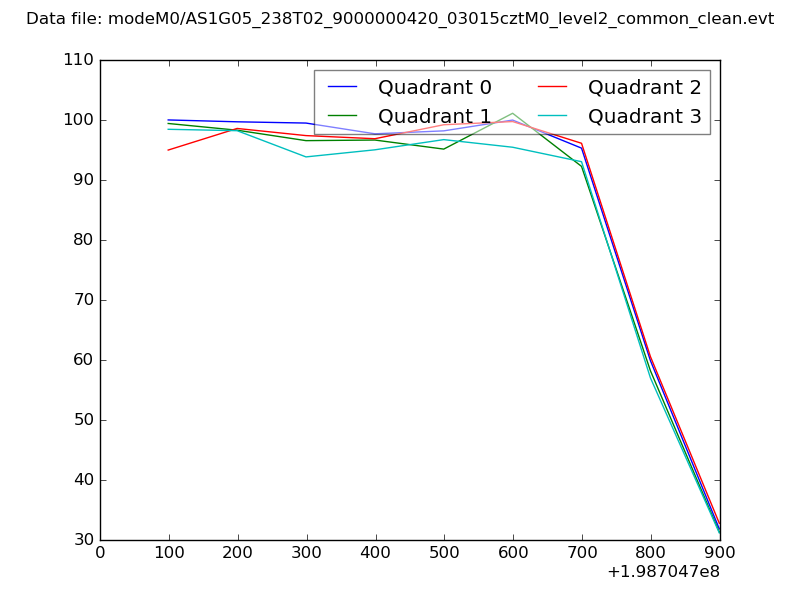 |
|
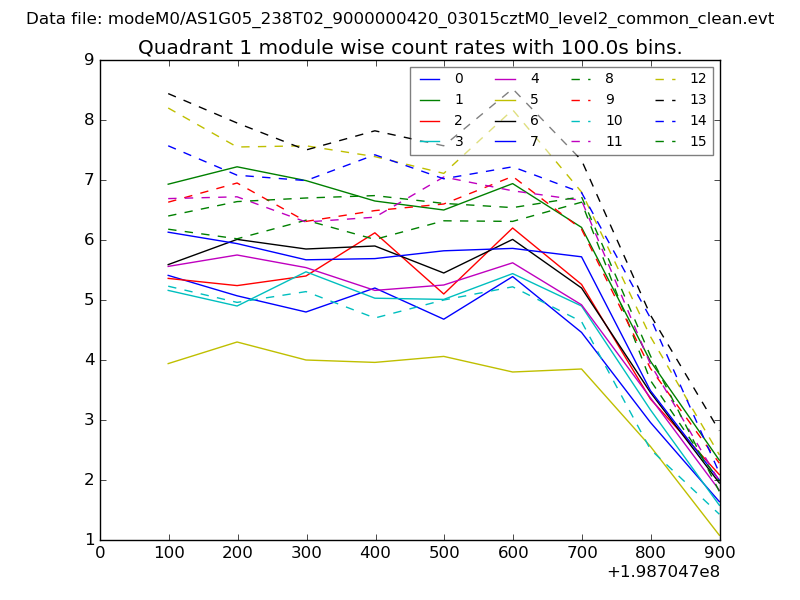
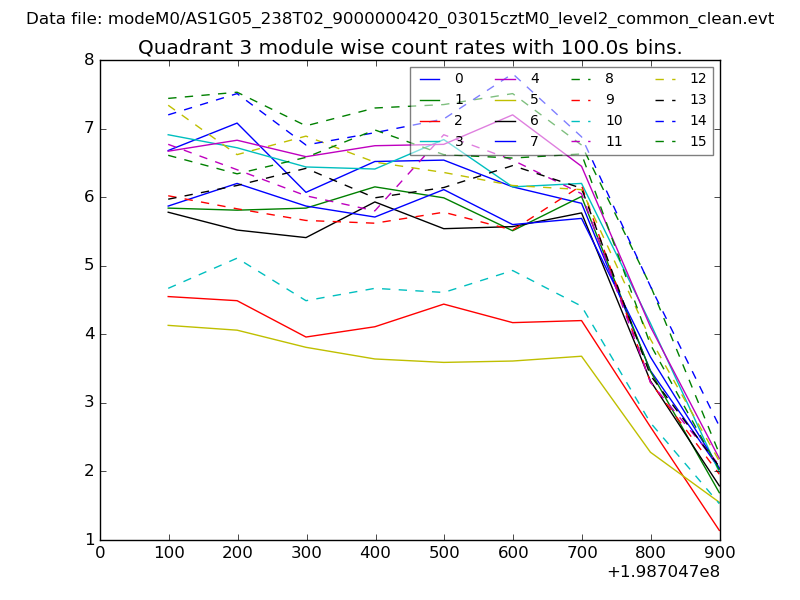
| Module-wise count rates for Quadrant A Data is divided into 100 sec bins |
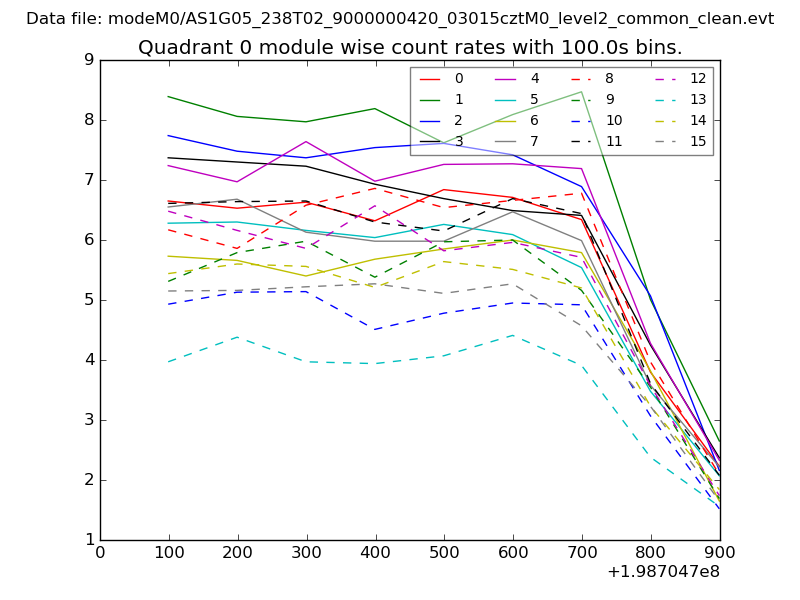 |
 |
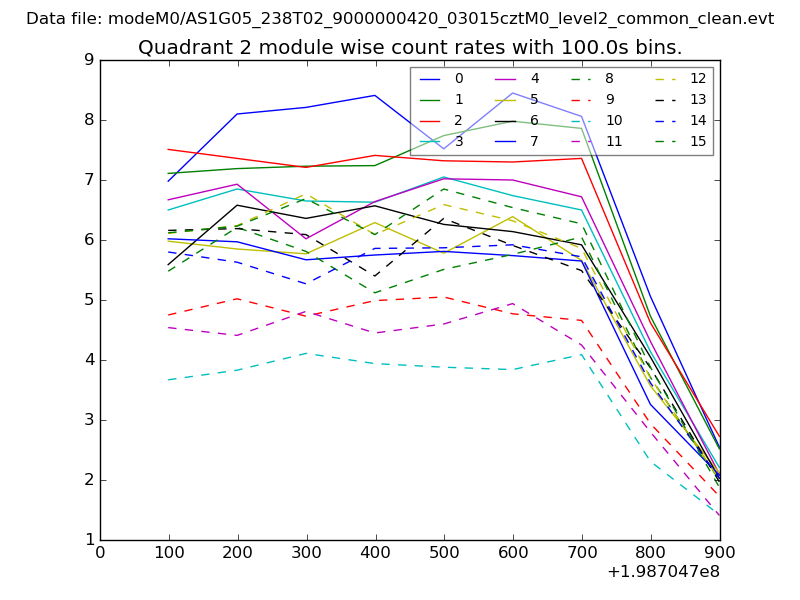
| Module-wise count rates for Quadrant B Data is divided into 100 sec bins |
 |
 |
| Module-wise count rates for Quadrant C Data is divided into 100 sec bins |
 |
 |
| Module-wise count rates for Quadrant D Data is divided into 100 sec bins |
 |
 |
| Parameter | Plot |
|---|---|
| CZT HV Monitor | 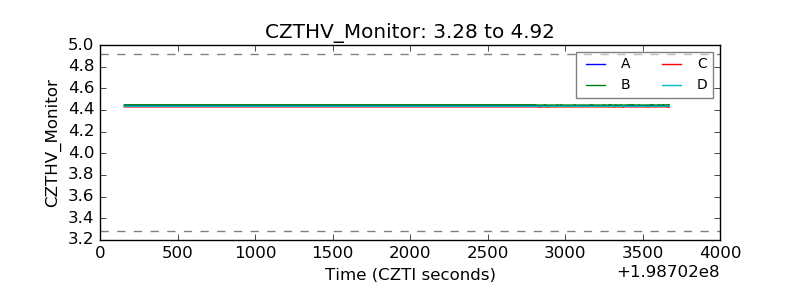 |
| D_VDD | 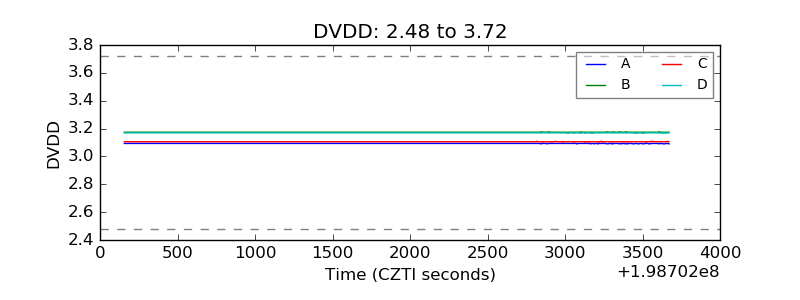 |
| Temperature 1 | 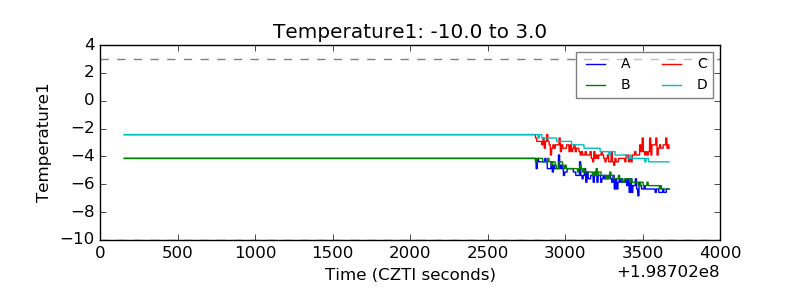 |
| Veto HV Monitor | 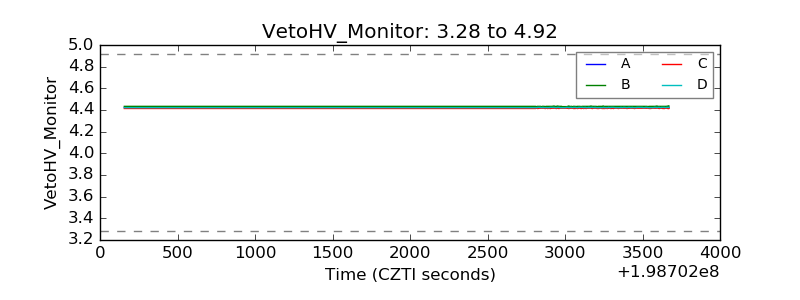 |
| Veto LLD | 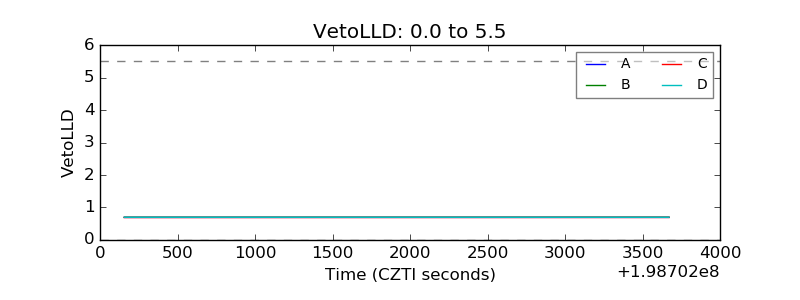 |
| Alpha Counter | 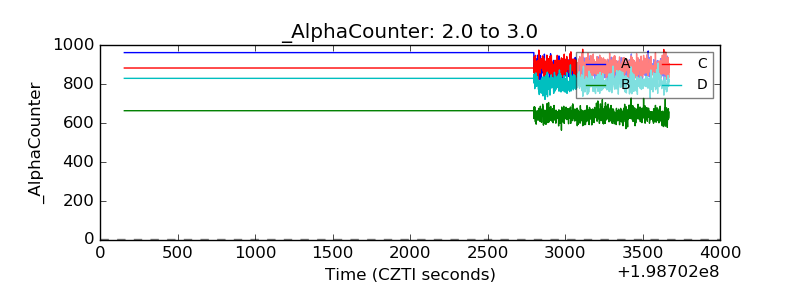 |
| _CPM_Rate | 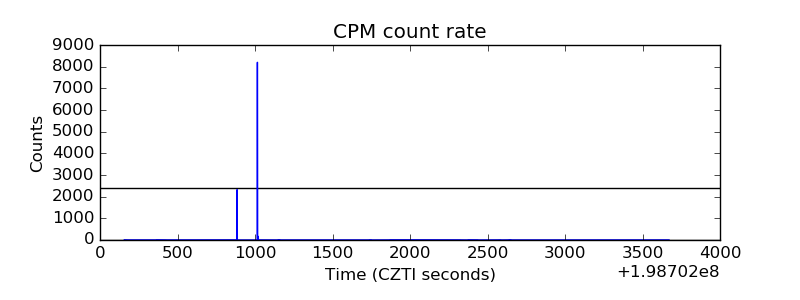 |
| CZT Counter | 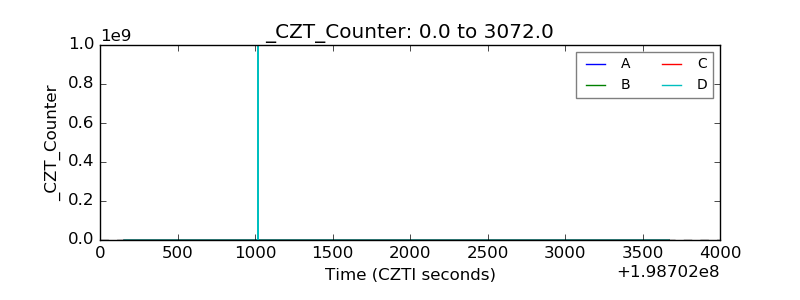 |
| +2.5 Volts monitor |  |
| +5 Volts monitor |  |
| Veto Counter |  |