| Param | Original file | Final file |
|---|---|---|
| Filename | modeM0/AS1G05_238T02_9000000420_03016cztM0_level2.evt | modeM0/AS1G05_238T02_9000000420_03016cztM0_level2_quad_clean.evt |
| Size (bytes) | 594,973,440 | 86,616,000 |
| Size | 567.4 MB | 82.6 MB |
| Events in quadrant A | 3,863,687 | 510,054 |
| Events in quadrant B | 4,154,504 | 505,508 |
| Events in quadrant C | 4,429,530 | 508,684 |
| Events in quadrant D | 4,984,740 | 498,119 |
| Mode M0 | |||
|---|---|---|---|
| Quadrant | BADHDUFLAG | Total packets | Discarded packets |
| A | 0 | 17887 | 3 |
| B | 0 | 18801 | 2 |
| C | 0 | 19806 | 2 |
| D | 0 | 21607 | 2 |
| Mode SS | |||
|---|---|---|---|
| Quadrant | BADHDUFLAG | Total packets | Discarded packets |
| A | 0 | 178 | 0 |
| B | 0 | 178 | 0 |
| C | 0 | 178 | 0 |
| D | 0 | 178 | 0 |
| Mode M9 | |||
|---|---|---|---|
| Quadrant | BADHDUFLAG | Total packets | Discarded packets |
| A | 0 | 42 | 0 |
| B | 0 | 42 | 0 |
| C | 0 | 42 | 0 |
| D | 0 | 42 | 0 |
| Quadrant | Total seconds | Saturated seconds | Saturation percentage |
|---|---|---|---|
| A | 8642 | 22 | 0.254571% |
| B | 8642 | 56 | 0.647998% |
| C | 8642 | 22 | 0.254571% |
| D | 8642 | 172 | 1.990280% |
Noise dominated data is calculated using 1-second bins in cleaned event files. If a bin has >2000 counts, and if more than 50% of those come from <1% of pixels, then it is considered to be noise-dominated and hence unusable.
| Quadrant | # 1 sec bins | Bins with >0 counts | Bins with >2000 counts | High rate bins dominated by noise | Noise dominated (total time) | Noise dominated (detector-on time) | Marked lightcurve |
|---|---|---|---|---|---|---|---|
| A | 12894 | 8644 | 22 | 22 | 0.17% | 0.25% | 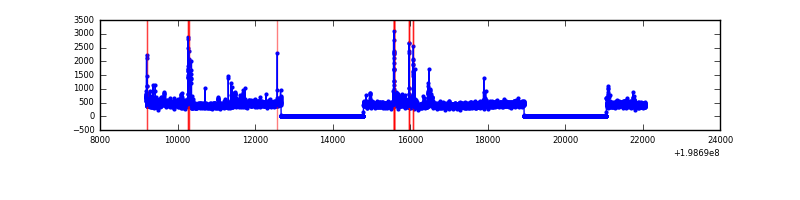 |
| B | 12894 | 8644 | 50 | 50 | 0.39% | 0.58% | 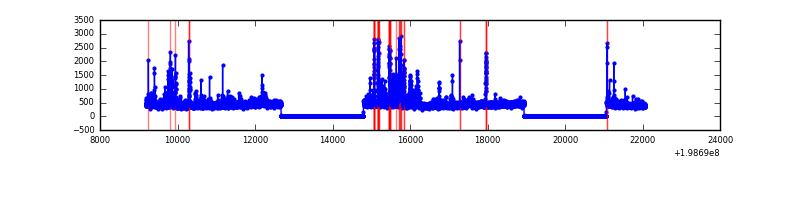 |
| C | 12894 | 8644 | 20 | 20 | 0.16% | 0.23% | 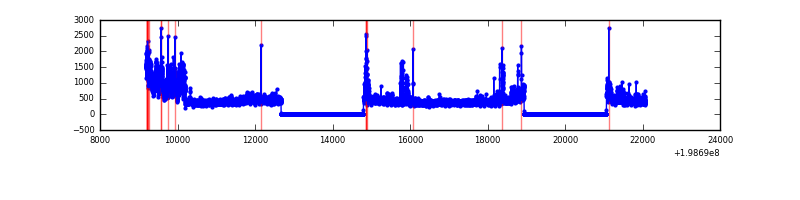 |
| D | 12894 | 8644 | 249 | 249 | 1.93% | 2.88% | 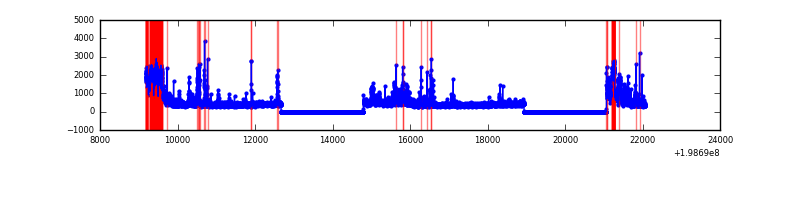 |
Top three noisy pixels from each quadrant. If the there are fewer than three noisy pixels in the level2.evt file, extra rows are filled as -1
| Pixel properties | Quadrant properties | ||||||
|---|---|---|---|---|---|---|---|
| Quadrant | DetID | PixID | Counts | Sigma | Mean | Median | Sigma |
| A | 0 | 50 | 222351 | 1253.68 | 879 | 862 | 176.7 |
| A | 14 | 249 | 197663 | 1113.94 | 879 | 862 | 176.7 |
| A | 13 | 251 | 21363 | 116.04 | 879 | 862 | 176.7 |
| B | 14 | 167 | 387679 | 2229.42 | 901 | 879 | 173.5 |
| B | 6 | 203 | 125927 | 720.75 | 901 | 879 | 173.5 |
| B | 2 | 249 | 58300 | 330.96 | 901 | 879 | 173.5 |
| C | 0 | 219 | 736462 | 3625.69 | 867 | 873 | 202.9 |
| C | 1 | 192 | 178458 | 875.31 | 867 | 873 | 202.9 |
| C | 6 | 80 | 84270 | 411.06 | 867 | 873 | 202.9 |
| D | 13 | 114 | 1386502 | 6020.73 | 848 | 829 | 230.2 |
| D | 2 | 152 | 80842 | 347.66 | 848 | 829 | 230.2 |
| D | 13 | 239 | 55362 | 236.94 | 848 | 829 | 230.2 |
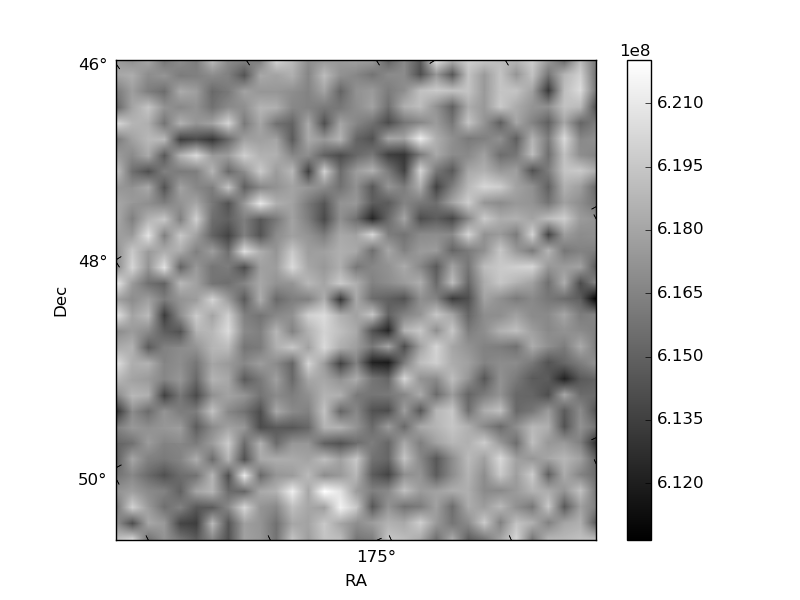
Histogram calculated using DETX and DETY for each event in the final _common_clean file
| Quadrant A | 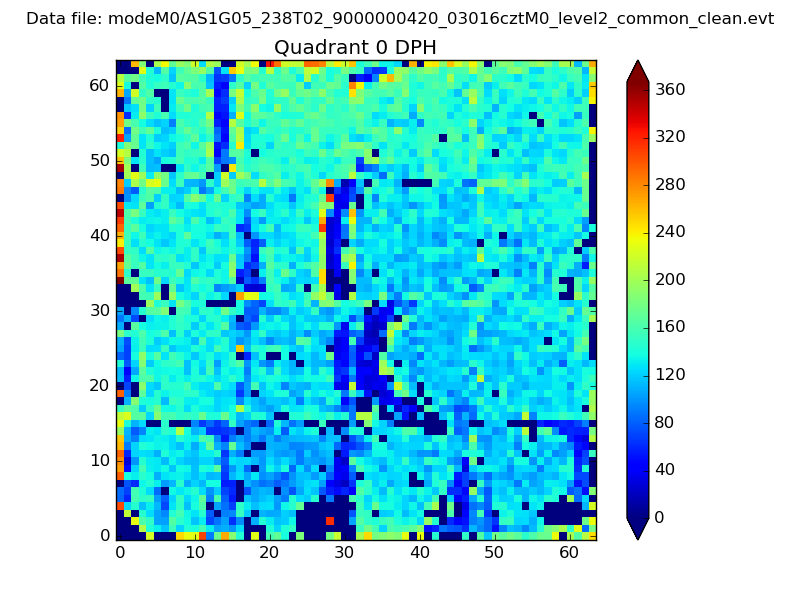 |
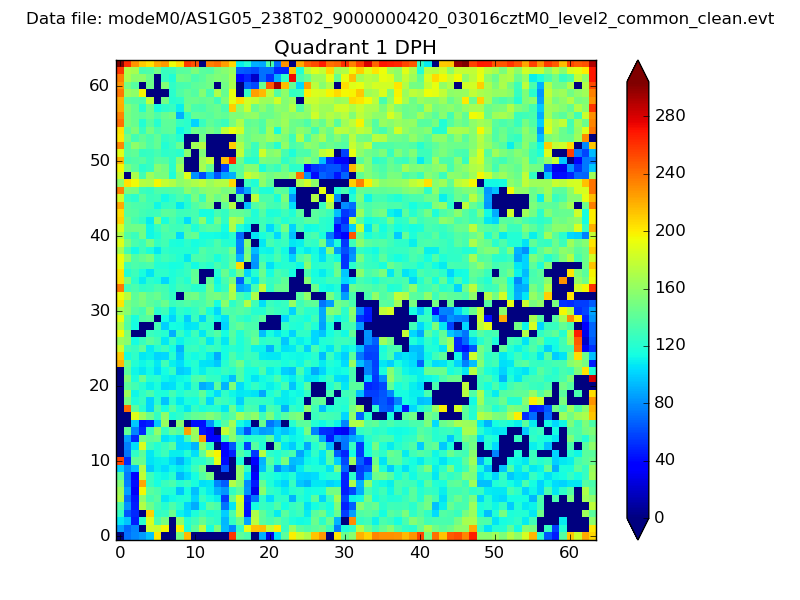 |
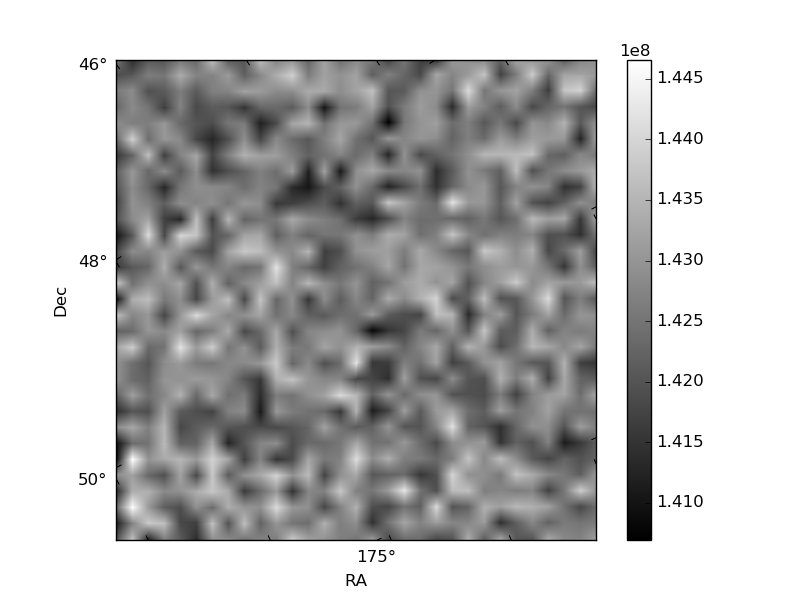
Quadrant B |
|---|---|---|---|
| Quadrant D |  |
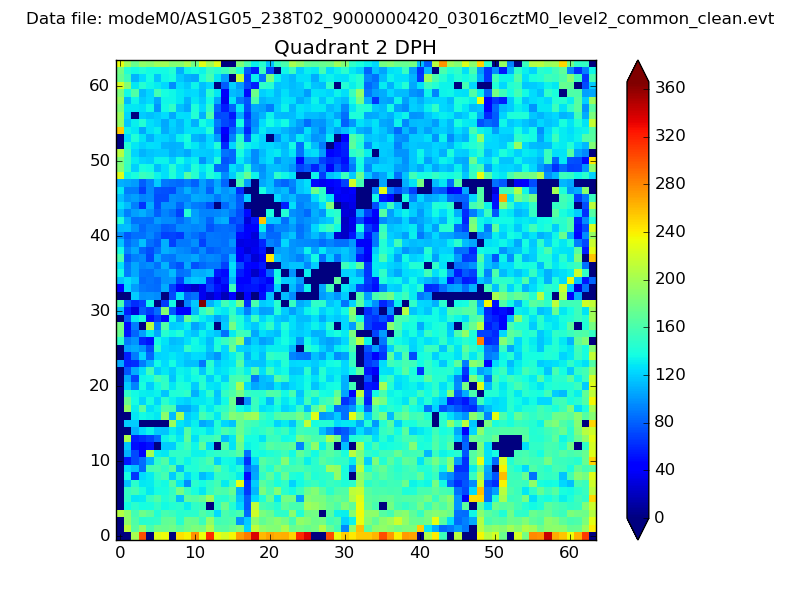 |
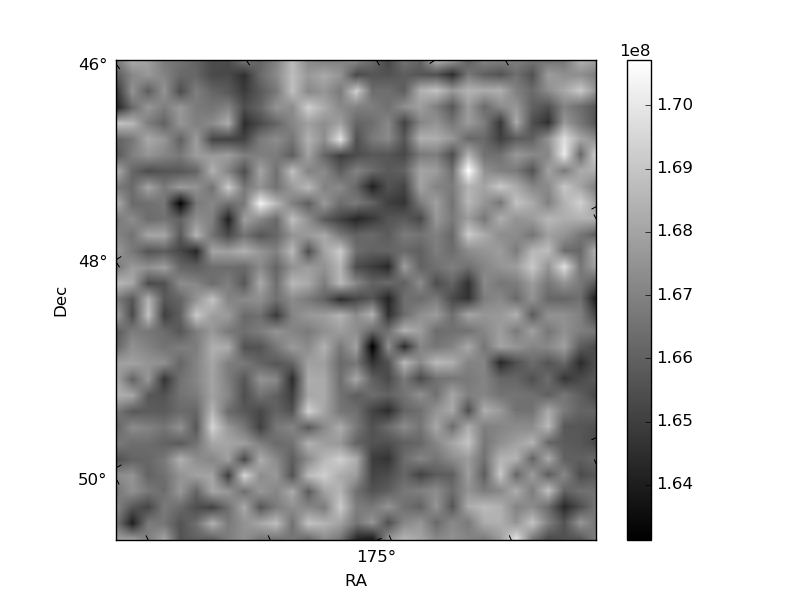
Quadrant C |
| Plot type | Count rate plots | Images |
|---|---|---|
| Comparison with Poisson distribution Blue bars denote a histogram of data divided into 1 sec bins. Red curve is a Poisson curve with rate = median count rate of data. |
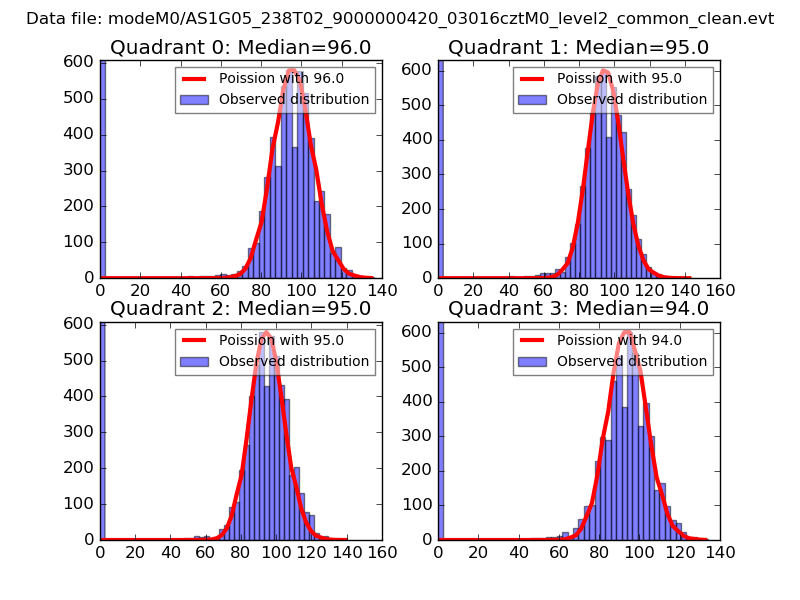 |
 |
| Quadrant-wise count rates Data is divided into 100 sec bins |
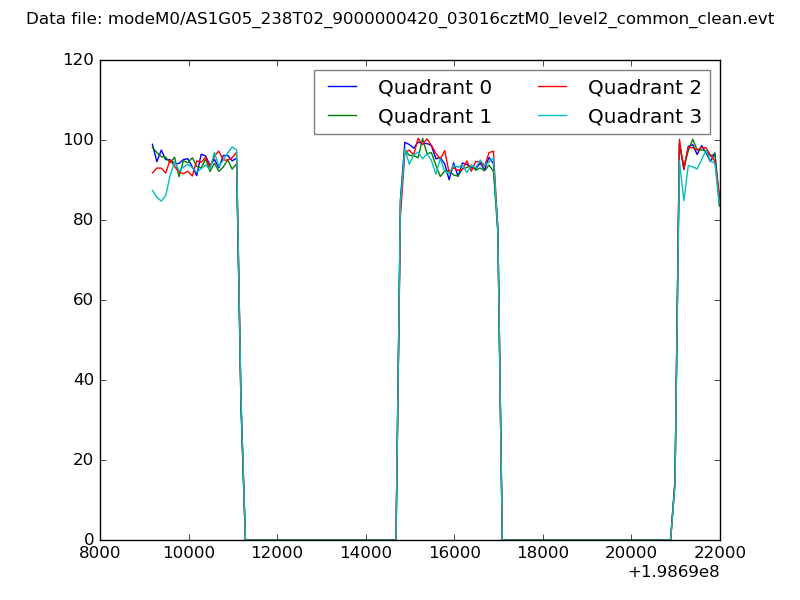 |
|
| Module-wise count rates for Quadrant A Data is divided into 100 sec bins |
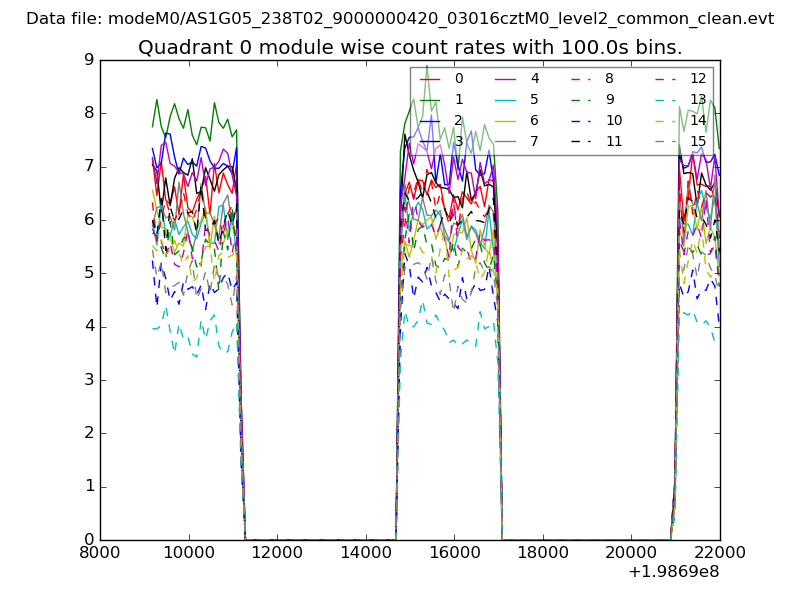 |
 |
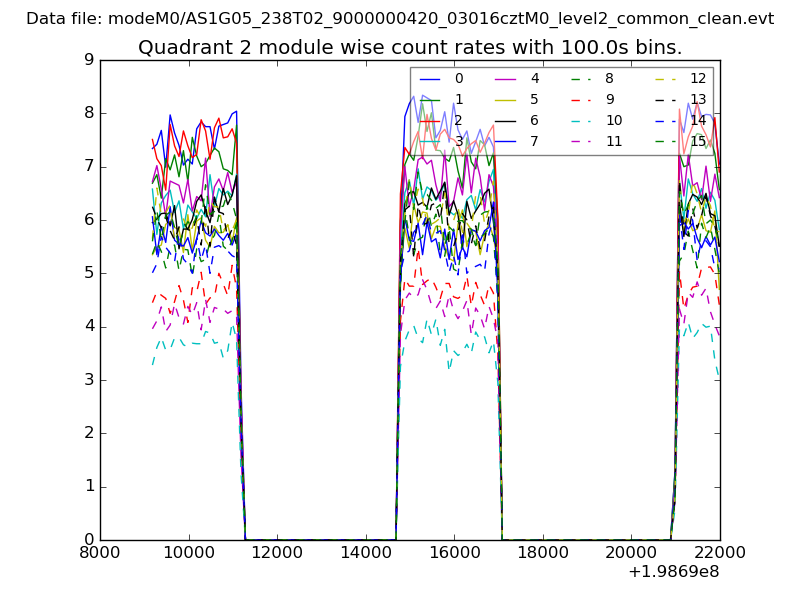
| Module-wise count rates for Quadrant B Data is divided into 100 sec bins |
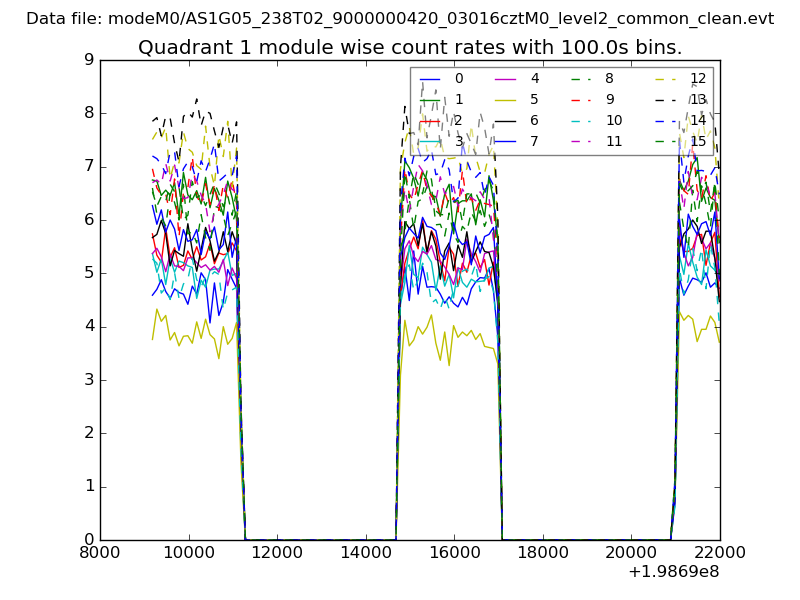 |
 |
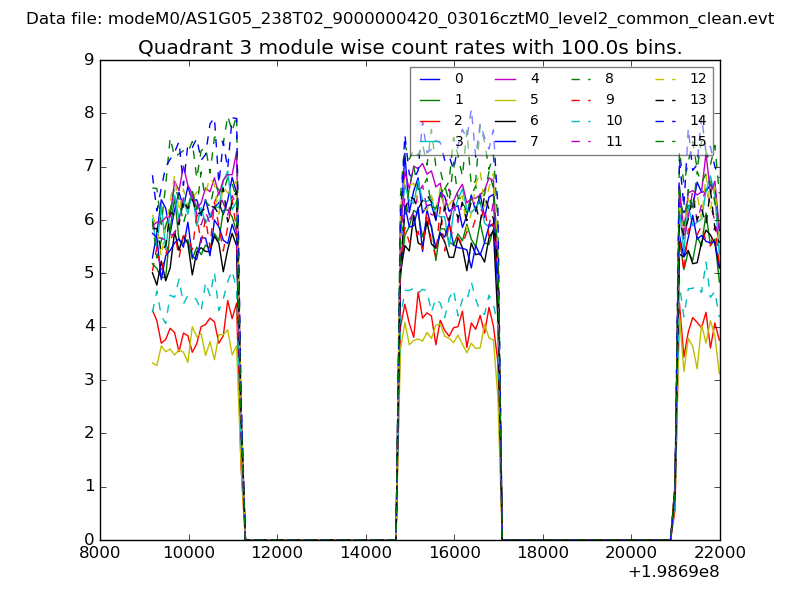
| Module-wise count rates for Quadrant C Data is divided into 100 sec bins |
 |
 |
| Module-wise count rates for Quadrant D Data is divided into 100 sec bins |
 |
 |
| Parameter | Plot |
|---|---|
| CZT HV Monitor | 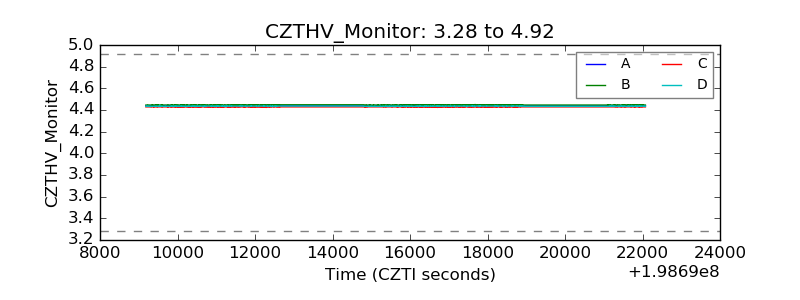 |
| D_VDD | 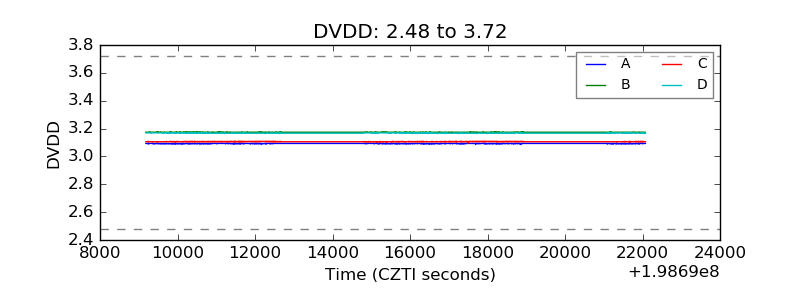 |
| Temperature 1 | 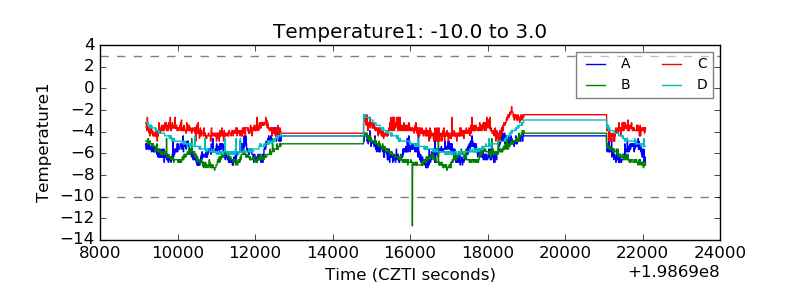 |
| Veto HV Monitor | 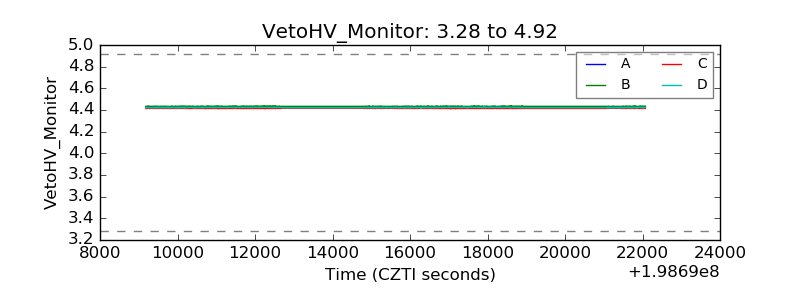 |
| Veto LLD | 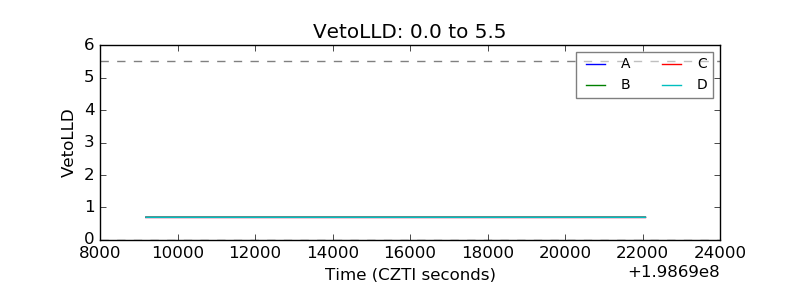 |
| Alpha Counter | 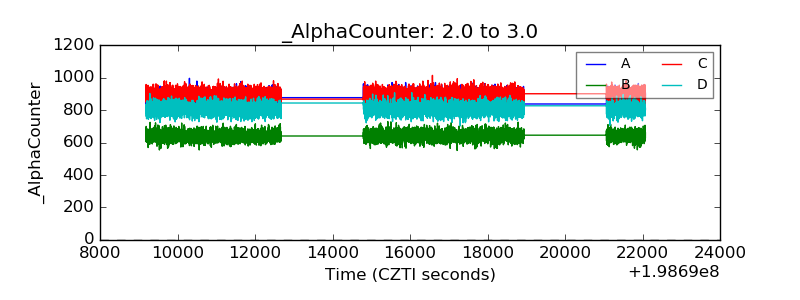 |
| _CPM_Rate | 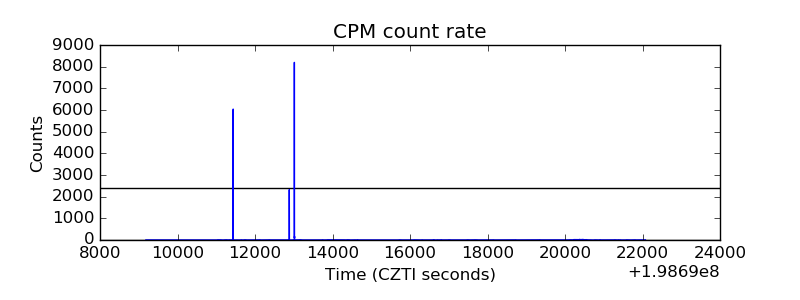 |
| CZT Counter | 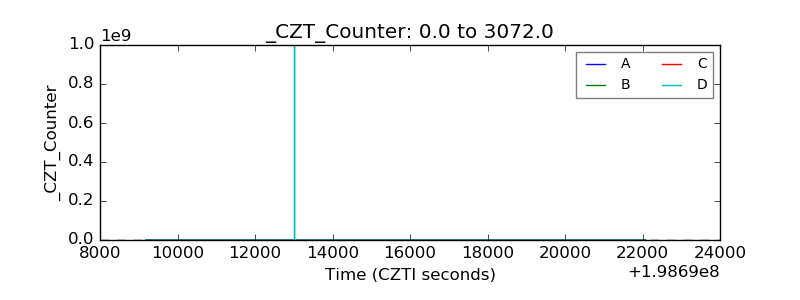 |
| +2.5 Volts monitor |  |
| +5 Volts monitor |  |
| Veto Counter | 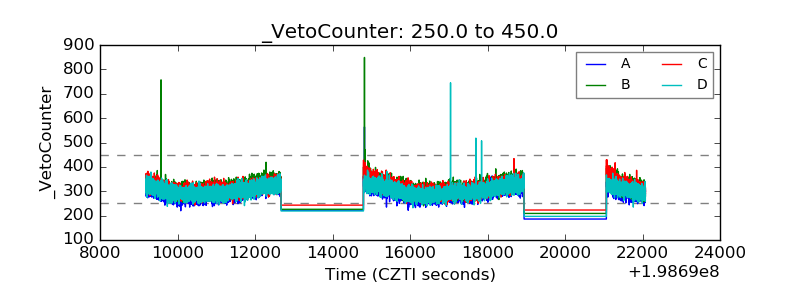 |