| Param | Original file | Final file |
|---|---|---|
| Filename | modeM0/AS1G05_238T02_9000000420_03020cztM0_level2.evt | modeM0/AS1G05_238T02_9000000420_03020cztM0_level2_quad_clean.evt |
| Size (bytes) | 347,267,520 | 48,070,080 |
| Size | 331.2 MB | 45.8 MB |
| Events in quadrant A | 2,650,901 | 271,389 |
| Events in quadrant B | 2,717,058 | 271,281 |
| Events in quadrant C | 2,400,590 | 266,797 |
| Events in quadrant D | 2,376,130 | 263,074 |
| Mode M0 | |||
|---|---|---|---|
| Quadrant | BADHDUFLAG | Total packets | Discarded packets |
| A | 0 | 11393 | 3 |
| B | 0 | 11619 | 2 |
| C | 0 | 11233 | 2 |
| D | 0 | 11242 | 2 |
| Mode SS | |||
|---|---|---|---|
| Quadrant | BADHDUFLAG | Total packets | Discarded packets |
| A | 0 | 114 | 0 |
| B | 0 | 114 | 0 |
| C | 0 | 114 | 0 |
| D | 0 | 114 | 0 |
| Mode M9 | |||
|---|---|---|---|
| Quadrant | BADHDUFLAG | Total packets | Discarded packets |
| A | 0 | 43 | 0 |
| B | 0 | 43 | 0 |
| C | 0 | 43 | 0 |
| D | 0 | 43 | 0 |
| Quadrant | Total seconds | Saturated seconds | Saturation percentage |
|---|---|---|---|
| A | 5461 | 9 | 0.164805% |
| B | 5461 | 25 | 0.457792% |
| C | 5461 | 15 | 0.274675% |
| D | 5461 | 10 | 0.183117% |
Noise dominated data is calculated using 1-second bins in cleaned event files. If a bin has >2000 counts, and if more than 50% of those come from <1% of pixels, then it is considered to be noise-dominated and hence unusable.
| Quadrant | # 1 sec bins | Bins with >0 counts | Bins with >2000 counts | High rate bins dominated by noise | Noise dominated (total time) | Noise dominated (detector-on time) | Marked lightcurve |
|---|---|---|---|---|---|---|---|
| A | 9773 | 5463 | 0 | 0 | 0.00% | 0.00% | 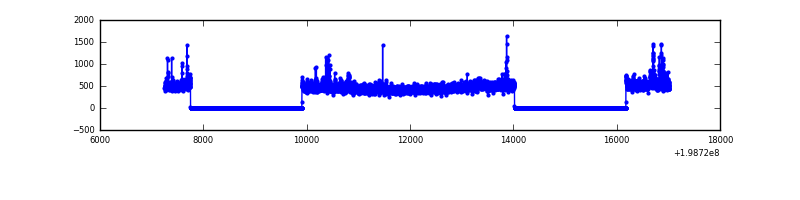 |
| B | 9773 | 5463 | 9 | 9 | 0.09% | 0.16% | 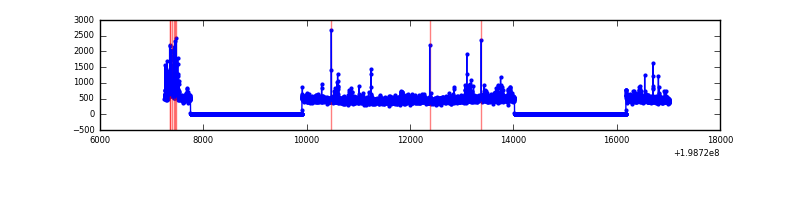 |
| C | 9773 | 5463 | 10 | 10 | 0.10% | 0.18% | 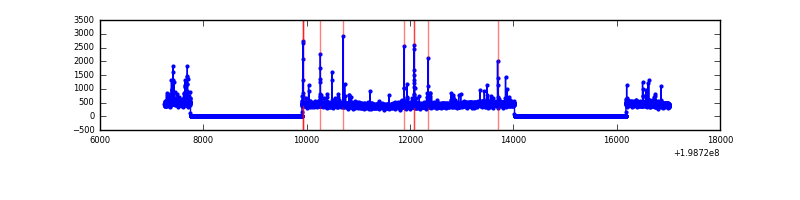 |
| D | 9773 | 5463 | 14 | 14 | 0.14% | 0.26% | 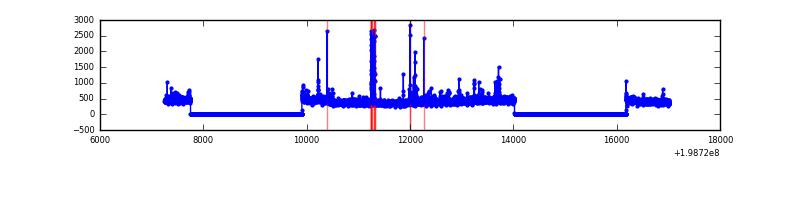 |
Top three noisy pixels from each quadrant. If the there are fewer than three noisy pixels in the level2.evt file, extra rows are filled as -1
| Pixel properties | Quadrant properties | ||||||
|---|---|---|---|---|---|---|---|
| Quadrant | DetID | PixID | Counts | Sigma | Mean | Median | Sigma |
| A | 8 | 15 | 158369 | 1301.04 | 598 | 584 | 121.3 |
| A | 0 | 50 | 149344 | 1226.63 | 598 | 584 | 121.3 |
| A | 13 | 251 | 14517 | 114.89 | 598 | 584 | 121.3 |
| B | 15 | 204 | 167910 | 1413.99 | 607 | 593 | 118.3 |
| B | 0 | 219 | 72379 | 606.66 | 607 | 593 | 118.3 |
| B | 4 | 81 | 62206 | 520.69 | 607 | 593 | 118.3 |
| C | 6 | 80 | 73840 | 539.13 | 576 | 579 | 135.9 |
| C | 0 | 219 | 31814 | 229.86 | 576 | 579 | 135.9 |
| C | 1 | 192 | 17900 | 127.47 | 576 | 579 | 135.9 |
| D | 2 | 152 | 102335 | 732.66 | 573 | 559 | 138.9 |
| D | 2 | 209 | 35586 | 252.15 | 573 | 559 | 138.9 |
| D | 2 | 136 | 22077 | 154.9 | 573 | 559 | 138.9 |
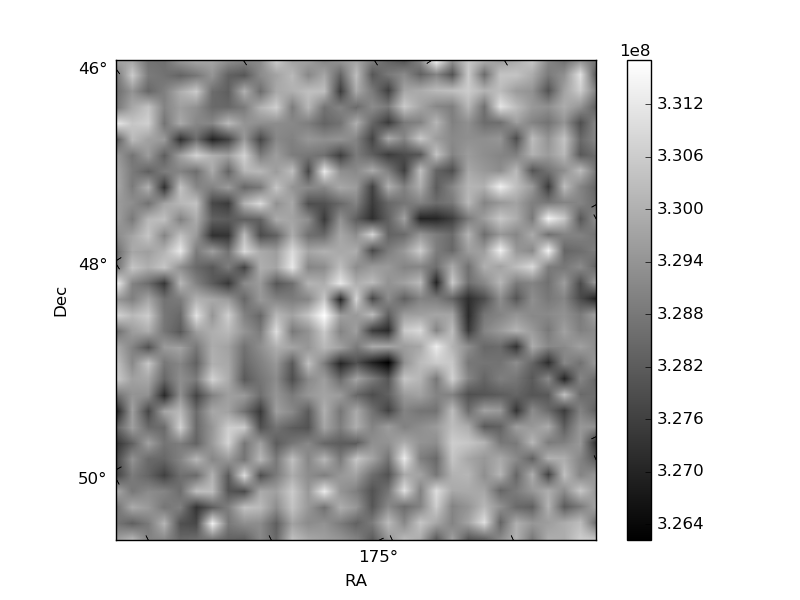
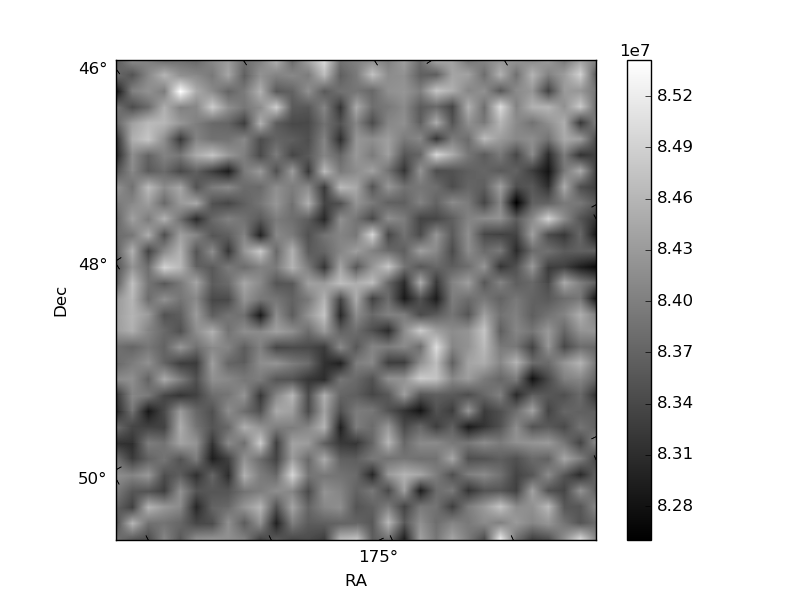
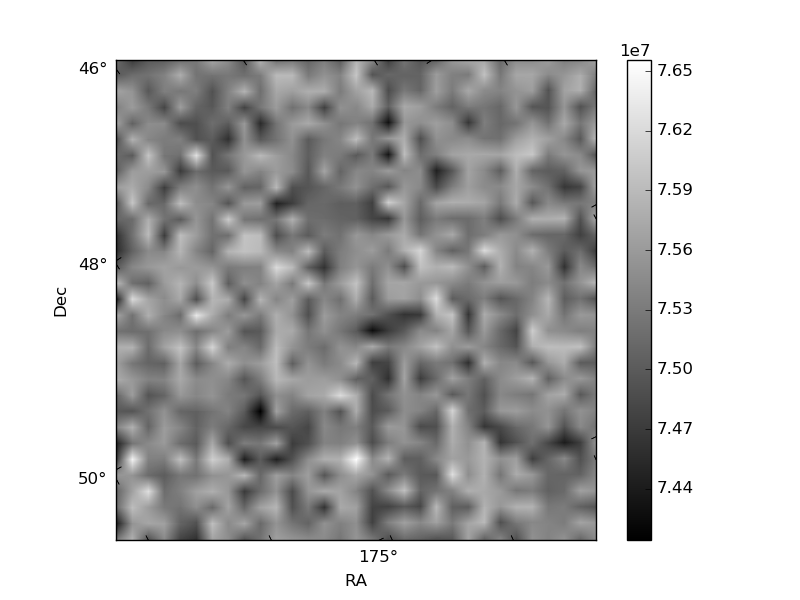
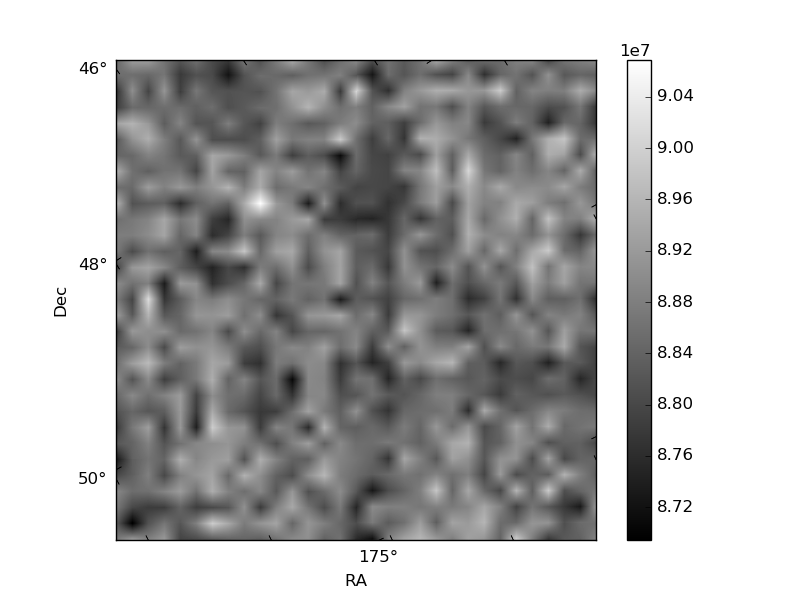
Histogram calculated using DETX and DETY for each event in the final _common_clean file
| Quadrant A | 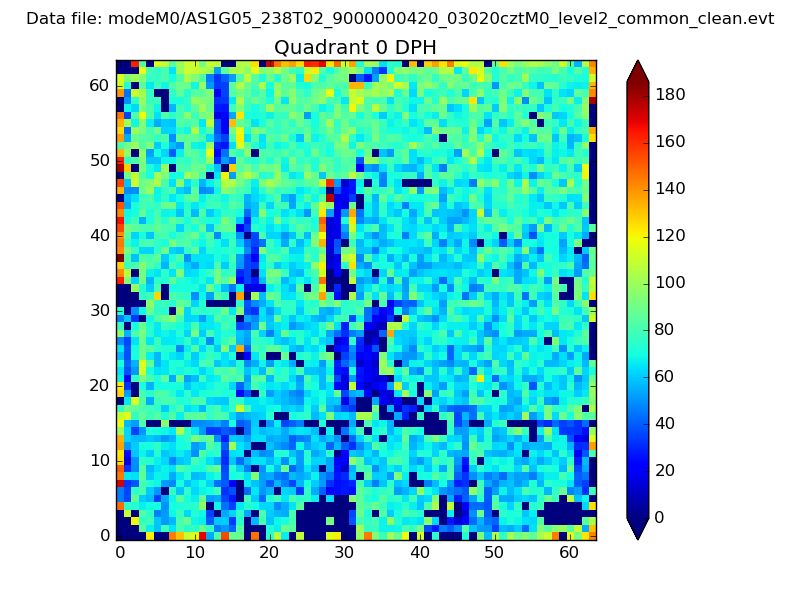 |
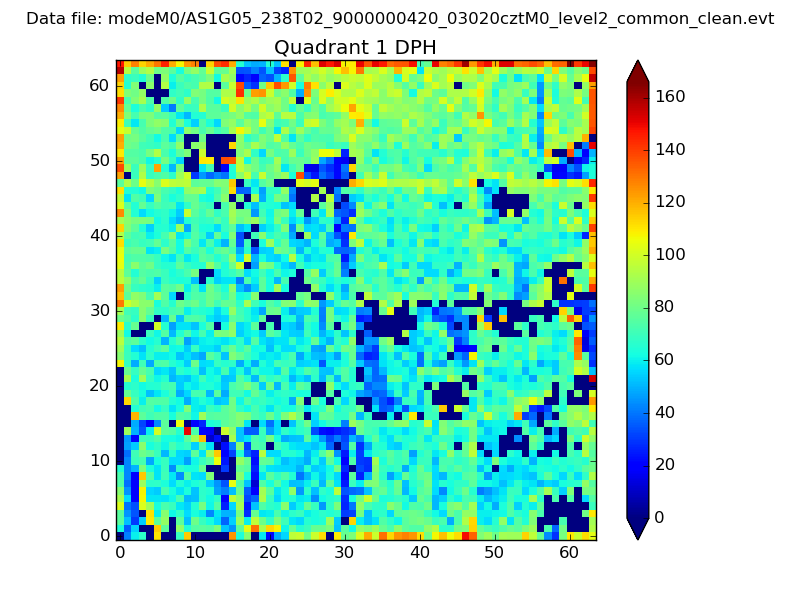 |
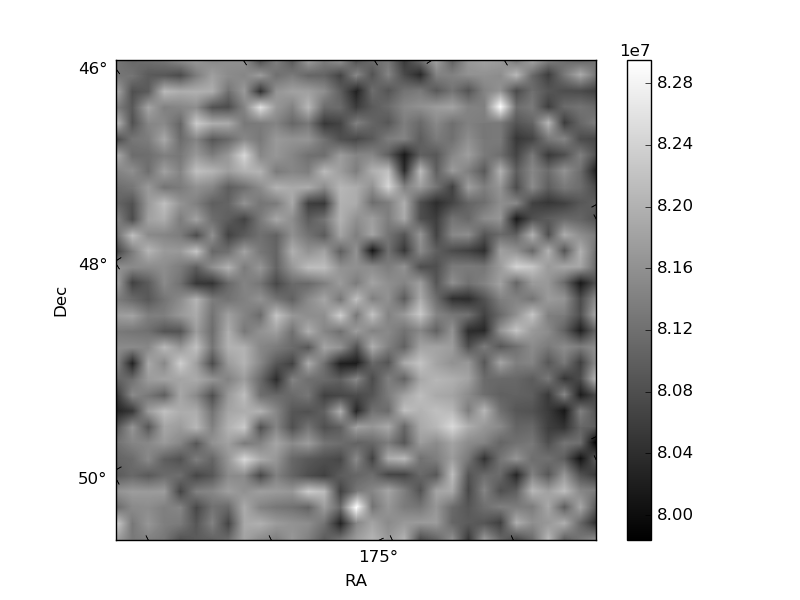
Quadrant B |
|---|---|---|---|
| Quadrant D | 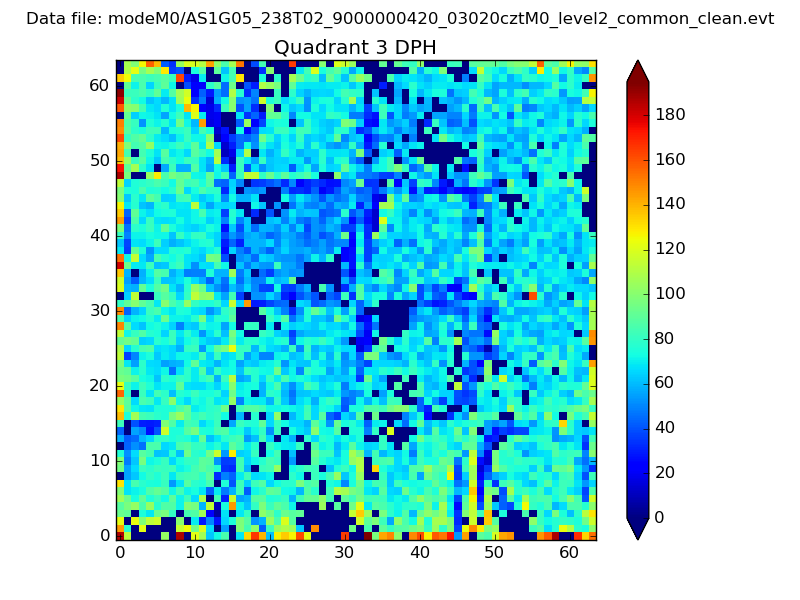 |
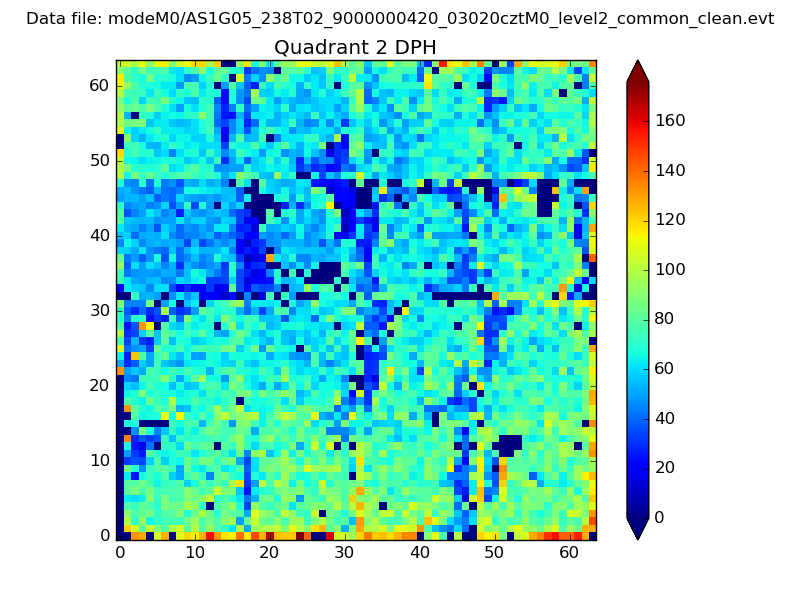 |
Quadrant C |
| Plot type | Count rate plots | Images |
|---|---|---|
| Comparison with Poisson distribution Blue bars denote a histogram of data divided into 1 sec bins. Red curve is a Poisson curve with rate = median count rate of data. |
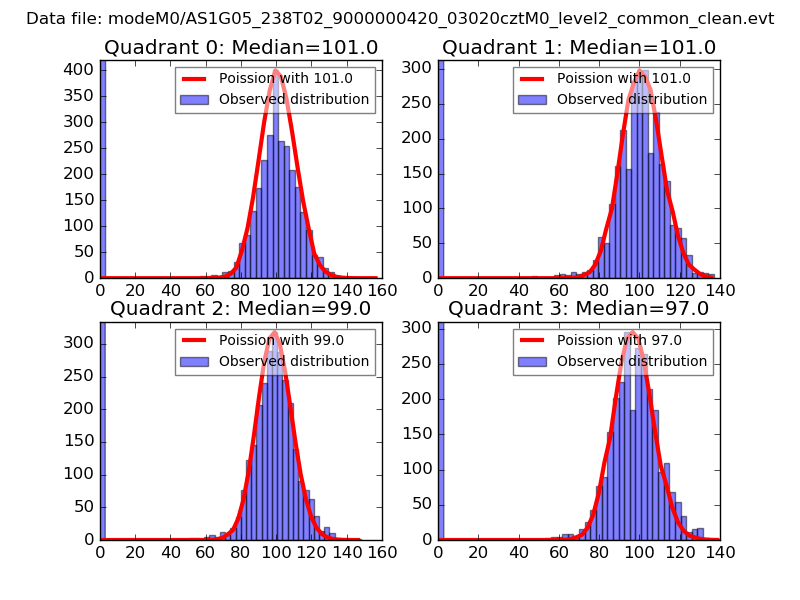 |
 |
| Quadrant-wise count rates Data is divided into 100 sec bins |
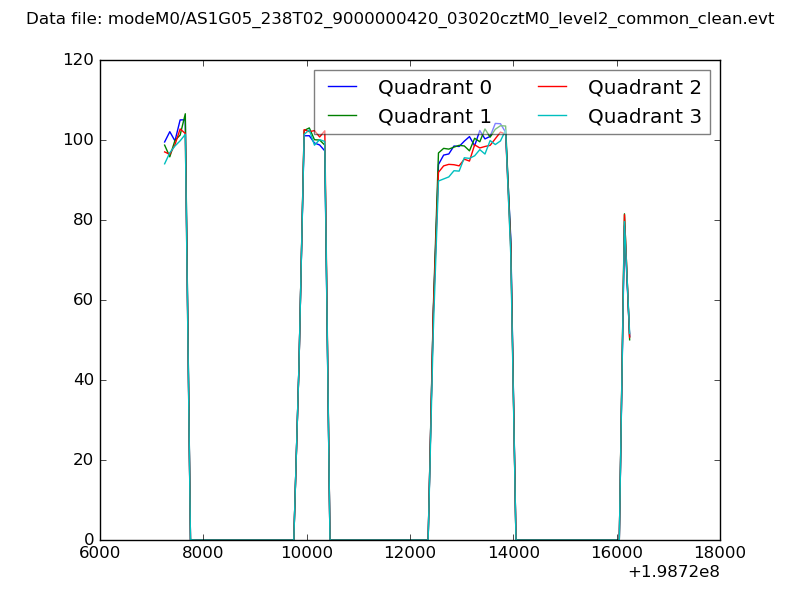 |
|
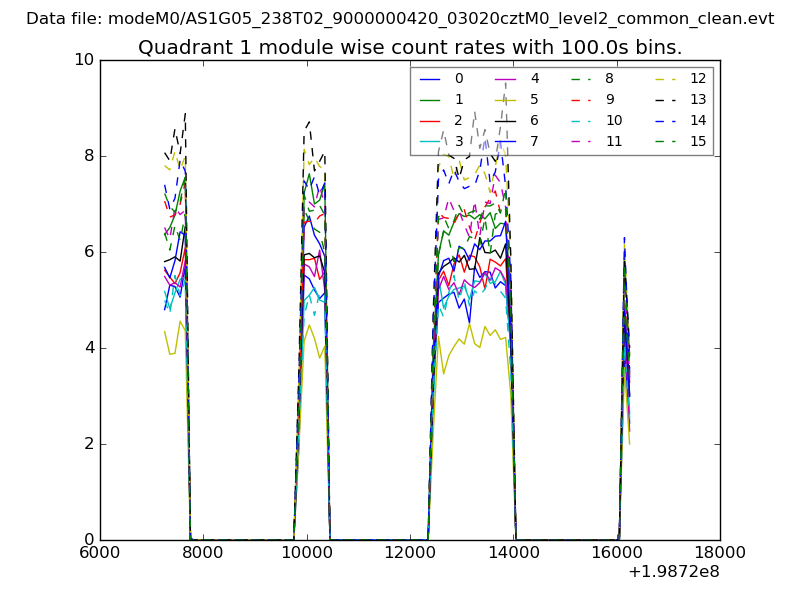
| Module-wise count rates for Quadrant A Data is divided into 100 sec bins |
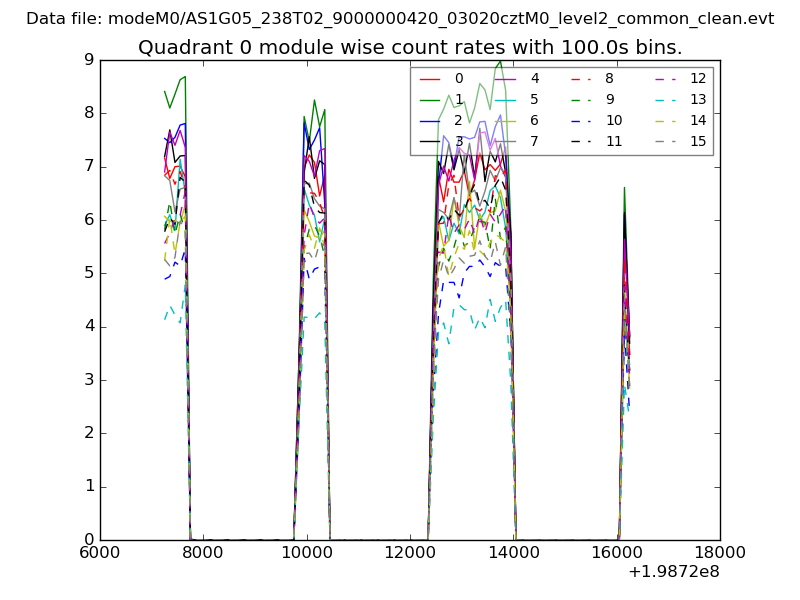 |
 |
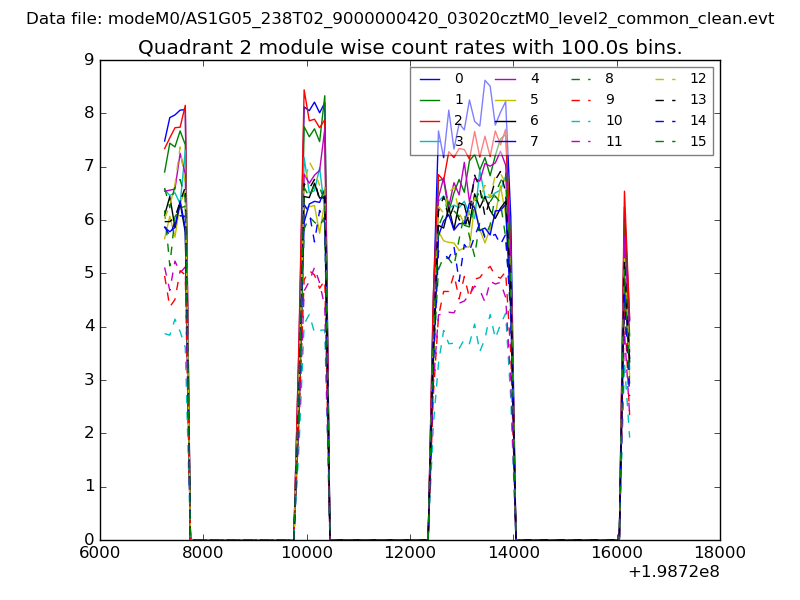
| Module-wise count rates for Quadrant B Data is divided into 100 sec bins |
 |
 |
| Module-wise count rates for Quadrant C Data is divided into 100 sec bins |
 |
 |
| Module-wise count rates for Quadrant D Data is divided into 100 sec bins |
 |
 |
| Parameter | Plot |
|---|---|
| CZT HV Monitor | 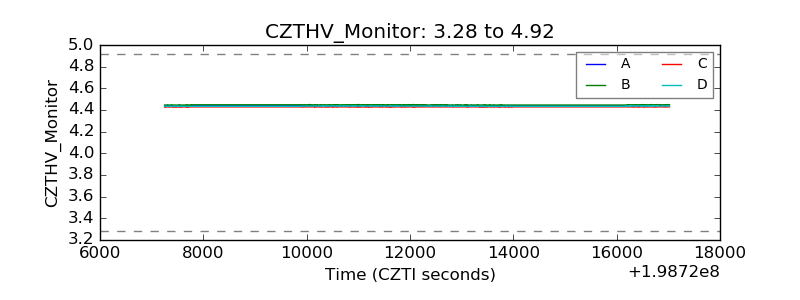 |
| D_VDD | 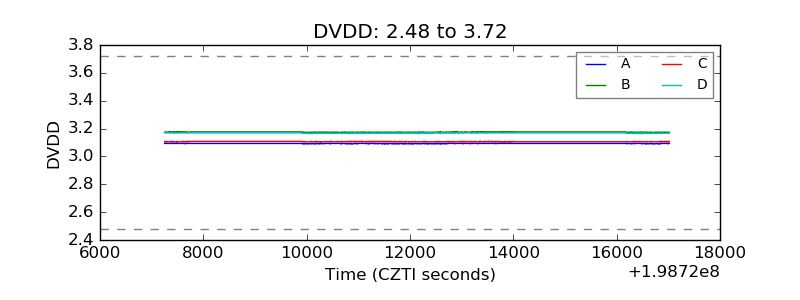 |
| Temperature 1 | 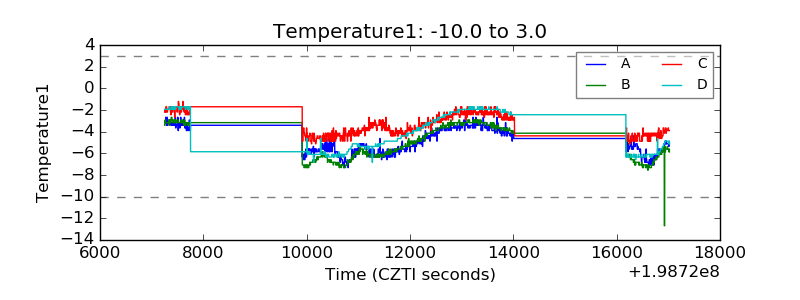 |
| Veto HV Monitor | 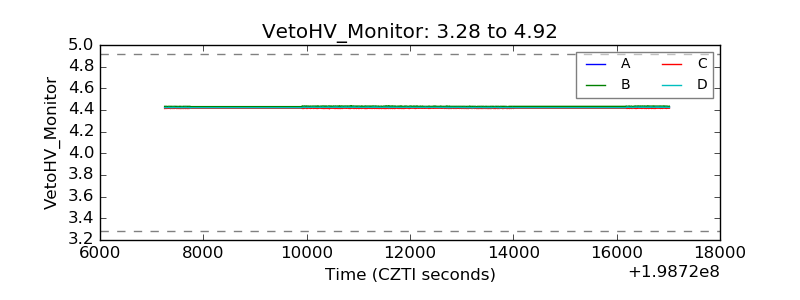 |
| Veto LLD | 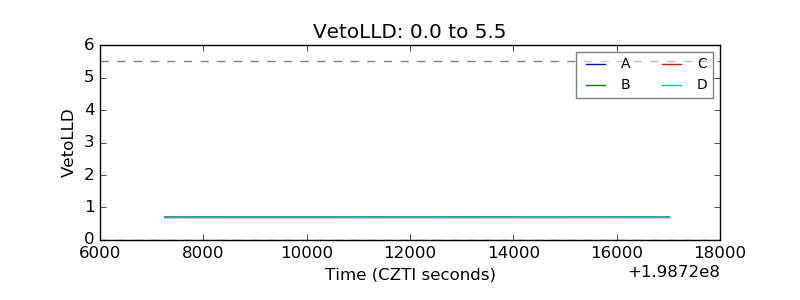 |
| Alpha Counter | 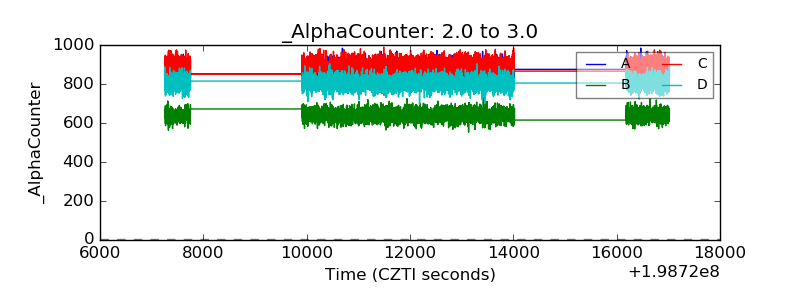 |
| _CPM_Rate | 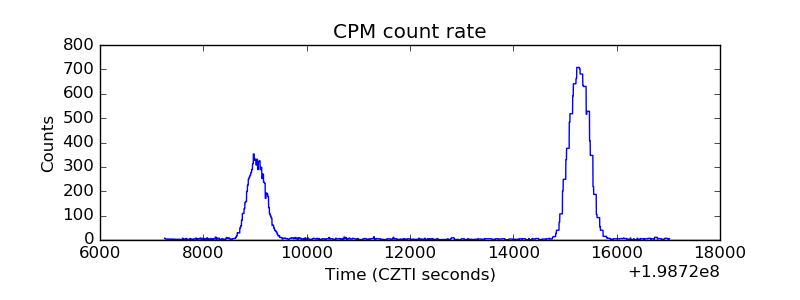 |
| CZT Counter | 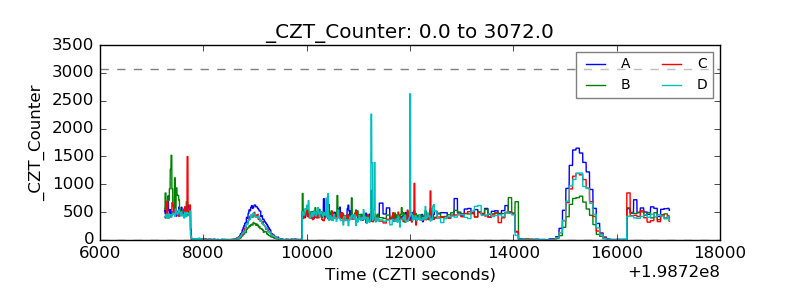 |
| +2.5 Volts monitor |  |
| +5 Volts monitor | 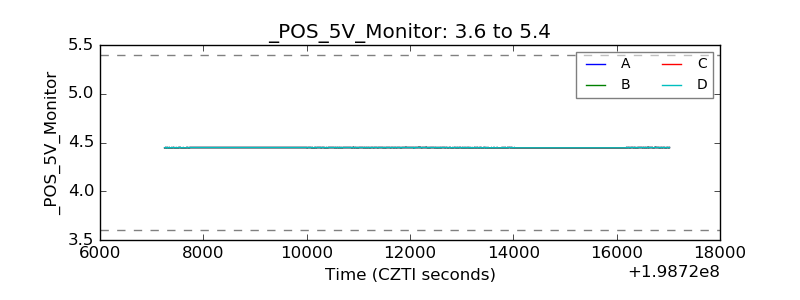 |
| Veto Counter | 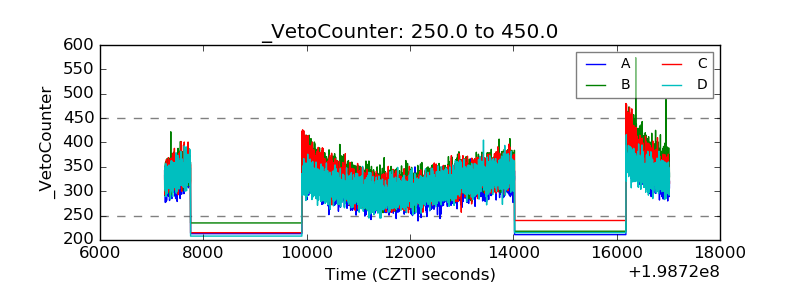 |