| Param | Original file | Final file |
|---|---|---|
| Filename | modeM0/AS1G05_238T02_9000000420_03022cztM0_level2.evt | modeM0/AS1G05_238T02_9000000420_03022cztM0_level2_quad_clean.evt |
| Size (bytes) | 376,338,240 | 47,111,040 |
| Size | 358.9 MB | 44.9 MB |
| Events in quadrant A | 3,105,986 | 262,893 |
| Events in quadrant B | 2,869,822 | 263,387 |
| Events in quadrant C | 2,457,489 | 257,641 |
| Events in quadrant D | 2,586,261 | 253,670 |
| Mode M0 | |||
|---|---|---|---|
| Quadrant | BADHDUFLAG | Total packets | Discarded packets |
| A | 0 | 12720 | 3 |
| B | 0 | 12084 | 2 |
| C | 0 | 11319 | 2 |
| D | 0 | 11871 | 2 |
| Mode SS | |||
|---|---|---|---|
| Quadrant | BADHDUFLAG | Total packets | Discarded packets |
| A | 0 | 114 | 0 |
| B | 0 | 114 | 0 |
| C | 0 | 114 | 0 |
| D | 0 | 114 | 0 |
| Mode M9 | |||
|---|---|---|---|
| Quadrant | BADHDUFLAG | Total packets | Discarded packets |
| A | 0 | 43 | 0 |
| B | 0 | 43 | 0 |
| C | 0 | 43 | 0 |
| D | 0 | 43 | 0 |
| Quadrant | Total seconds | Saturated seconds | Saturation percentage |
|---|---|---|---|
| A | 5554 | 30 | 0.540151% |
| B | 5554 | 45 | 0.810227% |
| C | 5554 | 12 | 0.216060% |
| D | 5554 | 7 | 0.126035% |
Noise dominated data is calculated using 1-second bins in cleaned event files. If a bin has >2000 counts, and if more than 50% of those come from <1% of pixels, then it is considered to be noise-dominated and hence unusable.
| Quadrant | # 1 sec bins | Bins with >0 counts | Bins with >2000 counts | High rate bins dominated by noise | Noise dominated (total time) | Noise dominated (detector-on time) | Marked lightcurve |
|---|---|---|---|---|---|---|---|
| A | 9866 | 5556 | 11 | 11 | 0.11% | 0.20% | 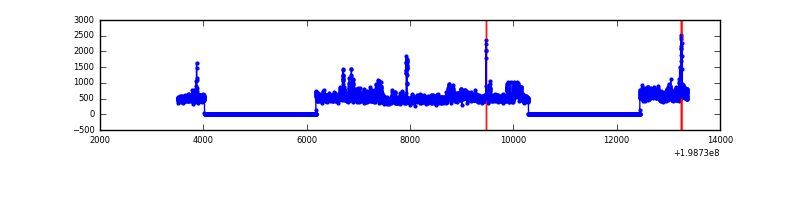 |
| B | 9866 | 5556 | 35 | 35 | 0.35% | 0.63% | 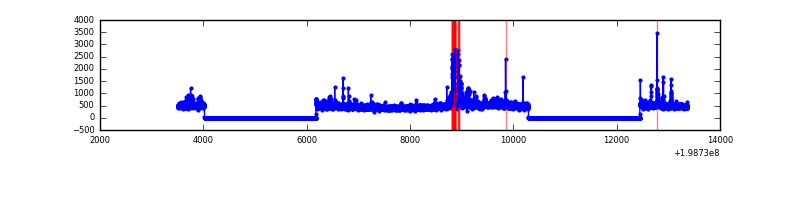 |
| C | 9866 | 5556 | 6 | 6 | 0.06% | 0.11% | 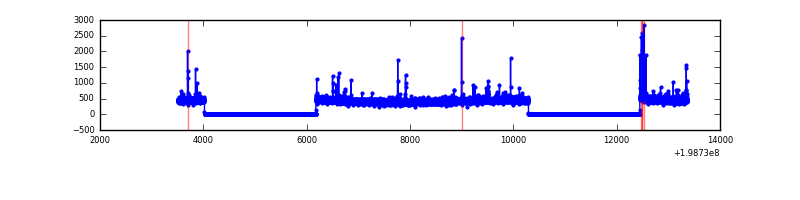 |
| D | 9866 | 5556 | 4 | 4 | 0.04% | 0.07% | 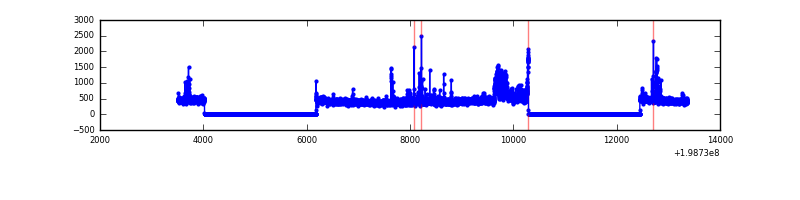 |
Top three noisy pixels from each quadrant. If the there are fewer than three noisy pixels in the level2.evt file, extra rows are filled as -1
| Pixel properties | Quadrant properties | ||||||
|---|---|---|---|---|---|---|---|
| Quadrant | DetID | PixID | Counts | Sigma | Mean | Median | Sigma |
| A | 8 | 15 | 381643 | 3008.18 | 624 | 611 | 126.7 |
| A | 0 | 50 | 276043 | 2174.48 | 624 | 611 | 126.7 |
| A | 13 | 14 | 17390 | 132.47 | 624 | 611 | 126.7 |
| B | 15 | 204 | 141719 | 1163.5 | 632 | 618 | 121.3 |
| B | 0 | 230 | 114917 | 942.49 | 632 | 618 | 121.3 |
| B | 0 | 219 | 78850 | 645.09 | 632 | 618 | 121.3 |
| C | 6 | 80 | 47373 | 334.93 | 600 | 603 | 139.6 |
| C | 1 | 192 | 17643 | 122.03 | 600 | 603 | 139.6 |
| C | 0 | 219 | 14745 | 101.27 | 600 | 603 | 139.6 |
| D | 13 | 114 | 196836 | 1368.64 | 599 | 584 | 143.4 |
| D | 7 | 80 | 35329 | 242.31 | 599 | 584 | 143.4 |
| D | 13 | 223 | 23650 | 160.86 | 599 | 584 | 143.4 |
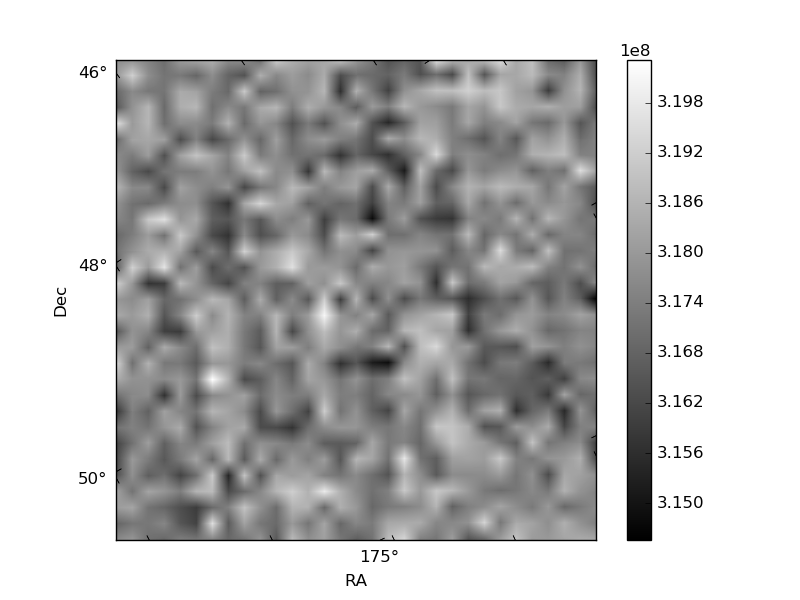
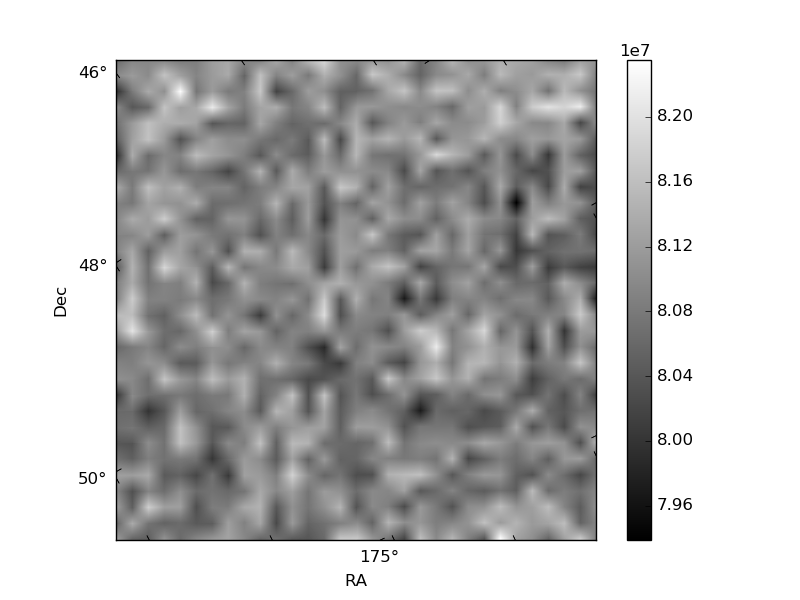
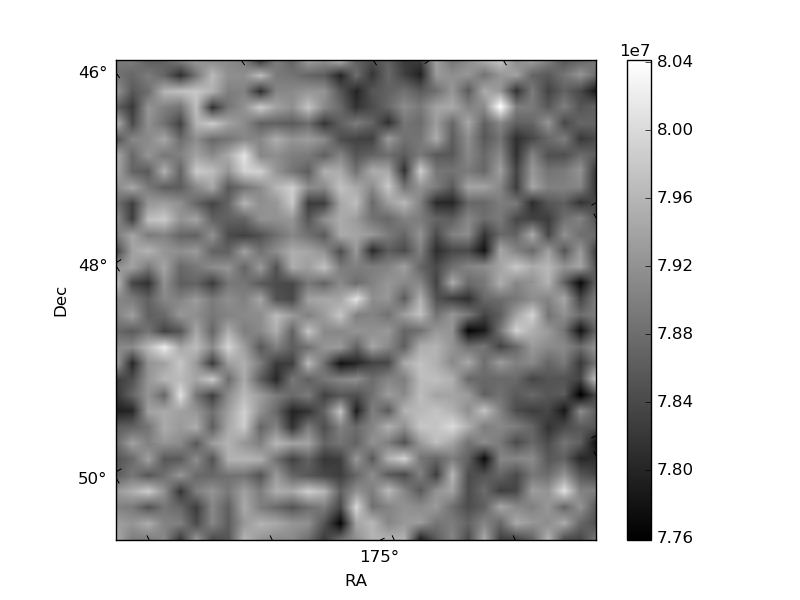
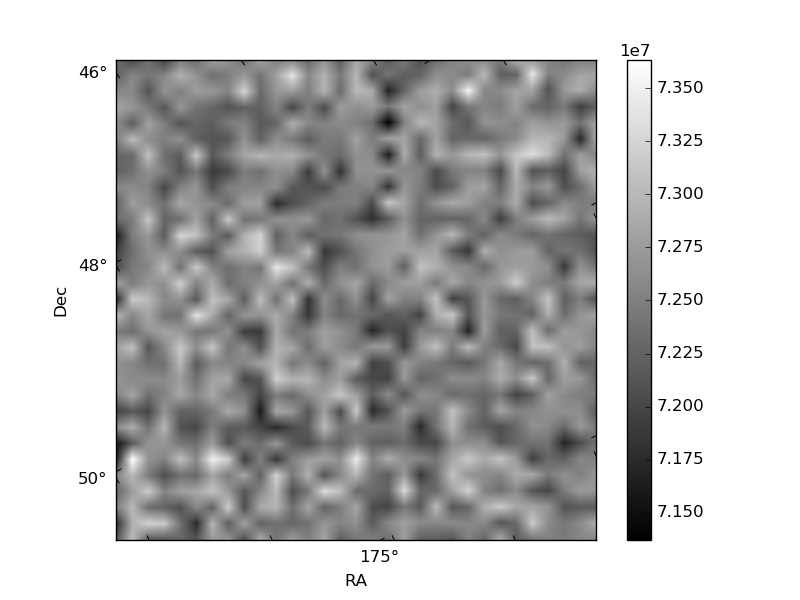
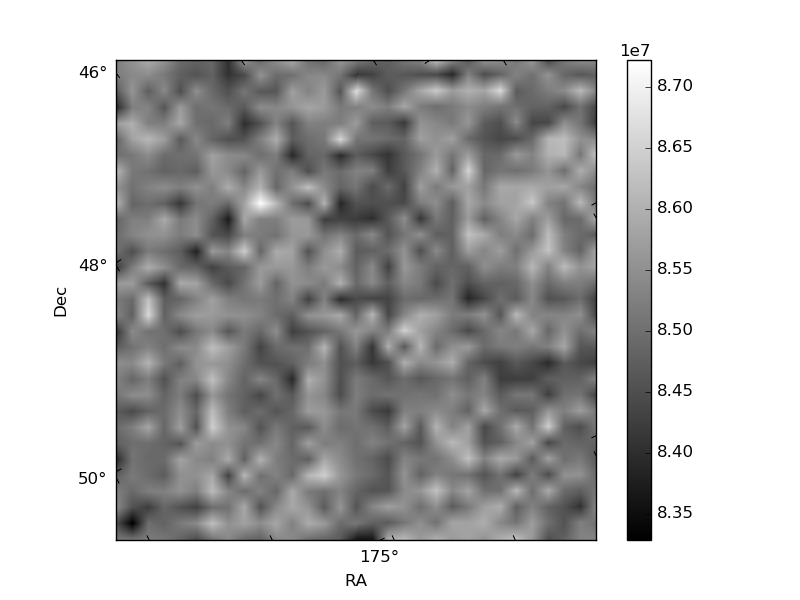
Histogram calculated using DETX and DETY for each event in the final _common_clean file
| Quadrant A | 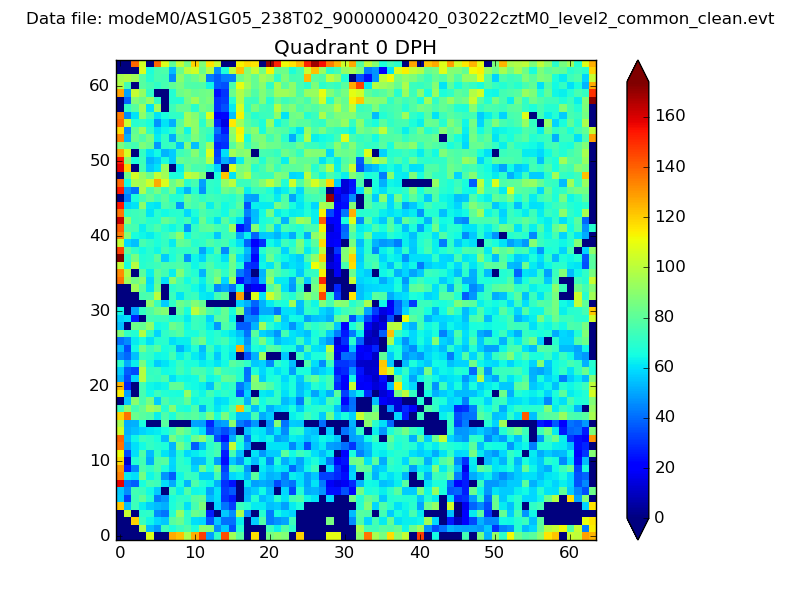 |
 |
Quadrant B |
|---|---|---|---|
| Quadrant D | 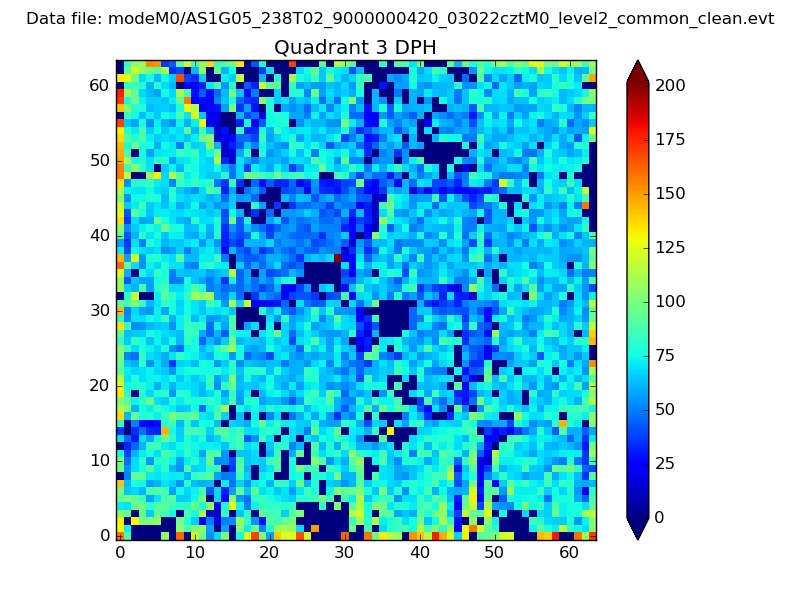 |
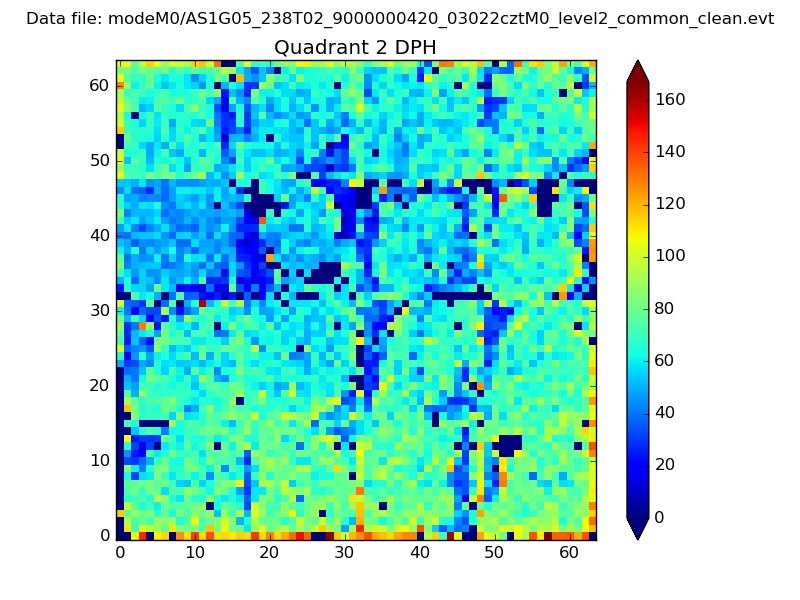 |
Quadrant C |
| Plot type | Count rate plots | Images |
|---|---|---|
| Comparison with Poisson distribution Blue bars denote a histogram of data divided into 1 sec bins. Red curve is a Poisson curve with rate = median count rate of data. |
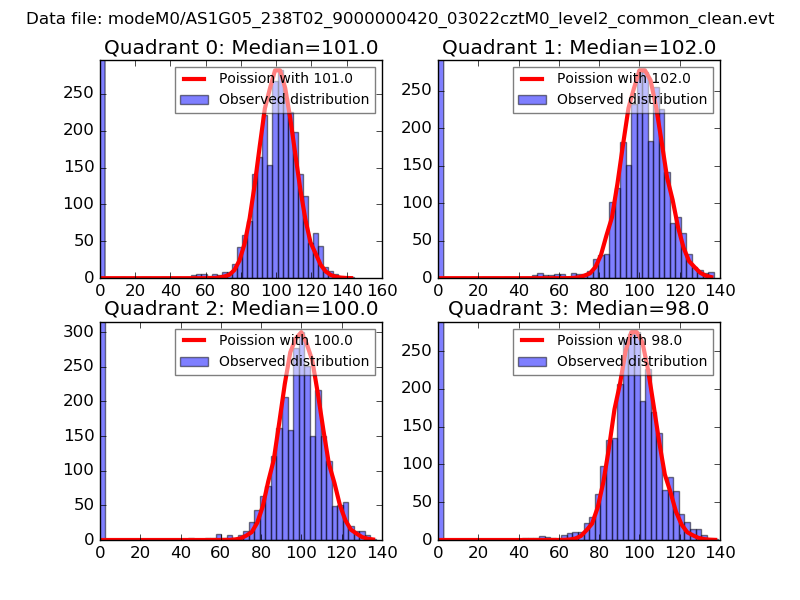 |
 |
| Quadrant-wise count rates Data is divided into 100 sec bins |
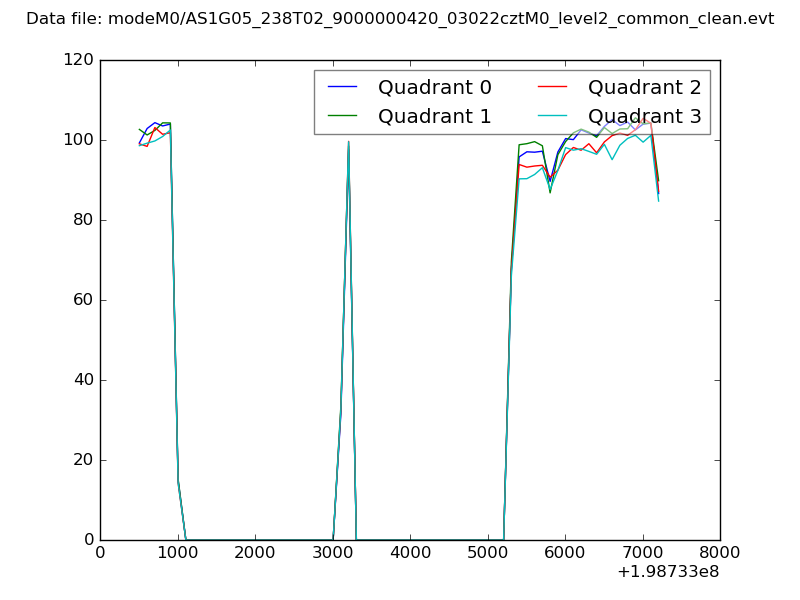 |
|
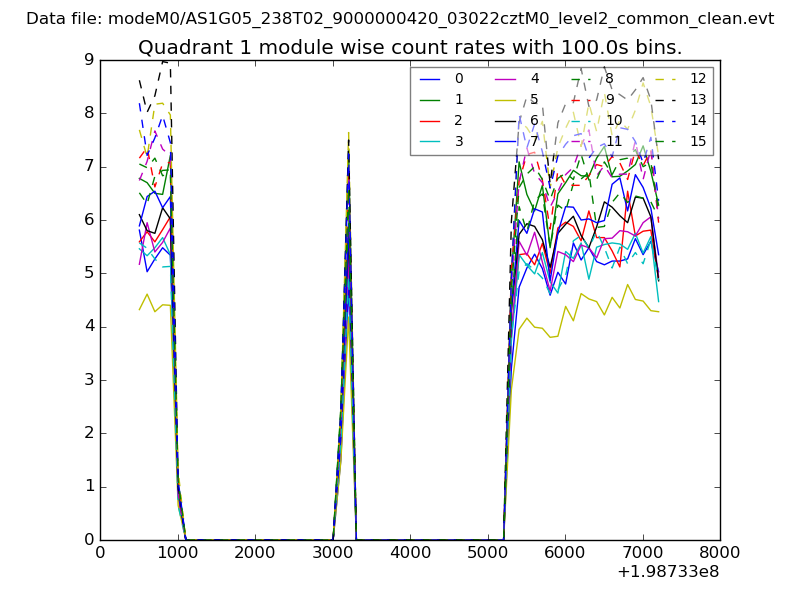
| Module-wise count rates for Quadrant A Data is divided into 100 sec bins |
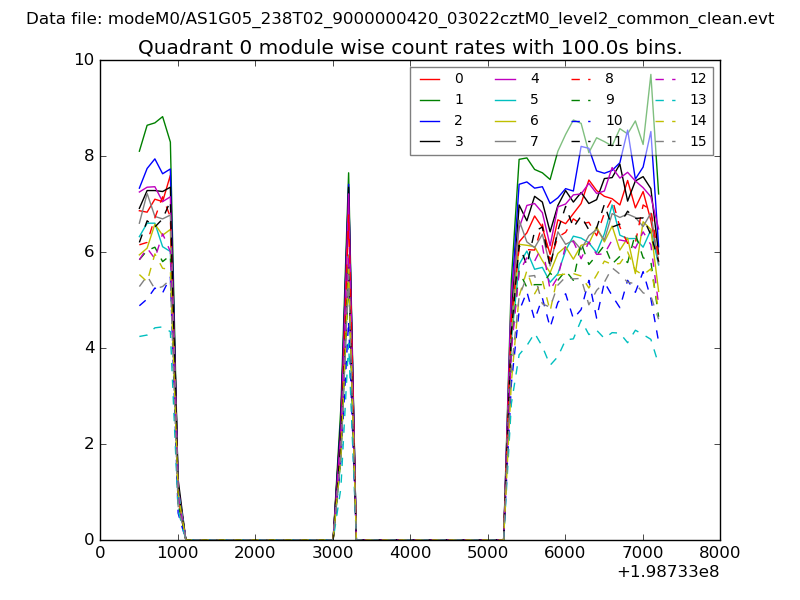 |
 |
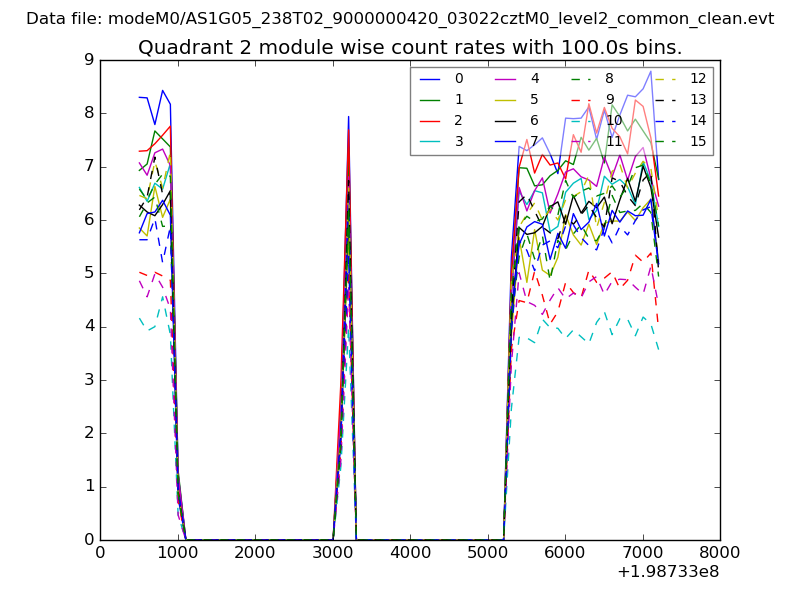
| Module-wise count rates for Quadrant B Data is divided into 100 sec bins |
 |
 |
| Module-wise count rates for Quadrant C Data is divided into 100 sec bins |
 |
 |
| Module-wise count rates for Quadrant D Data is divided into 100 sec bins |
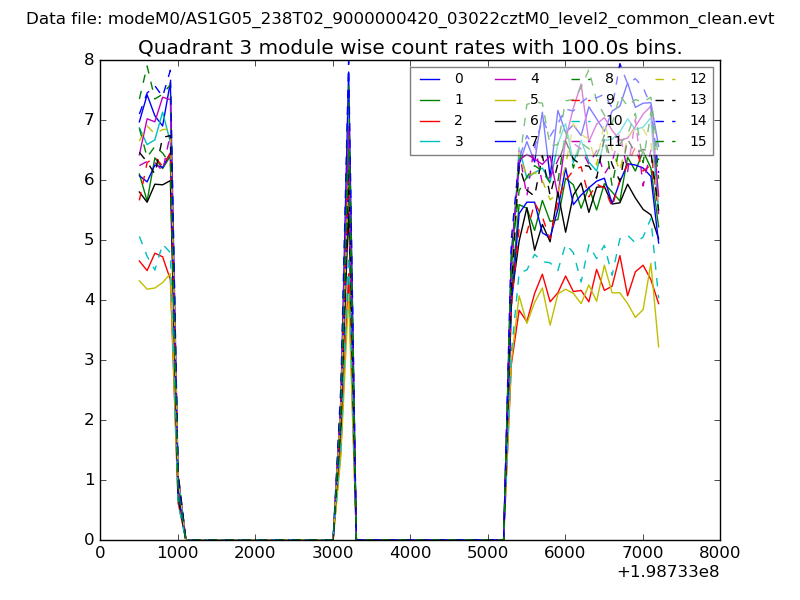 |
 |
| Parameter | Plot |
|---|---|
| CZT HV Monitor | 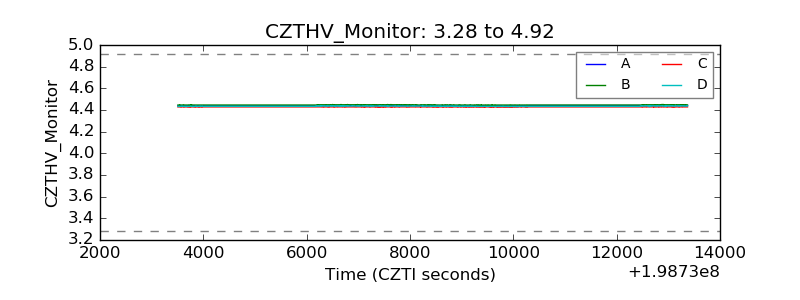 |
| D_VDD | 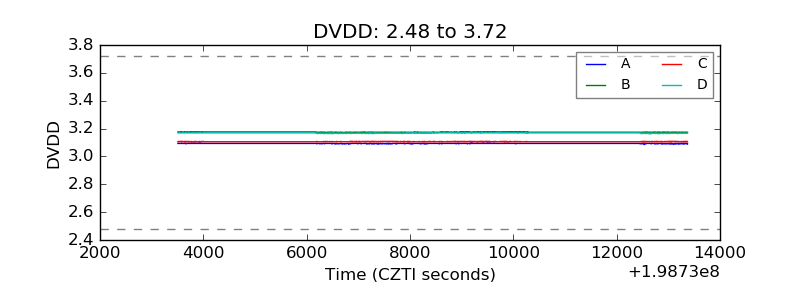 |
| Temperature 1 | 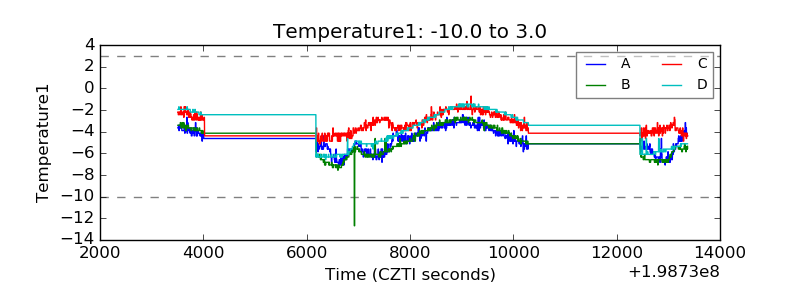 |
| Veto HV Monitor | 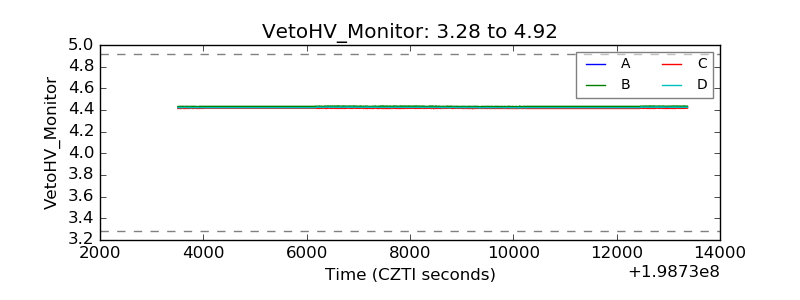 |
| Veto LLD | 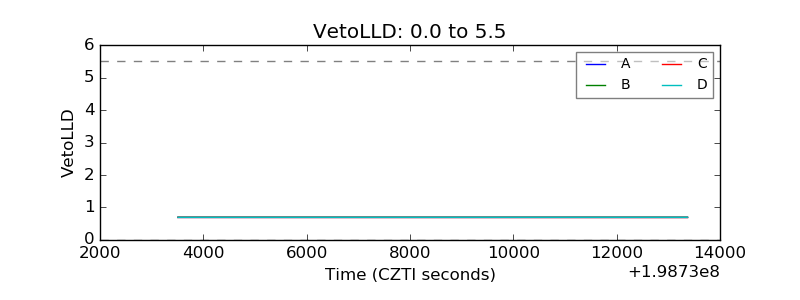 |
| Alpha Counter |  |
| _CPM_Rate | 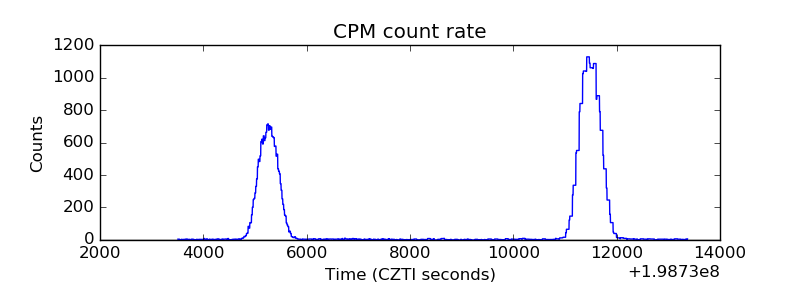 |
| CZT Counter | 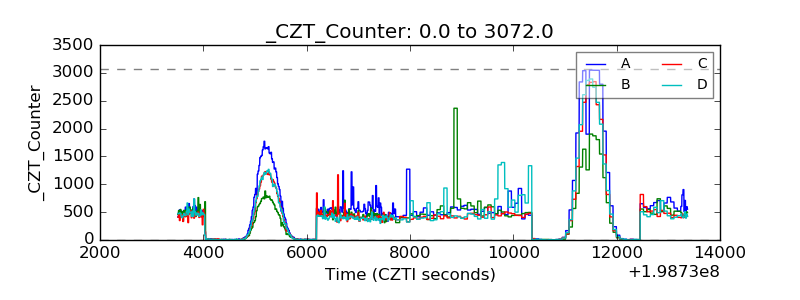 |
| +2.5 Volts monitor |  |
| +5 Volts monitor |  |
| Veto Counter |  |